VSAwithPALibrary "VSAwithPA"
getVsaSignal(vol_ma_len, avgs, ma_type, red_thresh, orange_thresh, yellow_thresh, blue_thresh)
Calculates the core VSA signal.
Parameters:
vol_ma_len (simple int)
avgs (int)
ma_type (string)
red_thresh (float)
orange_thresh (float)
yellow_thresh (float)
blue_thresh (float)
Returns: A tuple: .
format_vertical(_text)
Formats a string to be displayed vertically.
Parameters:
_text (string)
plotVsaLabel(show_labels, labelText, use_vertical_labels, label_size_option, label_pos_option, y_level_for_line, candleColor)
Plots a VSA label on the chart.
Parameters:
show_labels (bool)
labelText (string)
use_vertical_labels (bool)
label_size_option (string)
label_pos_option (string)
y_level_for_line (float)
candleColor (color)
drawVsaLine(show_lines, show_signal_line, delete_prev_lines, prev_line, y_level, line_color, line_width, line_style_option, line_extend_option)
Draws a horizontal line for a VSA signal.
Parameters:
show_lines (bool)
show_signal_line (bool)
delete_prev_lines (bool)
prev_line (line)
y_level (float)
line_color (color)
line_width (int)
line_style_option (string)
line_extend_option (string)
Returns: (line) The ID of the newly created line.
getWcma(show, len)
CORRECTED: Calculates a Weighted Close Moving Average and returns the value.
Parameters:
show (bool)
len (int)
Returns: (series float) The calculated WCMA value, or na.
Indicators and strategies

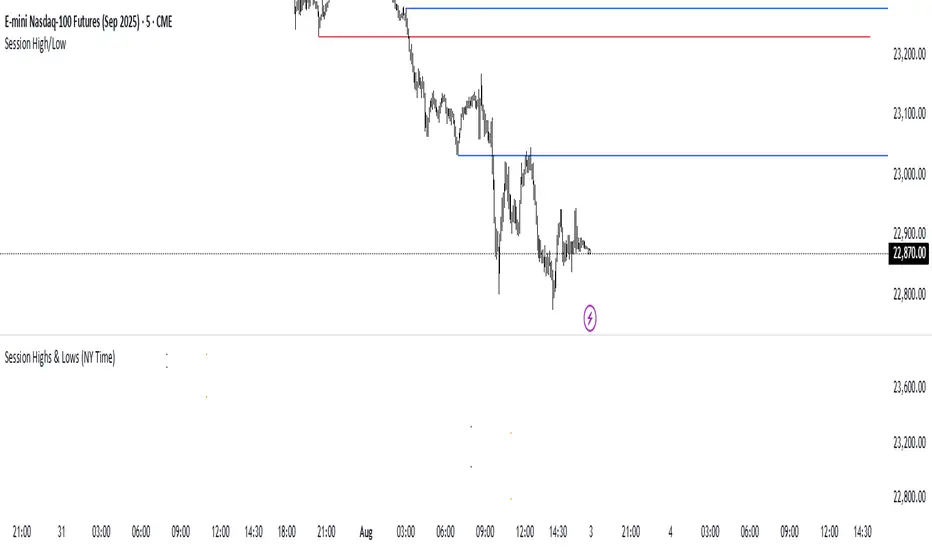
Session Highs & Lows (NY Time)Marks out Asian session high and low, and London session high and low, this makes it easier for you to easily marks out important highs and lows on the chart when trading.
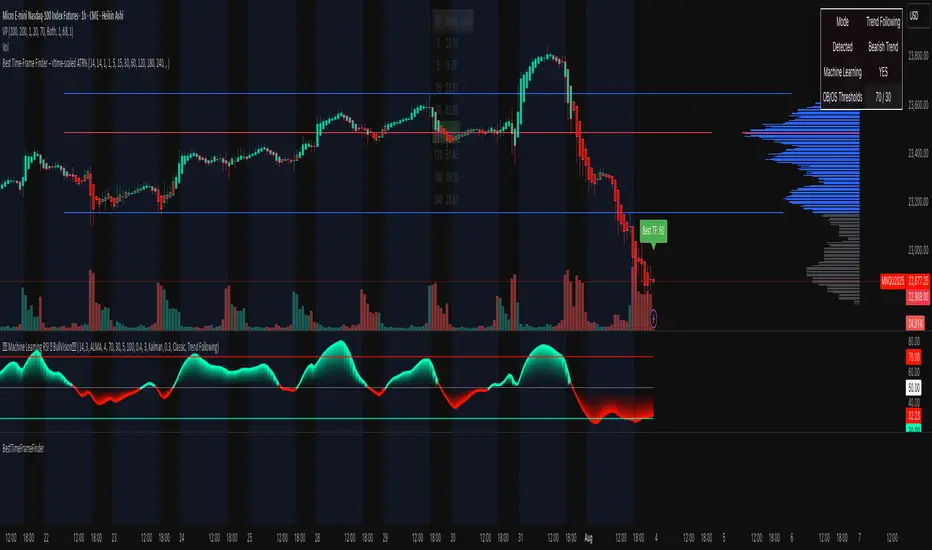
BestTimeFrameFinderLibrary "BestTimeFrameFinder"
adx(len)
Parameters:
len (simple int)
atrPercent(len)
Parameters:
len (simple int)
scaleFromTf(tf, atrWeight)
Parameters:
tf (string)
atrWeight (simple float)
scoreLocal(adxLen, atrLen, scale)
Parameters:
adxLen (simple int)
atrLen (simple int)
scale (simple float)
maxInArray(arr)
Parameters:
arr (array)
Mara JPY Strength (USDJPY+EURJPY+GBPJPY)/3 + DXYJPY, USDJPY, EURJPY, GBPJPY, smart money, bias, index, forex indicator, DXY, strength meter, professional, trading tool, price action

Mara JPY Bias ProMara JPY Bias Pro™ is a precision tool built for serious traders who focus on JPY and USD pairs.
This synthetic index combines USDJPY + EURJPY + GBPJPY, generating a smooth and dynamic representation of JPY strength or weakness. When the line turns green, JPY is weakening — time to look for LONG setups on XXX/JPY pairs. When red, JPY is strengthening — ideal moment for SHORT trades.
Built-in bias logic with adjustable MA-based trend detection or slope/momentum view lets you customize signals based on your strategy.
Plus, we’ve included a normalized DXY overlay, so you can track USD strength in parallel — perfect for traders working with EUR/USD, GBP/USD, USD/JPY and JPY crosses.
💡 Designed for day traders, scalpers, and smart money traders looking for clean confluence.
✅ Features:
Visual color-coded JPY bias (Green = Long / Red = Short)
Optional USD (DXY) strength overlay
Customizable MA length and bias logic
Built-in alerts for bias shifts & momentum flips
🔔 Alert-ready – never miss a reversal.
Trade smarter. Cut the noise. Stay on the right side of the move.

seed_data_library_5Library "seed_data_library_5"
setCombinedMap2A(m)
Parameters:
m (map)
setCombinedMap2B(m)
Parameters:
m (map)
getMarketCap(ticker)
Parameters:
ticker (string)
getRSRating(ticker)
Parameters:
ticker (string)
getIndustry(ticker)
Parameters:
ticker (string)
getSector(ticker)
Parameters:
ticker (string)

seed_data_library_4Library "seed_data_library_4"
setCombinedMap1A(m)
Parameters:
m (map)
setCombinedMap1B(m)
Parameters:
m (map)
getMarketCap(ticker)
Parameters:
ticker (string)
getRSRating(ticker)
Parameters:
ticker (string)
getIndustry(ticker)
Parameters:
ticker (string)
getSector(ticker)
Parameters:
ticker (string)

seed_data_library_3Library "seed_data_library_3"
setCombinedMap3A(m)
Parameters:
m (map)
setCombinedMap3B(m)
Parameters:
m (map)
getMarketCap(ticker)
Parameters:
ticker (string)
getRSRating(ticker)
Parameters:
ticker (string)
getIndustry(ticker)
Parameters:
ticker (string)
getSector(ticker)
Parameters:
ticker (string)

EMA 10/20/60/120// This script plots four Exponential Moving Averages (10, 20, 60, 120)
// for trend-following analysis. Crossovers and the order of the EMAs can
// help identify the strength and direction of the trend.

seed_data_library_2Library "seed_data_library_2"
setCombinedMap2A(m)
Parameters:
m (map)
setCombinedMap2B(m)
Parameters:
m (map)
getMarketCap(ticker)
Parameters:
ticker (string)
getRSRating(ticker)
Parameters:
ticker (string)
getIndustry(ticker)
Parameters:
ticker (string)
getSector(ticker)
Parameters:
ticker (string)

seed_data_library_1Library "seed_data_library_1"
setCombinedMap1A(m)
Parameters:
m (map)
setCombinedMap1B(m)
Parameters:
m (map)
getMarketCap(ticker)
Parameters:
ticker (string)
getRSRating(ticker)
Parameters:
ticker (string)
getIndustry(ticker)
Parameters:
ticker (string)
getSector(ticker)
Parameters:
ticker (string)


ercometiUzun Vadeli SMA'lar354 708 1062 1414 diaries for friends who want to make money in the long term

Position Sizing Based on 21-Day ATR % (30 Holdings)Vol targeting based on ATR instead of STD DEV for 30 holdings.

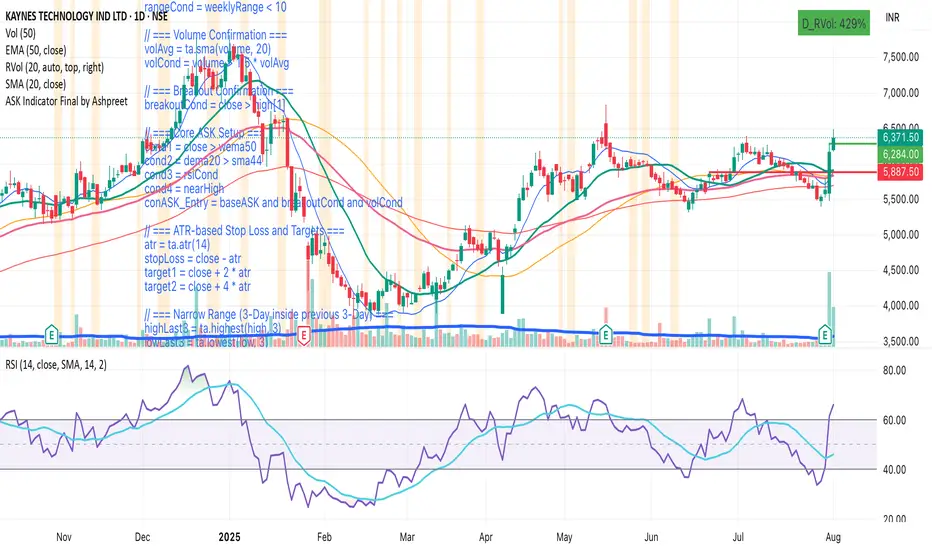
ASK Indicator by AshpreetThe ASK Indicator is a custom-built breakout and trend continuation system designed for swing traders seeking high-probability entries with strong risk-reward ratios. Built using a combination of moving averages, momentum filters, volume confirmation, and price structure, this indicator helps identify stocks poised for explosive moves.
It uses three key moving averages: the 44-period SMA (medium trend), 20-period DEMA (short-term strength, custom-coded), and 50-period WEMA (institutional trendline). Trades are only triggered when the price is above 50 WEMA, and the 20 DEMA is above the 44 SMA.
Momentum is confirmed using RSI(14) within a healthy zone of 40–60, ensuring the stock is not overbought or oversold. To focus on breakout candidates, the stock must be trading within 10% of its 52-week high, and the weekly candle range must be under 10%, signaling compression before expansion.
A valid ASK Signal occurs when these conditions are met along with a breakout above the previous day’s high and volume exceeding 1.5× the 20-day average. Once triggered, the indicator auto-plots the stop-loss (1× ATR) and two profit targets: 1:2 (TP1) and 1:4 (TP2).
Additionally, the system detects a narrow range setup, where the last 3 daily candles are inside the previous 3-day range — a powerful consolidation signal. Alerts for both ASK entries and narrow ranges are included.
This system is ideal for positional and short-term swing traders who want to combine structure, momentum, and volume in one powerful tool.
EMA Crossover with Volume + Stacked TP & Trailing SLI am relatively new here. Here is my humble contribution to the community. Simple does it! Ema 21,55 with volume. Surprisingly high win rates and good profit factors on USDJPY, EURJPY, BTCUSD, XAGUSD,XAUUSD, USOIL, USDCAD, EURGBP and AUDNZD. I cannot write a single line of code. I used Copilot for this.

ombs- PONY Breakout Alert
🧠 תקציר הסקריפט: **PONY Breakout Alert 📈
🔍 **מטרה**:
לזהות **פריצה מעלה של רמת 14.15** תוך כדי **מחזור מסחר גבוה מהממוצע**, כדי לאתר **הזדמנות מסחר שורית**.
---
⚙️ רכיבי הסקריפט:
* 📌 **רמת כניסה**:
`entryLevel = 14.15`
* 📊 **תנאי כניסה**:
* סגירת מחיר **מעל 14.15**
* נפח מסחר **גבוה ב־20% מהממוצע ל־20 הימים האחרונים**
* 🔔 **התראה ויזואלית**:
* סמל ירוק "Entry" מופיע מתחת לנר על הגרף
* קווים קבועים לרמות יעד וסטופלוס
* 🎯 **יעדי רווח**:
* Target 1 – 15.15
* Target 2 – 16.00
* Target 3 – 17.00
* 🛑 **סטופלוס**:
* שמרני: 13.20
* אגרסיבי: 12.80
* 🔔 **התראה אוטומטית** (`alertcondition`):
תשלח הודעה:
*"PONY פרצה מעל 14.15 עם מחזור גבוה – שקול כניסה לעסקה."*
---
📝 מתאים עבור:
* סוחרי ניתוח טכני 🧮
* מי שמחפש כניסה מבוססת על פריצה + נפח 📊
* שימוש על גרף יומי בלבד 📅
---
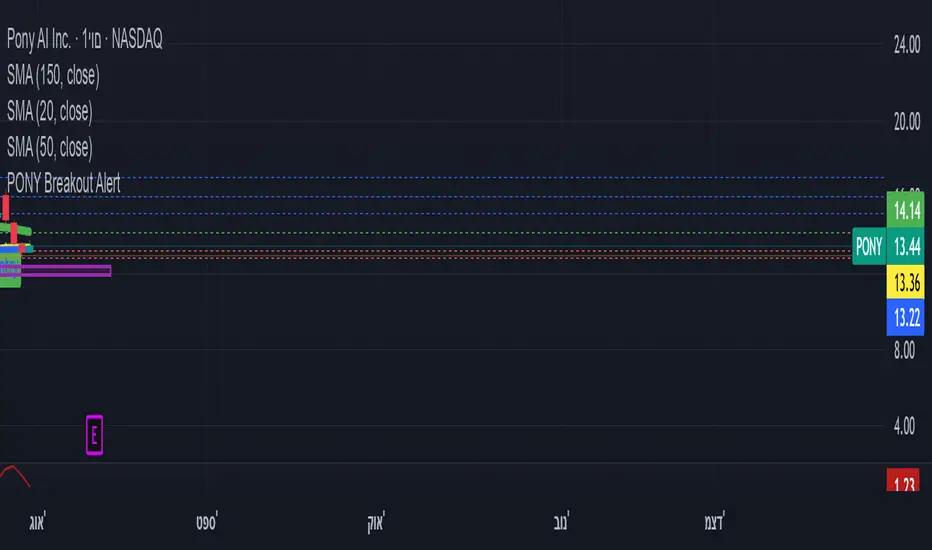
🧠 Script Summary: PONY Breakout Alert 📈
🔍 Objective:
Detect a breakout above the 14.15 level accompanied by high trading volume, in order to identify a bullish trading opportunity.
⚙️ Script Components:
📌 Entry Level:
entryLevel = 14.15
📊 Entry Conditions:
Price closes above 14.15
Volume is 20% higher than the 20-day average
🔔 Visual Alert:
A green "Entry" label appears below the bar on the chart
Static horizontal lines mark targets and stop-loss levels
🎯 Profit Targets:
Target 1 – 15.15
Target 2 – 16.00
Target 3 – 17.00
🛑 Stop Loss:
Conservative: 13.20
Aggressive: 12.80
🔔 Automated Alert (alertcondition):
Sends a message:
"PONY has broken above 14.15 with high volume – consider a long position."
📝 Ideal For:
Technical traders 🧮
Those seeking breakouts confirmed by volume 📊
Daily chart setups only 📅
ICT OTE Market MakerICT OTE Market Maker
Implementing ICT and automatically identifies OTE zones to minimize drawdowns.
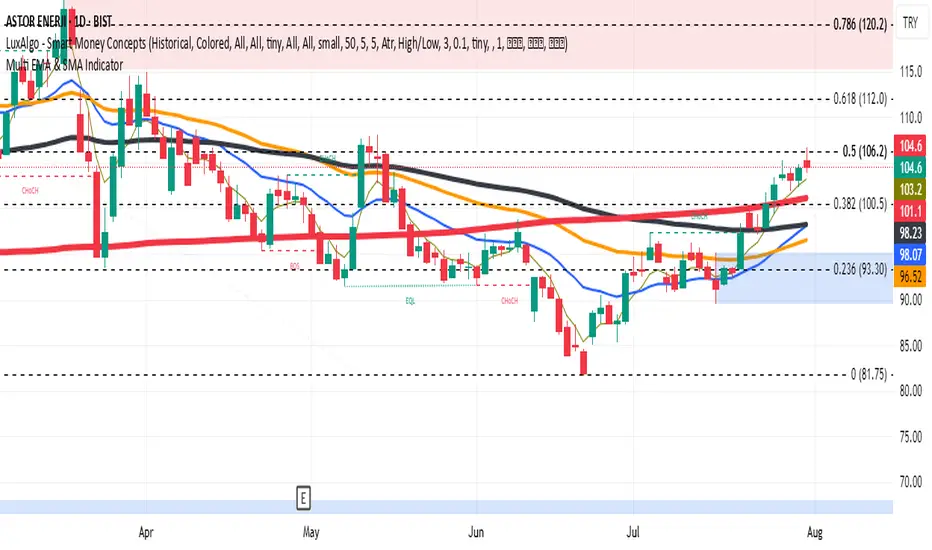
Multi EMA & SMA IndicatorDraws EMA 5/20/50/100 and SMA 200 in different colors and thickness in a single indicator
Trailing TP Bot • Crossover-based Trend Strategy using two simple moving averages (SMAs)
• Includes Take Profit and optional Trailing Take Profit
• Trades both long and short
• No pyramiding, i.e., one position at a time

X1 newbie code trying to create
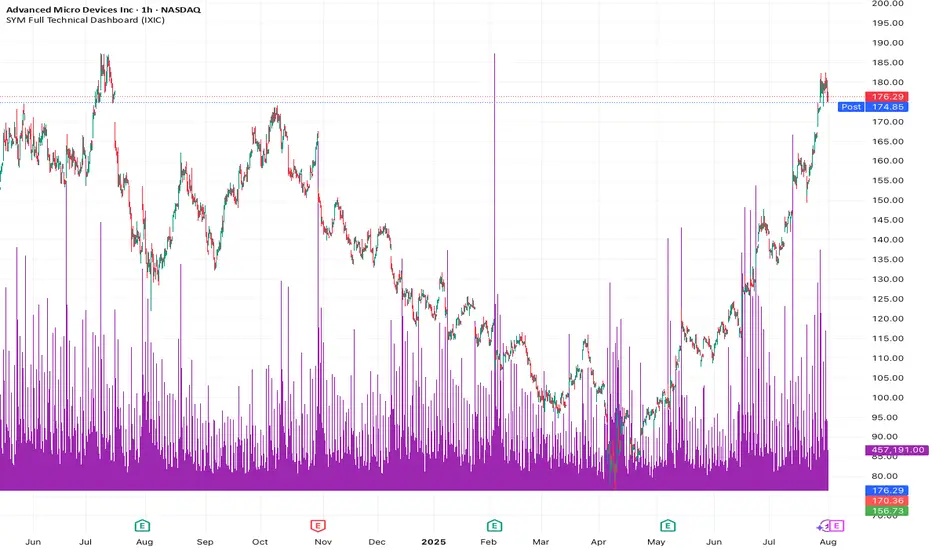
✅ Script Behavior on Other Stocks
• If you’re on a chart for SYM, it calculates indicators using SYM’s data.
• If you switch to NVDA, AVGO, CRDO, etc., it will automatically update to reflect that ticker’s:
• Price
• 50-day moving average
• Volume
• MACD
• RSI
• Index comparison
with 1. 📊 Volume shows in its own pane
2. ✅ MACD and RSI are included in separate panes (as promised)
3. 🎯 Script works cleanly with any ticker
Price Widget on ScreenSimple yet useful script, to see the PRICE/CHANGE of the chart you are on. I use it in my 6/8 charts screen, so you can see the graph and the price.

TFO + ADX with Histogram & SignalTrend Flow Oscillator (TFO + ADX) – Histogram + Signal
This version of the original TFO+ADX introduces a MACD-style histogram and signal line overlay for clearer momentum and trend visualization.
The Trend Flow Oscillator (TFO+ADX) blends two powerful volume-based tools — the Money Flow Index (MFI) and Chaikin Money Flow (CMF) — along with a normalized Average Directional Index (ADX). The result is a comprehensive momentum and trend strength tool that offers a more precise read on when markets are gaining or losing conviction.
⸻
How It Works
1.Money Flow Index (MFI)
• Measures volume-weighted buying/selling pressure using price and volume.
• Scaled between –1 and +1 for visual clarity.
2.Chaikin Money Flow (CMF)
• Evaluates volume distribution over time — institutional buying (accumulation) or selling (distribution).
• Also scaled between –1 and +1.
3.TFO Composite Line
• Combines MFI and CMF into a single flow reading.
• A signal line (EMA) tracks the trend of this flow.
• A histogram plots the difference between the TFO and its signal, giving clear signals on shifts in momentum.
4.Normalized ADX Overlay
• Shows trend strength on the same scale (–1 to +1).
• ADX > 0 indicates strong trending conditions.
• ADX < 0 signals weak or consolidating conditions.
⸻
Visual Interpretation
1. Histogram Bars
• Green: TFO is above the signal line → bullish momentum accelerating
• Red: TFO is below the signal line → bearish momentum building
• Bar height represents the strength of the momentum shift
2. Signal Line
• Tracks the smoothed trend of the TFO composite
• Histogram crossing above or below zero reflects momentum crossover and can act as entry or exit signals
3. TFO Raw Line (Optional)
• Still available for reference alongside the histogram
• Shows the unsmoothed blended money flow direction (MFI + CMF)
4. Extreme Zones
• Background shading appears when TFO exceeds ±1.0
• Helps highlight areas of stretched or unsustainable momentum, useful for spotting potential reversals or exhaustion
