Vol > 2×MA20Vol > 2×MA20 – שער-נפח לפריצות אמיתיות
הסקריפט מדגיש בר־דקה שבו נפח המסחר הנוכחי גדול פי 2 מהממוצע-נע של 20 נרות (SMA-20).
מטרתו לסנן “פריצות דקיקות” ולאמת שתנועה טכנית נתמכת בכסף אמיתי.
חישוב – trigger = volume > 2 * sma(volume, 20)
תצוגה –
עמודות נפח כחולות רגילות
קו אדום = 2 × SMA20 להצגת הסף
נקודת Alert (💠) כאשר התנאי מתקיים
AlertCondition – מובנה בשם “VolumeGate” (Once Per Bar Close מומלץ)
טיימפריים מומלץ – גרף 1-דקה או 5-דקות; מתאים גם ל-Higher TF אם משנים את המכפיל.
שימוש עיקרי – Day-Trading / סקאלפ: כניסה רק כשפריצה במחיר מלוּוָה בנפח כפול.
פרמטרים ניתנים לשינוי –
len (בר־אורך ממוצע; ברירת-מחדל = 20)
mult (מכפיל נפח; ברירת-מחדל = 2)
פשוט הוסף בקוד:
len = input.int(20, "Length")
mult = input.float(2.0, "Multiplier")
כתב-ויתור – הסקריפט מספק אינדיקציה כמותית בלבד ואינו המלצה לביצוע עסקה.
אשר נתוני Real-Time, חדשות וספרי פקודות לפני כל החלטה.
Vol > 2 × MA20 — Volume Gate for Genuine Breakouts
This script highlights any bar whose trading volume is at least twice the 20-bar simple moving average (SMA-20).
Its goal is to filter out “thin” price spikes and confirm that a breakout is backed by real buying power.
Logic – trigger = volume > 2 * sma(volume, 20)
Visuals
Regular volume columns in blue
Red line = 2 × SMA-20 (the threshold)
Diamond marker whenever the condition is met
AlertCondition – Built-in under the name “VolumeGate” (use Once Per Bar Close for best results)
Recommended time-frames – 1-minute or 5-minute charts; works on higher TFs if you adjust the multiplier.
Primary use-case – Day-trading / scalping: enter trades only when a price breakout is accompanied by at least double the average volume.
Customizable inputs
pinescript
Copy
Edit
len = input.int(20, "Length")
mult = input.float(2, "Multiplier")
Change them to suit different assets or market conditions.
Disclaimer – This script provides a quantitative signal only and is not financial advice. Always confirm with real-time data, news, and order-book depth before acting.
Ask ChatGPT
Price Volume Trend (PVT)

3MA Volume MTF Pro+📊 3MA Volume MTF Pro+ Indicator Documentation
🔬 Experimental Nature of the Indicator
The 3MA Volume MTF Pro+ is currently in an experimental/testing phase, designed to explore unconventional approaches to volume analysis. While it incorporates proven concepts like moving averages and volume profiling, its unique combination of multi-timeframe volume MAs, day-of-week levels, and trend-strength filters is still being refined.
🧪 Key Experimental Aspects:
1. Novel Volume-Based Signals
Unlike traditional price-based MAs, this indicator applies MA crossovers directly to volume data, which may produce unconventional but insightful momentum signals.
Hypothesis: Volume MA crossovers could precede price breakouts/reversals.
2. Day-of-Week Volume Anomalies
The "levels" system tests whether historical volume patterns (e.g., high Fridays, low Mondays) repeat predictably.
Caution: Market regimes change—backtest before relying on these patterns.
3. Trend Strength via Volume Deviation
The "strong/weak" trend filter uses volume vs. its moving average, not price. This is experimental but may help filter false breakouts.
⚠️ Disclaimer for Users:
Not a standalone strategy. Use alongside price action, support/resistance, or other confirmations.
Repainting risk: MAs recalculate on new bars—avoid very short timeframes (e.g., 1-minute charts).
Forward-test alerts in a demo account before live trading.
🌟 Overview
The 3MA Volume MTF Pro+ is a powerful volume-based indicator designed to analyze trends, detect volume anomalies, and identify recurring patterns across different timeframes. It combines three customizable moving averages (MAs) applied to volume data with day-of-week volume levels, trend strength visualization, and smart alerts.
🛠 Key Features & How It Works
📈 1. Multi-Timeframe Volume MAs
🔹 Three independent MAs (MA1, MA2, MA3) can be applied to volume data, each with:
8 MA types: EMA, SMA, RMA, WMA, SMMA, HMA, JMA, TMA.
Adjustable lengths (e.g., 20, 50, 100).
Multi-timeframe support (e.g., MA1 on 1H, MA2 on 4H).
🔹 Purpose: Identify volume trends (rising/falling) and crossovers for momentum signals.
📅 2. Day-of-Week Volume Levels
🔹 Calculates historical average volume for each day (Monday–Sunday) over a user-defined period (default: 2 weeks).
🔹 How to use:
Compare current volume to the day’s average level (dashed lines).
Spikes above/below suggest unusual activity (e.g., high Friday volume = potential breakout).
🎨 3. Trend Strength Filter
Strong Trend (Green): Volume ≥ 120% of its moving average.
Weak Trend (Red): Volume ≤ 80% of its moving average.
Purpose: Visually confirm trend strength alongside MA crossovers.
🔔 4. Alerts
MA Cross Alerts: Notify when MAs intersect (e.g., "MA1 crosses MA2").
Day-Level Alerts: Trigger when volume breaches the current day’s average level.
🚀 Practical Applications
✅ Trend Confirmation
Bullish Signal: MA1 > MA2 + Strong Volume (Green background).
Bearish Signal: MA3 > MA1 + Weak Volume (Red background).
✅ Intraday/Weekly Patterns
Example: If volume consistently peaks on Wednesdays, use levels as reversal/breakout points.
✅ Multi-Timeframe Analysis
Alignment Check: If hourly MA1 rises while daily MA2 flattens, short-term momentum may fade.
⚖️ Pros & Cons
✅ Advantages
Customizable: Tailor MAs to your strategy (e.g., JMA for responsiveness, TMA for smoothness).
Visual Clarity: Color-coded trends and dashed day-levels.
Actionable Alerts: Real-time notifications for crossovers/level breaks.
❌ Limitations
Lagging: Volume-based indicators react slower than price.
Overcrowding: Too many MAs/levels may clutter the chart (disable unused ones).
📜 Setup Guide
⚙️ Step 1: Configure MAs
MA1/2/3 Settings: Enable each MA, select type (e.g., TMA), length (e.g., 20), and timeframe (blank = current).
Example: MA1 = TMA-20 (1H), MA2 = JMA-50 (4H), MA3 = HMA-100 (1D).
📅 Step 2: Day-Level Settings
Show Levels: Toggle visibility.
Weeks to Display: Adjust historical lookback (e.g., 2 weeks).
🔔 Step 3: Alerts & Trend Filter
Alerts: Enable MA crosses/day-level breaches.
Trend Filter: Toggle background colors for strength/weakness.
🎨 Visual Examples
🌈 Color Legend
🔵 MA1 (Blue): Short-term volume trend.
🔴 MA2 (Red): Medium-term trend.
🟢 MA3 (Green): Long-term trend.
Dashed Lines: Day-of-week levels (e.g., purple = Monday, orange = Thursday).
📉 Sample Scenario
MA1 crosses MA2 upward + Green background = Strong uptrend confirmation.
Volume exceeds Friday’s level = Potential breakout alert.
💡 Pro Tips
Combine with Price Action: Use levels alongside support/resistance.
Adjust Timeframes: Match MAs to your trading style (scalping = 5M, swings = 1H).
Test Alerts: Ensure triggers align with your strategy.
❤️ Support This Project
If you find this indicator helpful and want to support future developments, donations are appreciated at:
USDT (TRC20): THFFLEZSpTqapYF6oj9rmuTCQVUXvuz7VS
Your generosity helps maintain and improve free indicators for the trading community!

Adaptive Trend Filter🔒 IAFL Adaptive Trend Filter – Smart Entry & Exit Tool for All Traders
Description:
This invite-only indicator is designed to offer precision-based trade entries and exits using adaptive trend logic. Rather than simply combining common tools, it integrates market strength and directional confirmation in a customized framework optimized for intraday, swing, and positional trading.
🎯 What Sets This Apart?
🔹 Dynamic Strategy Modes
Traders can toggle between three distinct behavioral modes based on their trading style—intraday, swing, or positional—each optimized to adjust internal decision thresholds, not just display values.
🔹 Filtered Entry System
Buy and Sell signals are only generated when multiple custom-defined trend conditions align, significantly reducing noise and false signals. This makes it particularly useful during volatile or consolidating markets.
🔹 Smart Risk Tools
Includes a built-in module to automatically generate Stop Loss and Take Profit levels using real-time market dynamics or predefined risk-reward rules. This helps users manage trades more consistently.
🔹 Trade Insight Panel
A non-intrusive on-chart panel gives users key details such as:
Latest signal
Stop loss & target levels
Current position status and live P/L
🔹 Non-Repainting Logic
Signals are confirmed and stable. There’s no repainting once a bar closes, ensuring that what users see is what actually happened.
🧠 How to Use It
Ideal for traders who want signal confirmation before acting
Suitable for equities, indices, crypto, or commodities
Can be combined with price action, volume, or multi-timeframe analysis
Works best on trending instruments with adequate volatility
This is a tool for discretionary trading, not an auto-entry system. It’s meant to complement a trader's strategy, not replace it.
❌ No Promotions or External Links
No website links
No contact info
No ads or offers
It is solely intended to provide value to serious traders who are looking for a thoughtful entry-filtering system.
🔐 Why Invite-Only?
This system is not just a mashup of public indicators. It involves:
Proprietary entry/exit logic
Dynamic threshold adjustments under the hood
User interface tools designed for better clarity and discipline
It’s invite-only to ensure that it's used responsibly and by users who understand how to integrate it into their process.

GCM Price Based ColorIndicator Name:
GCM Price Based Color Indicator
Detailed Description:
The GCM Price Based Color Indicator is a unique tool designed to help traders spot potential "pump" events in the market. Unlike traditional Volume Rate of Change (VROC) indicators, this script is conditional: it calculates a VROC value only when both the average volume and the price are increasing. This focus helps filter out volume surges that don't accompany immediate price appreciation, highlighting more relevant "pump" signals.
Key Features & Calculation Logic:
Conditional Volume Rate of Change (VROC):
It first calculates a Simple Moving Average (SMA) of the volume over a user-defined length (lookback period).
It then checks two conditions:
Is the current SMA volume greater than the previous bar's SMA volume (i.e., volumeIncreasing)?
Is the current close price greater than the previous bar's close price (i.e., valueIncreasing)?
Only if both volume Increasing AND value Increasing are true, a VROC value is calculated as (current _ MA _ volume - previous _ MA _ volume) * (100 / previous _ MA _ volume). Otherwise, the VROC for that bar is 0.
Historical Normalization:
The raw VROC value is then normalized against its own historical maximum value observed since the indicator was applied. This scaling brings all VROC values into a common 0-100 range.
Why is this important? Normalization makes the indicator's readings comparable across different assets (e.g., high-volume vs. low-volume stocks/cryptos) and different timeframes, making it easier to interpret the strength of a "pump" relative to its own past.
Dynamic Plot Color (Price-Based):
The plot line's color itself provides an immediate visual cue about the current bar's price action:
Green: close is greater than close (price is up for the current bar).
Red: close is less than close (price is down for the current bar).
Grey: close is equal to close (price is flat for the current bar).
Important Note: The plot color reflects the price movement of the current bar, not the magnitude of the VROC Normalized value itself. This means you can have a high vrocNormalized value (indicating a strong conditional volume surge) but a red plot color if the very next bar's price closes lower, providing a multi-faceted view.
Thresholds & Alerts:
Two horizontal lines (small Pump Threshold and big Pump Threshold) are plotted to visually mark significant levels of normalized pump strength.
Customizable alerts can be set up to notify you when VROC Normalized reaches or exceeds these thresholds, helping you catch potential pump events in real-time.
How to Use It:
Identify Potential Pumps: Look for upward spikes in the VROC Normalized line. Higher spikes indicate stronger pump signals (i.e., a larger increase in average volume coinciding with an increasing price).
Monitor Thresholds: Pay attention when the VROC Normalized line crosses above your small Pump Threshold or big Pump Threshold. These are configurable levels to suit different assets and trading styles.
Observe Plot Color: The line color provides crucial context. A high VROC Normalized (strong pump signal) with a green line indicates current price momentum is still positive. If VROC Normalized is high but the line turns red, it might suggest the initial pump is losing steam or experiencing a pullback.
Combine with Other Tools: This indicator is best used in conjunction with other technical analysis tools (e.g., support/resistance, trend lines, other momentum indicators) for confirmation and a more holistic trading strategy.
Indicator Inputs:
Lookback period (1 - 4999) (default: 420): This length determines the period for the Simple Moving Average (SMA) of volume. A higher value will smooth the volume average more, reacting slower, while a lower value will make it more reactive. Adjust based on the timeframe and asset volatility.
Big Pump Threshold (0.01 - 99.99) (default: 10.0): The normalized VROC Normalized level that signifies a "Big Pump." When VROC Normalized reaches or exceeds this level, an alert can be triggered.
Small Pump Threshold (0.01 - 99.99) (default: 0.5): The normalized VROC Normalized level that signifies a "Small Pump." This is a lower threshold for earlier or less significant pump activity.
Alerts:
Small Pump: Triggers when VROC Normalized crosses above or equals the small Pump Threshold.
Big Pump: Triggers when VROC Normalized crosses above or equals the big Pump Threshold.
Best Practices & Considerations:
Timeframes: The indicator can be used on various timeframes, but its effectiveness may vary. Experiment to find what works best for your chosen asset and trading style.
Volatility: Highly volatile assets might require different threshold settings compared to less volatile ones.
Lag: Due to the use of a Simple Moving Average (SMA) for volume, there will be some inherent lag in the calculation.
Normalization Start: The historic Max for normalization starts with a default value of 10.0. For the very first bars, or if there hasn't been a significant VROC yet, the VROC Normalized might behave differently until a true historical maximum VROC establishes itself.
Not Financial Advice: This indicator is a tool for analysis and does not constitute financial advice. Always perform your own research and manage your risk.

Overlay Candles with MultiplierCompare Price Movements Between Two Symbols Visually
This indicator overlays the price action of a secondary symbol on your current chart, allowing you to directly compare the relative movement of two instruments — for example, Gold (XAUUSD) and Silver (XAGUSD).
By applying a customizable multiplier to the overlayed symbol's price data, the indicator scales the second symbol to fit your chart, making it easier to visually identify correlations, divergences, or relative strength between the two assets.
You can choose between candle or line display styles for the overlay, and easily switch between two distinct color schemes for better clarity and personal preference.
Use Cases:
Compare precious metals like Gold and Silver side-by-side.
Visualize correlations between related forex pairs or indices.
Monitor relative price movement for pairs trading or spread strategies.

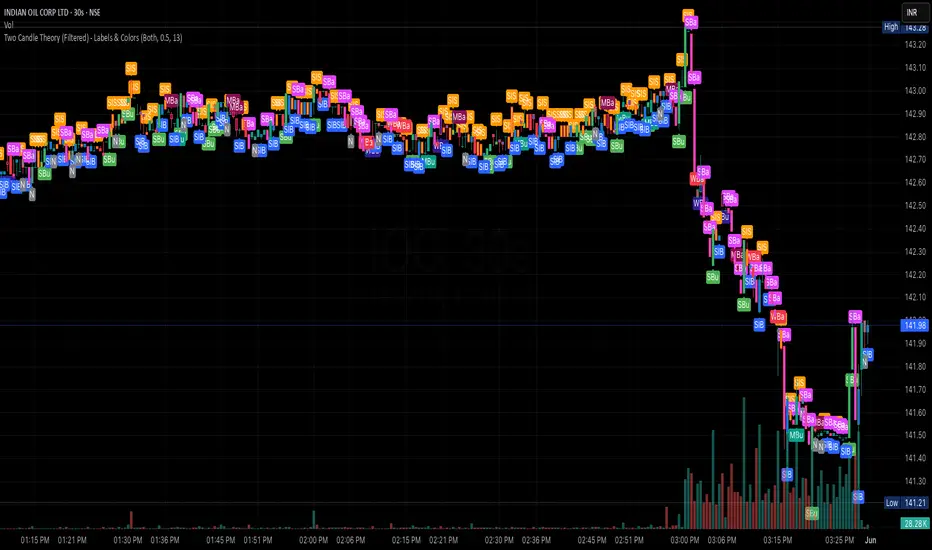
Two Candle Theory (Filtered) - Labels & ColorsOverview
This Pine Script classifies each candle into one of nine sentiment categories based on how the candle closes within its own range and in relation to the previous candle’s high and low. It optionally filters the strongest bullish and bearish signals based on volume spikes.
The script is designed to help traders visually interpret market sentiment through configurable labels and candle colors.
⸻
Classification Logic
Each candle is assessed using two metrics:
1. Close Position – where the candle closes within its own high-low range (High, Mid, Low).
2. Close Comparison – how the current close compares to the previous candle’s high and low (Bull, Bear, or Range).
Based on this, a short label is assigned:
• Bullish Bias: Strongest (SBu), Moderate (MBu), Weak (WBu), Slight (SlB)
• Neutral: Neutral (N)
• Bearish Bias: Slight (SlS), Weak (WBa), Moderate (MBa), Strongest (SBa)
⸻
Volume Filter
A volume spike filter can be applied to the strongest signals:
• SBu and SBa are only shown if volume is significantly higher than the average (SMA × threshold).
• The filter is optional and user-configurable.
⸻
Display Options
Users can control:
• Whether to show labels, bar colors, or both.
• Which of the nine label types are visible.
• Custom colors for each label and corresponding bar.
⸻
Visual Output
• Labels appear above or below candles depending on bullish or bearish classification.
• Bar colors reflect sentiment for quicker visual scanning.
⸻
Use Case
Ideal for identifying momentum shifts, validating trade entries, and highlighting candles that break out of previous ranges with conviction and/or volume.
⸻
Summary
This script simplifies price action by translating each candle into an interpretable sentiment label and color. With optional volume filtering and full display customization, it offers a practical tool for discretionary and systematic traders alike.
Volume & Price Analysis Across SessionsVolume & Price Analysis Across Sessions:
This advanced volume profile-based indicator provides a detailed visualization of market activity by analyzing volume distribution and price behavior across user-defined trading sessions. It dynamically calculates and displays the price level with the highest traded volume —for each user defined session, along with historical POCs, offering valuable insights into price acceptance zones and market sentiment over time.
Benefits:
Volume-Weighted Price Insights: Go beyond simple price action by integrating volume data to identify key levels where market participants are most active.
Multi-Session Context: Analyze volume concentration across multiple sessions to better anticipate support/resistance and potential reversal zones.
Visual Clarity: Intuitive color gradients and line widths make interpreting complex volume data straightforward.
Customizable to Fit Any Trading Style: Adjustable session length and sensitivity make it suitable for day trading, swing trading, or longer-term analysis.
This indicator is ideal for traders looking to integrate volume profile concepts directly on price charts with session-specific granularity, enabling deeper understanding of market structure and more informed trading decisions.
How It Works:
The indicator segments price and volume data into discrete sessions based on the selected timeframe.
Within each session, it bins volumes by price levels and identifies the POC — the price with the highest aggregated volume.
It draws the current session’s POC line on the chart, adjusting its thickness dynamically relative to volume strength using a z-score-based calculation.
Upon session completion, the POC line for that session is preserved on the chart in a gradient color reflecting relative volume magnitude compared to previous sessions.
Users can optionally enable deviation lines to observe volatility or price spread within each session.
The script efficiently manages historical POC lines, deleting the oldest when exceeding the maximum configured number to keep the chart clean.
Key Features:
Session-Based Volume Profile: Defines custom sessions based on a selectable timeframe (default 4 hours) and calculates volume bins within each session to identify where the most trading activity occurred.
Dynamic POC Line: Highlights the current session’s POC with a line whose width adapts based on volume intensity, controlled by a user-adjustable volume sensitivity parameter.
Historical POCs with Volume Gradient: Displays up to 30 previous session POC lines colored with a gradient ranging from low-volume (semi-transparent red) to high-volume (solid green), enabling quick visual identification of significant volume levels over time.
Standard Deviation Lines (Optional): Optionally plots ±1 standard deviation lines around the POC to visualize price dispersion within sessions.
Configurable Parameters: Allows full customization of appearance and sensitivity including POC line colors, maximum line widths, session timeframe, and the maximum number of price bins for volume aggregation.
Default Parameters Used:
Session Timeframe: 240 minutes (4-hour sessions)
POC Line Color: Yellow
Max Historical POCs Displayed : 30
Max POC Line Width: 10 pixels
Volume Sensitivity for POC Width: 2.0 (controls how volume deviations affect line thickness)
Show ±1 Std Dev Lines: Disabled by default
Deviation Line Color: Gray
Max Price Bins: 1000 (limits the number of unique price levels considered per session)
Historical POC Gradient Colors:
Low Volume Start: Red, 60% transparency
High Volume End: Solid Green

ADX and DI - Trader FelipeADX and DI - Trader Felipe
This indicator combines the Average Directional Index (ADX) and the Directional Indicators (DI+ and DI-) to help traders assess market trends and their strength. It is designed to provide a clear view of whether the market is in a trending phase (either bullish or bearish) and helps identify potential entry and exit points.
What is ADX and DI?
DI+ (Green Line):
DI+ measures the strength of upward (bullish) price movements. When DI+ is above DI-, it signals that the market is experiencing upward momentum.
DI- (Red Line):
DI- measures the strength of downward (bearish) price movements. When DI- is above DI+, it suggests that the market is in a bearish phase, with downward momentum.
ADX (Blue Line):
ADX quantifies the strength of the trend, irrespective of whether it is bullish or bearish. The higher the ADX, the stronger the trend:
ADX > 20: Indicates a trending market (either up or down).
ADX < 20: Indicates a weak or sideways market with no clear trend.
Threshold Line (Gray Line):
This horizontal line, typically set at 20, represents the threshold for identifying whether the market is trending or not. If ADX is above 20, the market is considered to be in a trend. If ADX is below 20, it suggests that the market is not trending and is likely in a consolidation phase.
Summary of How to Use the Indicator:
Trend Confirmation: Use ADX > 20 to confirm a trending market. If ADX is below 20, avoid trading.
Long Entry: Enter a long position when DI+ > DI- and ADX > 20.
Short Entry: Enter a short position when DI- > DI+ and ADX > 20.
Avoid Sideways Markets: Do not trade when ADX is below 20. Look for other strategies for consolidation phases.
Exit Strategy: Exit the trade if ADX starts to decline or if the DI lines cross in the opposite direction.
Combine with Other Indicators: Use additional indicators like RSI, moving averages, or support/resistance to filter and confirm signals.

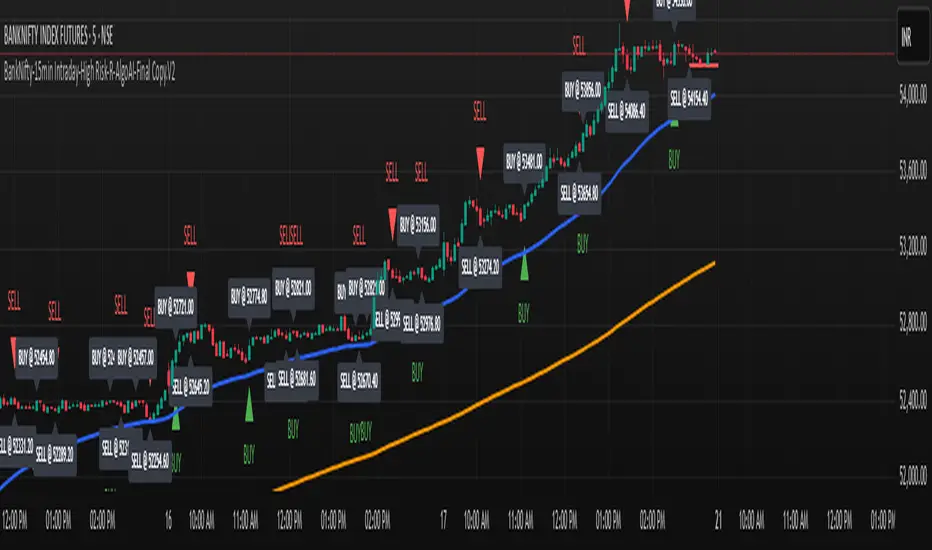
BankNifty-15min Intraday-High Risk-R-AlgoAI-Final Copy// This script is for educational and informational purposes only.
// It does not constitute financial or investment advice.
// Trading involves substantial risk and may not be suitable for all investors.
// Always do your own research or consult with a licensed financial advisor
// before making any trading or investment decisions.
// The author is not responsible for any losses incurred using this script.
⚡ Overview:
This script is a technical indicator designed for intraday trading on the Bank Nifty future chart using the 15-minute timeframe. It uses a combination of normalized buy and sell pressure along with a Hull Moving Average (HMA) smoothing method and volume-based normalization to detect potential buy and sell signals.
💡 Main Concept:
Buy and Sell Pressure Calculation:
The script calculates:
bp (Buy Pressure): close - low
sp (Sell Pressure): high - close
These values are smoothed using a custom Hull Moving Average (HMA) function, designed to reduce lag and react quicker to price changes compared to traditional moving averages.
📊 Normalized Signals:
Buy and Sell pressures are normalized against their HMA smoothed values.
Volume normalization is also applied to adjust for the effect of market activity on the pressure signals.
📌 Signal Logic:
A Buy Signal is generated when:
Only one signal per day is allowed to avoid signal spamming.
A Sell Signal is generated under the opposite conditions:
One sell signal per day.
🧾 Visual Output:
When a signal is triggered, the script:
Draws a horizontal line at the signal price (with labels like BUY @ or SELL @).
Plots triangle markers on the chart to highlight buy (green) or sell (red) signals.
Deletes or extends lines at the end of each day to maintain visual clarity.
📈 Additional Features:
EMA 50 & EMA 200:
Plots two common Exponential Moving Averages (50-period and 200-period) for trend visualization.
⚠️ Important Notes:
This script is meant for educational and research purposes only.
It is designed for high-risk intraday trading.
Signals are based on historical behavior and should not be treated as financial advice.
No stop-loss or take-profit logic is included — traders should manage risk independently.
✅ Summary:
This indicator offers a simple visual and quantitative approach to spot potential intraday turning points for Bank Nifty future on a 15-minute chart, with clear buy and sell markers. It combines volume, price pressure, and moving average smoothing to filter out random price movements.
FunkyQuokka's $ Volume💡 Why $ Volume Matters
Share volume alone is a half-truth — 1M shares traded at $5 isn’t the same as 1M shares at $500. That’s where dollar volume steps in, offering a far more accurate view of institutional interest, breakout validity, liquidity zones and overall trader conviction.
📈 Features:
Clean histogram of dollar volume (close × volume)
Orange line showing customizable average $ volume
K/M/B formatting for axis scale (no huge ugly numbers)
Minimal design to blend into a multi-pane layout
⚙️ Inputs:
Tweakable average length – defaults to 20
By FunkyQuokka 🦘

Multi-TF Volume & Price Analysis[BullByte]This indicator offers a comprehensive view of market dynamics by combining volume and price analysis across multiple timeframes. It calculates key metrics—such as bullish/bearish volume percentages, relative volume (RVol), cumulative volume delta (CVD), and price change percentages—for each timeframe that you choose (for example, 1, 3, 5, and 15 minutes). Here are the main features in simple terms:
- Multi-Timeframe Analysis:
The tool analyzes volume and price action from four different timeframes simultaneously. This means you get insights from short-term and slightly longer-term trends in one view.
- Volume Breakdown:
It splits the volume into bullish and bearish parts by comparing closing and opening prices. This helps you see how much of the trading volume is driving the market upward versus downward.
- Relative Volume & Spike Detection:
It calculates relative volume (current volume compared to a moving average) and flags any significant volume spikes based on a customizable multiplier. This feature helps identify unusual trading activity.
- Volume Smoothing Option:
For a cleaner signal, you can enable a smoothing option (using an exponential moving average) to reduce noise in the volume data.
- Advanced Summary:
The indicator combines volume data, price changes, and volume spikes to produce an overall market summary for each timeframe—labeling conditions as “Bullish Strong,” “Bullish Moderate,” “Bearish Strong,” “Bearish Moderate,” or “Neutral.”
- Cumulative Overview:
In addition to individual timeframe analysis, it aggregates the data to offer a cumulative view. This includes a collective bullish/bearish percentage, overall CVD, and even a simplified volume level (Low, Normal, or High).
- Customizable Dashboard:
All these metrics are neatly displayed in a dashboard on the chart. You can customize its position and text size. The dashboard uses dynamic, color-coded cells to instantly convey the market sentiment—making it easy to spot trends at a glance.
- VWAP Integration:
Finally, the dashboard includes VWAP information, providing an additional layer of context to the price action.
Overall, this indicator is designed to provide a quick yet thorough snapshot of market conditions, enabling traders to make more informed decisions with a clear visual representation of volume and price activity across different timeframes.

Volumen trend indicator 5MVOLUMEN TREND INDICATOR
Introduction
This indicator on TradingView provides a combination of technical analysis through a data table and visual elements on the chart. Its purpose is to provide a comprehensive view of the analyzed asset, facilitating decision-making.
How It Works
The indicator operates on two levels:
Data Table:
Displays key information about the asset's trend.
Includes metrics such as the current price, percentage change, volatility, and other relevant variables.
Can be customized to include additional indicators as needed.
Provides a quick analysis without the need to interpret complex charts.
Technical Elements on the Chart:
Incorporates dynamic support and resistance lines.
Can include moving averages, Bollinger Bands, RSI, or other custom indicators.
Offers visual alerts for significant changes in the asset's trend.
Facilitates detailed technical analysis through direct observation of patterns and signals.
Default Technical Indicators
The indicator comes with the following default pre-configured technical indicators:
Exponential Moving Average (EMA) 9:
This EMA responds more quickly to price movements, making it ideal for identifying short-term trends. It is generally used to detect crossovers with other EMAs or prices and is considered an entry or exit signal.
Exponential Moving Average (EMA) 21:
The 21-period EMA is used to identify medium-term trends. Its interaction with the 9 EMA is key to confirming buy or sell signals when both cross.
RSI (Relative Strength Index):
It is used to measure the magnitude of recent gains and losses of an asset, helping to identify overbought or oversold conditions.
Bollinger Bands:
These bands help identify volatility levels and potential reversal points. Price touching the upper or lower bands can be an important signal of trend change or continuation.
Customization
The user can modify several aspects of the indicator, such as:
Colors and styles of visual elements on the chart.
Types of indicators to include in the table.
Configuration of alerts and notifications.
Time interval for calculations and data updates.
EMA values (the periods can be changed if other configurations are desired).
Recommended Usage
To make the most of the indicator:
Use the data table to get an overview of the asset.
Analyze the technical elements on the chart to confirm trends.
Set alerts to avoid missing key opportunities.
Compare the information with other indicators and data sources before making decisions.
Precautions and Best Practices
Avoid relying solely on the indicator: Complement it with other technical and fundamental analysis.
Adjust the settings according to the asset's volatility: Not all strategies work the same across different markets.
Don’t overload the chart with too many elements: This can create visual noise and confusion in interpretation.
Test it on a demo account before trading live: To familiarize yourself with the indicator's functionality and adjustments.
----------------------------------------------
Remember that no system is perfect, keep these considerations in mind for this indicator:
Do not trade when a signal appears during an opposite trend:
Do not trade when the market is uncertain in its direction or within a parallel channel:

Borrow Fee & Squeeze TrackerSqueeze tracker.
This script helps identify potential short squeeze setups by detecting two key indicators: unusual volume and significant price changes.
The script combines both volume and price changes to give a more reliable indication of potential squeeze opportunities. When both criteria are met, it signals that there may be unusual market activity. The script also allows you to set up automatic alerts when both the volume and price change exceed thresholds, so you can react quickly to potential opportunities without constantly monitoring the charts.
Once added, you can set an alert:
Click on the Alert button
In the "Condition" dropdown, select the Squeeze Alert that was created.
Set the alert options
Now, when the script detects both a volume spike and a price change spike, it will trigger an alert based on your settings.
Enjoy!

Whale Activity Tracker Enhanced"Whale Activity Tracker Enhanced: Multi-Timeframe Adaptive Trading Signals"
Description:
The Whale Activity Tracker Enhanced (WAT+) is an innovative, multi-dimensional indicator designed to detect and visualize significant market moves likely driven by large players ("whales"). It combines volume analysis, price action, volatility, and momentum to provide traders with a comprehensive view of potential high-impact market events.
Key Features:
1. Adaptive Volume Spike Detection: Dynamically adjusts to market conditions, identifying unusual volume surges relative to recent activity.
2. Multi-Factor Confirmation: Combines volume spikes with price movements, RSI levels, and volatility measures for higher-probability signals.
3. Liquidity Grab Detection: Identifies potential stop-loss raids and liquidity sweeps through wick-to-body ratio analysis.
4. Customizable Signal Strength: Provides a visual representation of signal intensity, allowing traders to focus on the most significant events.
5. Flexible Timeframe Usage: Optimized settings for both scalp and swing trading, making it versatile across different trading styles.
How It Works:
- Volume Spike Analysis: Compares current volume to a user-defined multiple of the average volume.
- Price Move Threshold: Flags significant percentage price changes to filter out minor fluctuations.
- RSI Integration: Uses RSI to identify potential overbought/oversold conditions coinciding with other signals.
- Volatility Measurement: Incorporates ATR to detect periods of increased market volatility.
- Wick Analysis: Detects potential liquidity grabs by analyzing the ratio of candle wicks to bodies.
Originality:
Unlike standard volume or price action indicators, WAT+ synthesizes multiple market factors to provide a holistic view of potential whale activity. Its adaptive nature and customizable parameters allow it to work across various market conditions and trading styles.
Usage Guide:
1. Scalp Trading Setup:
- Use shorter lookback periods (12-15 bars) and tighter RSI levels (75/25).
- Focus on quick, high-probability trades triggered by volume spikes and price moves.
- Utilize the signal strength indicator for entry confirmation.
2. Swing Trading Setup:
- Extend lookback periods (20-30 bars) and use standard RSI levels (70/30).
- Look for sustained signals over multiple candles for trend confirmation.
- Combine with broader market trend analysis for higher-probability setups.
3. General Tips:
- Use the info panel to analyze the components of each signal.
- Adjust volume and price thresholds based on the specific asset's volatility.
- Combine with support/resistance levels for optimal entry and exit points.
By providing a multi-faceted approach to market analysis, the Whale Activity Tracker Enhanced empowers traders to identify and capitalize on significant market moves across various timeframes and trading styles.
Swing Trading Settings:
General Settings
Lookback Period: 20 to 30 bars. This provides a smoother signal and better context for swing trading.
Volume Spike Multiplier: 2.5 to 3.0. Higher thresholds ensure only significant volume spikes are considered.
Price Move % Threshold: 2.0 to 3.0%. Larger price move thresholds align with swing trading objectives.
RSI Period: 14 to 21. Longer periods smooth out short-term fluctuations.
RSI Overbought/Oversold Levels: 70/30. These levels work well for identifying potential reversals in swing trading.
Signal Detection
Enable Volume Spike Signal: True
Enable Price Move Signal: True
Enable Volatility Signal: True (important for identifying strong trends)
Enable Liquidity Grab Signal: True
Visualization
Show Volume Threshold Line: True
Show Signal Strength: True
Show Info Panel: True (useful for detailed analysis of swing setups)
Colors
Bullish Color: Green
Bearish Color: Red
Liquidity Color: Purple
Additional Parameters
ATR Period: 14 to 20. This helps identify volatility and set stop-loss levels.
Wick-to-Body Ratio: 2.0 or higher. This ensures only significant liquidity grabs are flagged.
Signal Strength Smoothing: 3 to 5 bars for steadier signals.
Scalp Trading:
General Settings
Lookback Period: 12 to 15 bars. This allows for a balance between responsiveness and noise reduction.
Volume Spike Multiplier: 2.0 to 2.2. This setting helps detect significant volume spikes without overreacting to minor fluctuations.
Price Move % Threshold: 1.0 to 1.2%. This captures substantial price movements suitable for scalp trading.
RSI Period: 7 to 9. Shorter periods provide quicker signals, ideal for scalp trading.
RSI Overbought/Oversold Levels: 75/25. Tighter levels help identify potential reversals sooner.
Signal Detection
Enable Volume Spike Signal: True
Enable Price Move Signal: True
Enable Volatility Signal: False (optional, depends on market conditions)
Enable Liquidity Grab Signal: True
Visualization
Show Volume Threshold Line: True
Show Signal Strength: True
Show Info Panel: False (optional, for cleaner charts)
Colors
Bullish Color: Green
Bearish Color: Red
Liquidity Color: Purple
Additional Tips
ATR Period: Keep it around 14 for volatility assessment.
Wick-to-Body Ratio: Adjust to 1.8 or higher for clearer liquidity grabs.
Signal Strength Smoothing: Use 2 to 3 bars for a responsive yet stable signal.

PVSRA Volume Suite with Volume DeltaPVSRA Volume Suite with Volume Delta
🔹 Overview
This indicator is a Volume Suite that enhances PVSRA (Price, Volume, Support, Resistance Analysis) by incorporating Volume Delta and AI-driven predictive alerts. It is designed to help traders analyze volume pressure, market trends, and price movements with color-coded visualizations.
📌 Key Features
PVSRA Volume Color Coding – Highlights vector candles based on extreme volume/spread conditions.
Volume Delta Analysis – Tracks buying/selling pressure using up/down volume data.
AI-Powered Predictive Alerts – Identifies potential trend shifts based on volume and trend context.
Volatility-Adjusted Thresholds – Dynamically adapts volume conditions based on ATR (Average True Range).
Customizable MA & Symbol Overrides – Allows traders to tweak settings for personalized market insights.
Debug & Diagnostic Labels – Shows statistical z-scores, thresholds, and volume dynamics.
How It Works
PVSRA Color Coding – The script classifies candles into four categories based on volume and spread analysis:
🔴 Red Vector → Extreme bearish volume/spread
🟢 Green Vector → Extreme bullish volume/spread
🟣 Violet Vector → Above-average bearish volume
🔵 Blue Vector → Above-average bullish volume
Volume Delta Calculation – Uses lower timeframe volume analysis to estimate up/down volume differentials.
Trend & Predictive Alerts – Combines EMA crossovers with statistical volume analysis to detect potential trend shifts.
Volatility Adaptation – Adjusts volume thresholds based on ATR, making signals more reliable in changing market conditions.
Custom Symbol Override – Fetches PVSRA data from a different instrument, useful for index-based volume analysis.
Customizable Inputs
PVSRA Color Settings – Modify candle color schemes for better visual clarity.
Volume Delta Colors – Customize delta volume body, wick, and border colors.
AI Settings – Tune z-score thresholds, lookback periods, and enable predictive alerts.
Symbol Overrides – Analyze volume from a different market or asset.
Moving Average (MA) Settings – Display a volume-based moving average for trend confirmation.
Important Notes
Works best on intraday timeframes where volume data is reliable.
Lower timeframe volume delta estimates might not be precise for all assets.
No guarantees of accuracy – Use alongside other confluence tools for decision-making.
Credits & Open-Source Notice
This script is based on PVSRA methodologies and integrates Volume Delta analysis. Special thanks to Traders Reality and TradingView for their contributions to volume-based analysis.

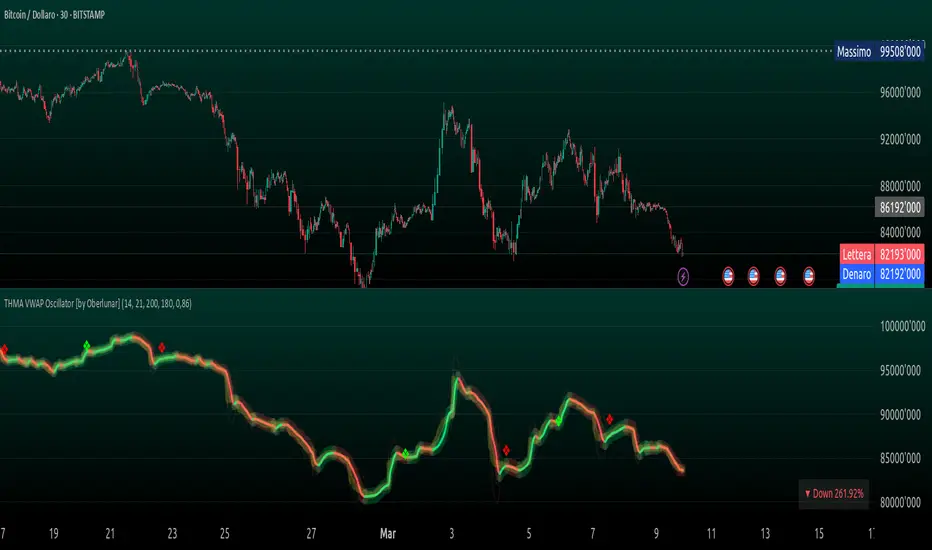
THMA VWAP Oscillator [by Oberlunar]The THMA VWAP Oscillator of Oberlunar is a trend-following and liquidity-sensitive indicator that blends the Triple Hull Moving Average (THMA) with Volume Weighted Average Price (VWAP) deviation bands to highlight high-probability trading setups. It helps traders differentiate between healthy momentum moves and market noise , making it an effective tool for spotting trend continuations, reversals, and mean reversion trades .
At its core, the THMA is an advanced moving average that smooths price action while minimizing lag. Unlike conventional moving averages that react slowly, the THMA dynamically adapts to market conditions by applying a weighted smoothing process. This allows it to react more efficiently to momentum shifts , making it ideal for trend-following and breakout strategies .
The VWAP acts as a volume-weighted price equilibrium, giving traders a framework for understanding institutional positioning. Since VWAP considers both price and volume , it helps determine whether the market is trading at a premium or a discount relative to where most of the volume has transacted. The inclusion of VWAP deviation bands , derived from standard deviations, enhances the ability to detect overbought and oversold conditions , ensuring that signals align with key liquidity levels.
The indicator generates buy and sell signals based on a structured methodology that incorporates trend direction, liquidity positioning, and momentum confirmation . A buy signal is triggered when the THMA on a higher timeframe is positioned below the THMA of the current timeframe, indicating that the broader trend is supportive of an upward move. Additionally, the THMA must be trading below the lower VWAP deviation band , suggesting that price is in a discounted liquidity zone, which is often an area where institutional buyers step in. To ensure that the signal is not just a random fluctuation, the THMA must also show positive slope , meaning it is actively rising, confirming that price is attempting to reverse or continue its upward move with strength.
A sell signal follows the same logic in reverse. The THMA on a higher timeframe must be above the THMA of the current timeframe, confirming alignment with a broader downtrend. The THMA must also be positioned above the upper VWAP deviation band , signaling that price is extended and potentially due for a reversal. To validate that the momentum is actually weakening, the THMA must be in a declining slope , ensuring that price is not simply pausing but actually entering a phase of downward acceleration.
One of the key nuances of the THMA VWAP Oscillator is how it visually represents momentum through the serpentine line , which dynamically shifts color as it develops. When the serpentine line maintains a consistent color—green in an uptrend or red in a downtrend—it signals strong trend conviction . However, when the color fluctuates rapidly between green and red, it indicates a weakening signal , suggesting that price action is becoming choppy and trend strength is deteriorating. This alternation in color serves as an early warning of potential reversals, false breakouts, or trend exhaustion. Traders should be cautious when signals appear in conjunction with an unstable serpentine, as they are less likely to be reliable in such conditions.
To further enhance signal quality, the indicator incorporates a signal alternation mechanism , ensuring that consecutive buy or sell signals do not appear unless the previous trade setup has been invalidated. This helps prevent overtrading in consolidating markets and reduces the chances of chasing false breakouts. Additionally, the placement of buy and sell labels is optimized using ATR-based scaling , positioning them strategically above or below price action to maintain chart clarity without interfering with live price movements.
By integrating trend structure, liquidity positioning, and signal validation , the THMA VWAP Oscillator provides a structured approach to trade execution. It is particularly effective for traders looking to capture breakout moves, pullback entries, and mean reversion opportunities , as it ensures that entries are aligned with market momentum, institutional positioning, and price equilibrium dynamics . The ability to filter out weak signals while identifying strong momentum trends makes it an indispensable tool for trend-followers, breakout traders, and mean reversion specialists alike .
I am very pleased to share that I am publicly releasing one of my private indicators, which I usually provide exclusively to my community. This is a significant moment for me, as this tool has been carefully refined and tested to offer high-quality trading insights.
I also want to take this opportunity to thank my entire community for the incredible support I have received over the past few months. Your feedback, engagement, and enthusiasm continue to inspire me, and I truly appreciate being part of this journey with all of you.
Stay tuned for more updates, and as always, trade smart! 🚀
Power Play Signal Indicator [Masky18]Power Play Signal Indicator
The Power Play Signal Indicator is a sophisticated custom trading strategy designed to identify high-probability breakout and breakdown opportunities by combining consolidation detection, trend alignment, volume analysis, and relative strength ranking. Unlike simple mashups of existing indicators, this script integrates multiple technical concepts into a cohesive strategy that helps traders capitalize on market momentum with precision.
What Makes This Indicator Unique?
The PowerPlay Signal Indicator is not just a combination of existing indicators; it is a custom-built strategy that uses original logic to filter out low-probability setups and focus on high-quality trading opportunities. Here’s how it works:
Consolidation Detection:
The script identifies consolidation zones by analyzing price action over a user-defined period (default: 6 bars). It calculates the high, low, and midpoint of the consolidation range and ensures the price stays within a specified percentage range (default: 13%).
Consolidations are classified as Tight, Loose, or Okay, helping traders gauge the strength of the potential breakout or breakdown.
Breakout & Breakdown Logic:
Breakouts and breakdowns are confirmed using a combination of:
Price Action: The script checks if the price closes above the consolidation high (breakout) or below the consolidation low (breakdown).
Volume Analysis: A significant volume spike (default: 20% increase) is required to confirm the move.
MACD & Moving Averages: The script uses MACD and moving averages (50-day and 200-day) to ensure the breakout/breakdown aligns with the prevailing trend.
Trend Alignment:
The script ensures trades are aligned with the long-term trend by using:
50-day SMA and 200-day SMA to confirm uptrends or downtrends.
150-day SMA as an additional filter to ensure the trend is strong.
52-week high/low conditions to ensure the price is in a favorable position relative to its historical range.
Relative Strength Ranking:
The script compares the asset’s performance against a benchmark asset (e.g., SPY) to ensure it is outperforming the market. This is done using a customizable Relative Strength (RS) Threshold (default: 70).
Golden Candle Signals:
For high-probability setups, the script identifies Golden Candles—strong breakout or breakdown candles with:
Large price movement (default: 7.5% to 12.5% candle size).
High volume (default: 2x the average consolidation volume).
Alignment with MACD and moving averages.
Risk Management:
The script provides stop loss, trailing stop, and take profit levels based on:
ATR (Average True Range): Dynamic stop loss levels are calculated using ATR (default: 14-period ATR with a 2x multiplier).
Trailing Stop Percentage: User-defined trailing stop (default: 2%).
Take Profit Percentage: User-defined take profit (default: 5%).
Performance Tracking:
The script includes a Performance Table that tracks:
Total breakouts and breakdowns.
Successful and failed trades.
Win rates for breakouts and breakdowns.
Golden candle signals.
How Does It Work?
The PowerPlay Signal Indicator combines the following key components to generate signals:
Consolidation Detection:
The script calculates the high, low, and midpoint of the consolidation range over a user-defined period.
It ensures the price stays within a specified percentage range (default: 13%) to confirm consolidation.
Breakout/Breakdown Confirmation:
A breakout is confirmed when:
The price closes above the consolidation high.
Volume increases by at least 20%.
MACD is positive and above the signal line.
The price is above the 50-day and 200-day SMAs.
A breakdown is confirmed when:
The price closes below the consolidation low.
Volume increases by at least 20%.
MACD is negative and below the signal line.
The price is below the 50-day and 200-day SMAs.
Golden Candle Signals:
Golden Candles are identified when:
The candle size is between 7.5% and 12.5%.
Volume is at least 2x the average consolidation volume.
The candle aligns with the prevailing trend and MACD.
Risk Management:
Stop loss levels are calculated using ATR (default: 14-period ATR with a 2x multiplier).
Trailing stop and take profit levels are based on user-defined percentages.
How to Use the Indicator
Input Parameters:
Consolidation Periods: Set the number of bars to analyze for consolidation (default: 6).
Maximum Consolidation Range: Define the maximum percentage range for consolidation (default: 13%).
Stop Loss Factor: Adjust the stop loss multiplier based on the midpoint of the consolidation range (default: 0.985).
RS Threshold: Set the relative strength threshold for trend alignment (default: 70).
Comparison Asset: Enable comparison with a benchmark asset (e.g., SPY) to ensure the asset is outperforming the market.
Trailing Stop Percentage: Set the trailing stop percentage (default: 2%).
Take Profit Percentage: Set the take profit percentage (default: 5%).
Time Exit Bars: Define the maximum number of bars to hold a trade (default: 10).
Interpreting Signals:
Breakout Signal: A green label ("BO") appears when a breakout is detected.
Breakdown Signal: A red label ("BD") appears when a breakdown is detected.
Golden Candle Signal: A gold medal icon (🥇) appears for high-probability setups.
Performance Table:
The performance table displays the number of trades, successful trades, failed trades, and win rates for breakouts and breakdowns.
Alerts:
Enable alerts for breakouts, breakdowns, and golden candles to stay informed about potential trading opportunities.
Why Choose the PowerPlay Signal Indicator?
Original Logic: Combines consolidation detection, trend alignment, volume analysis, and relative strength ranking into a unique strategy.
High-Probability Signals: Focuses on high-quality setups with strong volume and trend alignment.
Risk Management: Built-in stop loss, trailing stop, and take profit options help you manage risk effectively.
Performance Tracking: Tracks trade outcomes and win rates to help you refine your strategy.
Customizable: Fully adjustable inputs allow you to adapt the indicator to your trading style and market conditions.

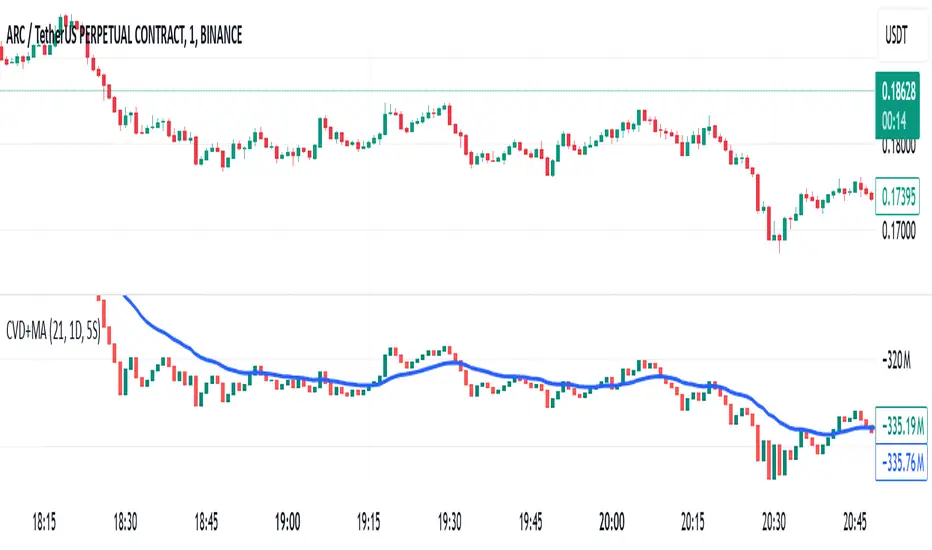
Cumulative Volume Delta with MACVD is a volume-based indicator that helps analyze buying and selling pressure in the market. It tracks the difference between buying volume and selling volume, showing whether the market is being accumulated or distributed.
How CVD Works
Volume Delta Calculation:
If price closes higher than the previous bar → Volume is added to CVD (buying pressure).
If price closes lower than the previous bar → Volume is subtracted from CVD (selling pressure).
CVD Cumulative Calculation:
Keeps a running total of volume delta over time.
If the CVD line is rising, buyers are in control; if falling, sellers dominate.
Moving Average on CVD:
A moving average (MA) smooths out the CVD line, helping identify trends more clearly.
Common choices: EMA (Exponential MA) or SMA (Simple MA).
Draw on Liquidity [PhenLabs]📊 Draw on Liquidity (DOL) Indicator
Version: PineScript™ v6
Description
The Draw on Liquidity (DOL) indicator is an advanced technical analysis tool designed to identify and visualize significant liquidity zones in the market. It combines volume analysis, pivot point detection, and real-time proximity alerts to help traders identify potential support and resistance levels where significant trading activity occurs. The indicator features dual display modes, adaptive volume thresholds, and a comprehensive real-time dashboard.
🔧 Components
• Liquidity Detection: Advanced pivot point analysis with volume validation
• Volume Analysis: Adaptive volume threshold system
• Display Modes: Historical and Current visualization options
• Proximity Detection: Real-time price-to-level distance monitoring
• Visual Dashboard: Dynamic status display with alert system
🚨 Important Dashboard Features 🚨
The dashboard provides real-time information about:
• High Draw Zones: Resistance levels with significant liquidity
• Low Draw Zones: Support levels with high trading activity
• Current Price: Real-time price monitoring
• Active Alerts: Proximity warnings when price approaches liquidity zones
📈 Visualization
• Historical Mode: Displays all past and present liquidity zones
• Current Mode: Shows only active, unhit liquidity levels
• Color-coded lines: Blue for high liquidity, Red for low liquidity
• Dynamic line extension: Updates with price movement
• Alert indicators: Visual signals when price approaches zones
Historical Visualization
Current Visualization
📌 Usage Guidelines
The indicator is highly customizable with several key parameters:
Pivot Settings:
• Shorter lengths (3-7): More frequent zones, suitable for scalping
• Longer lengths (7-15): Major zones, better for swing trading
Volume Analysis:
• Lower multiplier (1.5-2.0): More zones, higher sensitivity
• Higher multiplier (2.0-3.0): Major zones only, reduced noise
✅ Best Practices:
• Start with default settings and adjust based on timeframe
• Use Historical mode for analysis, Current mode for active trading
• Monitor dashboard alerts for potential trade setups
• Combine with trend analysis for better entry/exit points
⚠️ Limitations
• Requires sufficient volume data for accurate analysis
• Performance varies with market volatility
• Historical mode may become visually cluttered on longer timeframes
• Best performance during regular market hours
What Makes This Unique
• Dual Display System: Choose between historical analysis and current trading modes
• Volume-Validated Zones: Only marks levels with significant trading activity
• Real-time Proximity Alerts: Dynamic warnings when approaching liquidity zones
• Adaptive Threshold System: Automatically adjusts to market conditions
• Comprehensive Dashboard: All-in-one view of current market status
🔧 How It Works
The indicator processes market data through three main components:
1. Liquidity Detection (40% weight):
• Identifies pivot points using customizable lookback periods
• Validates levels with volume analysis
• Marks significant zones based on combined criteria
2. Volume Analysis (40% weight):
• Calculates dynamic volume thresholds
• Compares current volume to moving average
• Filters out low-volume noise
3. Proximity Analysis (20% weight):
• Monitors price distance to active zones
• Triggers alerts based on customizable thresholds
• Updates dashboard status in real-time
💡 Note: For optimal results, combine with price action analysis and consider using multiple timeframes for confirmation. The indicator performs best in markets with consistent volume and clear trend structure.

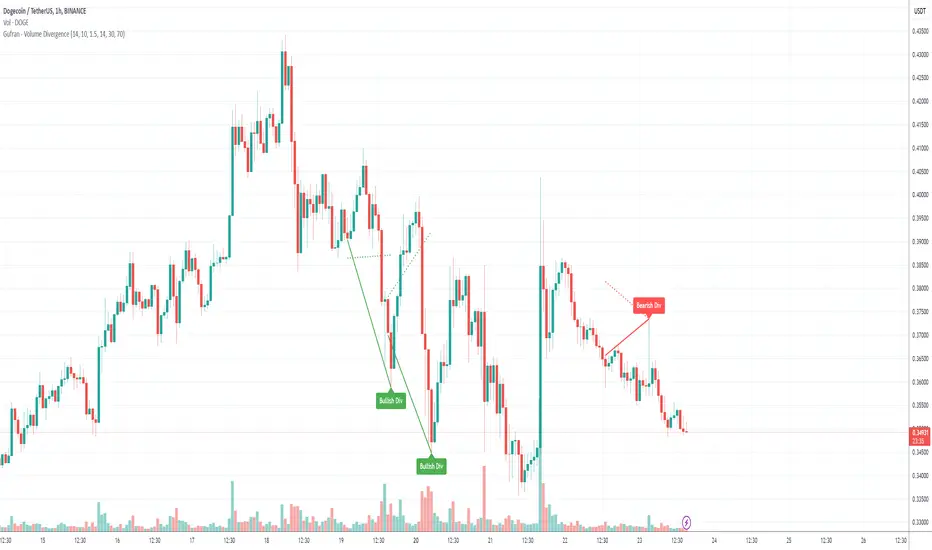
Gufran - Volume DivergenceThis indicator detects bullish and bearish divergences by analyzing price action, volume trends, and RSI (Relative Strength Index) for added confirmation. It highlights key market reversals or trend continuations by identifying when price movement diverges from volume dynamics, providing traders with actionable insights for entry and exit points.
Key Features:
Divergence Detection:
Bullish Divergence: Price makes a lower low, but volume shows higher lows, signaling potential upward reversals.
Bearish Divergence: Price makes a higher high, but volume shows lower highs, signaling potential downward reversals.
RSI Confirmation:
Bullish Signals: Confirmed when RSI is in the oversold zone.
Bearish Signals: Confirmed when RSI is in the overbought zone (optional relaxation of RSI conditions available).
Normalized Volume Analysis:
Volume is scaled to the price range, ensuring clear and meaningful visualization alongside price action.
Customizable Parameters:
Lookback Period: Define how far back the script looks to identify divergences.
Volume Significance: Adjust the threshold for significant volume movements.
RSI Levels: Fine-tune overbought and oversold thresholds for optimal signal accuracy.
Gap Control: Avoid clutter by setting a minimum number of candles between successive divergence signals.
Clear Visual Representation:
Bullish Divergence: Marked with green labels and connecting lines.
Bearish Divergence: Marked with red labels and connecting lines.
Dotted lines show normalized volume divergence, while solid lines indicate price divergence.
Ideal For:
Traders who rely on volume dynamics to validate price movements.
Those looking for an added layer of confidence using RSI to filter false signals.
Swing and intraday traders aiming to identify market reversal zones or continuation patterns.
Customization Options:
Lookback Period: Adjustable range for detecting highs and lows.
Volume Threshold: Define the multiplier for significant volume changes.
RSI Settings: Tailor overbought/oversold levels to suit your trading style.
Relax RSI Condition: Toggle stricter or more flexible conditions for bearish divergences.
How to Use:
Add the indicator to your chart and configure the parameters to fit the asset and timeframe you are trading.
Look for:
Green “Bullish Div” labels near price lows for potential buying opportunities.
Red “Bearish Div” labels near price highs for potential selling opportunities.
Use this indicator in combination with other tools like support/resistance levels, trendlines, or moving averages for a comprehensive trading strategy.
Disclaimer:
This indicator is a tool for educational purposes and should not be used as a standalone trading signal. Always conduct proper risk management and consider additional technical/fundamental analysis before making trading decisions.
Red Pill VWAP/RSI DivergenceI created this indicator to identify moments in time VWAP and RSI are diverging.
Ideally useful in strong trend, bullish or bearish, as a potential entry point on a pull back for continuation. Not to be used as a stand alone signal, but rather in conjunction with any possible trend/momentum strategy.
VWAP is identified as the blue line. Green label(blue pill) is your potential entry on a pull back when price is above, stacked EMAS & VWAP for a long position. Red label(red pill) is your potential entry on a pull back when price is below inversely stacked EMAS & VWAP for a short position. These are the 2 ideal scenarios I have found. Please back test for yourself
I have had great results but must emphasis this is not a stand alone buy/sell. I use it in confluence to add conviction to my current A+ setups.
***Pivot ribbon in chart created by Saty Mahajan set to 3/10 time warp works ideal in conjunction.
***please note false positive and false negative signals can occur, particularly in chop
I hope you find this helpful . TRADE SAFE!
X.Y Format Candle Volume & CompressionThe Volume & Compression Indicator is designed to help traders identify significant market moves by displaying two key metrics above each candle. The top number represents the Volume Ratio, which compares the current candle's volume to the average volume of recent candles. For example, a reading of 2.5 means the current volume is 2.5 times higher than average. When volume exceeds 9.9 times the average, the indicator displays an up or down arrow instead of a number, indicating extremely high volume in that direction.
The bottom number shows the Compression Ratio, which measures the relationship between volume and price movement. This helps identify when large amounts of volume are moving price significantly (low compression) versus when high volume isn't resulting in much price movement (high compression). High compression often indicates accumulation or distribution phases, while low compression with high volume typically suggests strong directional moves.
The indicator includes visual cues to help spot patterns. Dots appear above candles when both high volume and high compression persist over several candles, potentially indicating accumulation phases. Arrows mark possible pivot points after these accumulation periods. Additionally, the candles themselves can display a gradient color that intensifies with increased compression, making it easier to spot areas of interest.
For trading purposes, watch for volume spikes (top number above 2.0) as they can signal potential reversal points or confirm breakouts. High compression readings might precede breakouts, while low compression with high volume often confirms strong trend moves. The most significant signals often come when both metrics show high readings over multiple candles, suggesting sustained institutional interest.
Twiggs Money FlowTwiggs Money Flow (TMF)
This indicator is an implementation of the Twiggs Money Flow (TMF), a volume-based tool designed to measure buying and selling pressure over a specified period. TMF is an enhancement of Chaikin Money Flow (CMF), utilizing more sophisticated smoothing techniques for improved accuracy and reduced noise. This version is highly customizable and includes advanced features for both new and experienced traders.
What is Twiggs Money Flow?
Twiggs Money Flow was developed by Colin Twiggs to provide a clearer picture of market momentum and the balance between buyers and sellers. It uses a combination of price action, trading volume, and range calculations to assess whether a market is under buying or selling pressure.
Unlike traditional volume indicators, TMF incorporates Weighted Moving Averages (WMA) by default but allows for other moving average types (SMA, EMA, VWMA) for added flexibility. This makes it adaptable to various trading styles and market conditions.
Features of This Script:
Customizable Moving Average Types:
Select from SMA , EMA , WMA , or VWMA to smooth volume and price-based calculations.
Tailor the indicator to align with your trading strategy or the asset's behavior.
Optional HMA Smoothing:
Apply Hull Moving Average (HMA) smoothing for a cleaner, faster-reacting TMF line.
Perfect for traders who want to reduce lag and capture trends earlier.
Dynamic Thresholds for Signal Filtering:
Set user-defined thresholds for Long (LT) and Short (ST) signals to highlight significant momentum.
Focus on actionable trends by ignoring noise around neutral levels.
Bar Coloring for Visual Clarity:
Automatically colors your chart bars based on TMF values:
Aqua for strong bullish signals (above the long threshold).
Fuchsia for strong bearish signals (below the short threshold).
Gray for neutral or undecided market conditions.
Ensures that trend direction and strength are visually intuitive.
Configurable Lookback Period:
Adjust the sensitivity of TMF by customizing the length of the lookback period to suit different timeframes and market conditions.
How It Works:
True Range Calculation: The script determines the high, low, and close range to calculate buying and selling pressure.
Adjusted Volume: Incorporates the relationship between price and volume to gauge whether trading activity is favoring buyers or sellers.
Weighted Moving Averages (WMAs): Smooths both volume and adjusted volume values to eliminate erratic fluctuations.
TMF Line: Computes the ratio of adjusted volume to total volume, representing the net buying/selling pressure as a percentage.
HMA Option (if enabled): Smooths the TMF line further to reduce lag and enhance trend identification.
Bar Coloring Logic:
Bars are colored dynamically based on TMF values, thresholds, and smoothing preferences.
Provides an at-a-glance understanding of market conditions.
Input Parameters:
Lookback Period: Defines the number of bars used to calculate TMF (default: 21).
Use HMA Smoothing: Toggle Hull Moving Average smoothing (default: true).
HMA Smoothing Length: Length of the HMA smoothing period (default: 14).
Moving Average Type: Select SMA, EMA, WMA, or VWMA (default: WMA).
Long Threshold (LT): Threshold value above which a long signal is considered (default: 0).
Short Threshold (ST): Threshold value below which a short signal is considered (default: 0).
How to Use It:
Confirm Trends: TMF can validate trends by identifying periods of sustained buying or selling pressure.
Divergence Signals: Watch for divergences between price and TMF to anticipate potential reversals.
Filter Trades: Use the thresholds to ignore weak signals and focus on strong trends.
Combine with Other Indicators: Pair TMF with trend-following or momentum indicators (e.g., RSI, Bollinger Bands) for a comprehensive trading strategy.
Example Use Cases:
Spotting breakouts when TMF crosses above the long threshold.
Identifying sell-offs when TMF dips below the short threshold.
Avoiding sideways markets by ignoring neutral (gray) bars.
Notes:
This indicator is highly customizable, making it versatile across different assets (e.g., stocks, crypto, forex).
While the default settings are robust, tweaking the lookback period, moving average type, and thresholds is recommended for different trading instruments or strategies.
Always backtest thoroughly before applying the indicator to live trading.
This version of Twiggs Money Flow goes beyond standard implementations by offering advanced smoothing, custom thresholds, and enhanced visual feedback to give traders a competitive edge.
Add it to your charts and experience the power of volume-driven analysis!
