Accumulation/Distribution VolumeThis is a simple yet powerful indicator that can replace volume, Money Flow, Chaikin Money Flow, Price Volume Trend (PVT), Accumulation/Distribution Line (ADL), On Balance Volume (OBV).
When "Baseline Chart" option is disabled, it looks similar to regular volume. The volume bars has two shades of green and red. The dark shade shows amount of accumulation and the light shade shows total volume (what you see on a regular volume indicator). Blue line is the moving average (or cumulative total) of A/D and the gray line is for total volume.
When money volume is enabled, volume it multiplied by price. As you can see in the chart below, trade volume in terms of USD was declining after ATH. This is not the case in regular volume chart which shows instrument volume (chart above).
In Baseline view, the aggregation method you choose can turn it into different indicators. With EMA/SMA aggregation, blue and gray line shows buy/sell pressure. At 0, there is not buy or sell pressure.
If you turn off volume bars (from style menu), it gives you a reliable indicator to measure divergence. This should be more reliable than most other range-bound indicators (i.e. RSI, MFI, CMF). I will publish a TA about correctly measuring divergence (it's a must read even if you are a pro trader). Make sure that the length is set to a large number on smaller TFs such as 4h.
For following results, set aggregation to cumulative and turn off money volume:
When wick weight=0, the GRAY line is identical to OBV indicator.
When normalized by spread and wick weight=10, the BLUE line is identical to ADL (improved by true range).
When normalized by previous bar price, wick weight=0, the BLUE line is identical to PVT.
How I use this indicator:
- Baseline chart, replaced my regular volume indicator
- Mostly 4h TF for divergence
- EMA aggregation (and occasional cumulative aggregation) with length above 50. I change the length to 100 and 200 for confirmation.
- Wick weight=0 or max 2.
With this indicator, you can learn how different indicators are built and how they are different from each other. I will publish a TA to explain more about different indicators and their pros and cons.
I will publish this indicator without volume bars and additional options to make it range bound.
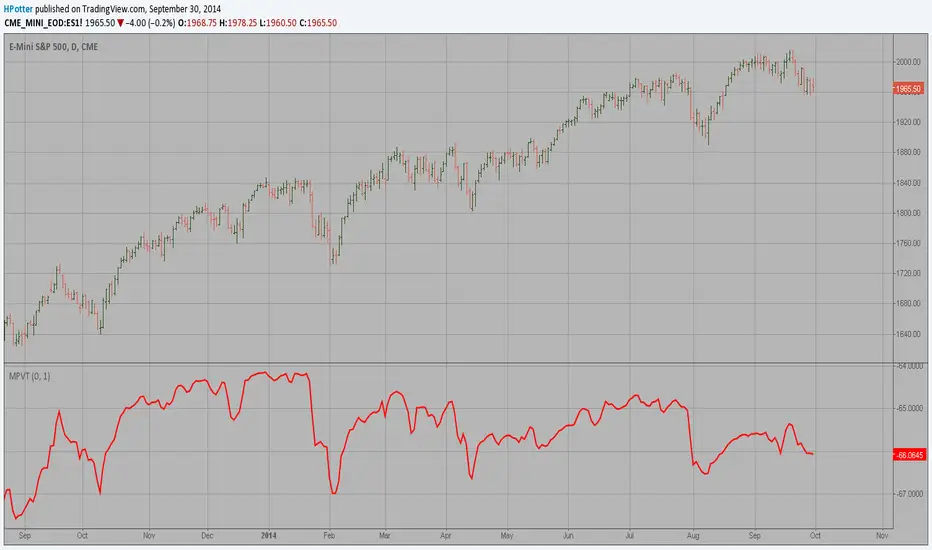
Price Volume Trend (PVT)

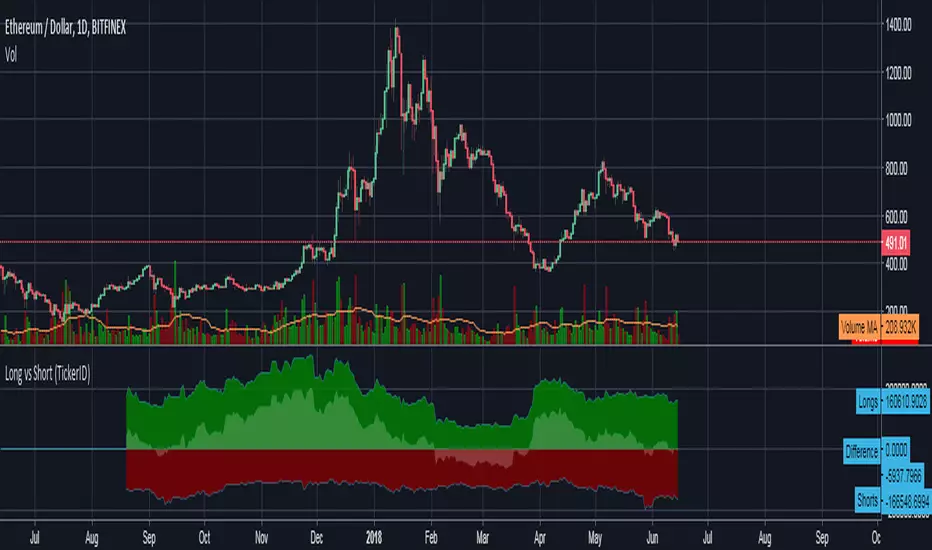
Bitfinex Long vs Short (TickerID)Uses the active ticker to show long/short values on all Bitfinex pairs that have that data available on Tradingview.
Volume Strength Candles / Colored BarsIs Price Action Higher or Lower on STRONG or WEAK VOLUME from lookback
(Strong or Weak Bulls // Strong or Weak Bears)
Candles / Bars Indicate the Following (default 13 period lookback / Length)
MAROON Bear Candle with STRONG VOLUME more than 150% of the lookback / length (13 default), STRONG Bear Candle Confirmed With Volume
RED Bear Candle while VOLUME is BETWEEN 50% & 150% of the Lookback / Length (13 default), Neutral Bear Volume Neither strong or weak
ORANGE Bear Candle with WEAK VOLUME (Less than 50% of the Length / Lookback)
DARK GREEN Bull Candle with STRONG VOLUME MORE than 150% of lookback
GREEN Bull Candle with Neutral VOLUME BETWEEN 50% & 150% of the lookback / Length
AQUA Bull Candle with WEAK VOLUME less than 50% of the Lookback
Is price confirmed by volume?
Can Change the Lookback / Length from 13
Can Change the Colors and Transparency to easily see based off your chart background colors I recommend ZERO Transparency to easily identify volume strength (i use white background but many use black or other)

Volume Indicator VSidea take from Alexander Elder, author of: The New Trading for a Living: Psychology, Discipline, Trading Tools and Systems, Risk Control, Trade Management
Meaning of colouring:
- Green bar Volume: If we look back certain numbers of volume bars, higher close price and higher volume.
- Blue bar Volume: If we look back certain numbers of volume bars, higher close price and lower volume.
- Red bar Volume: If we look back certain numbers of volume bars, lower close price and higher volume.
- Orange bar Volume: If we look back certain numbers of volume bars, lower close prince and lower volume.
- Grey bar Volume: If we look back certain numbers of volume bars, same price and same volume.

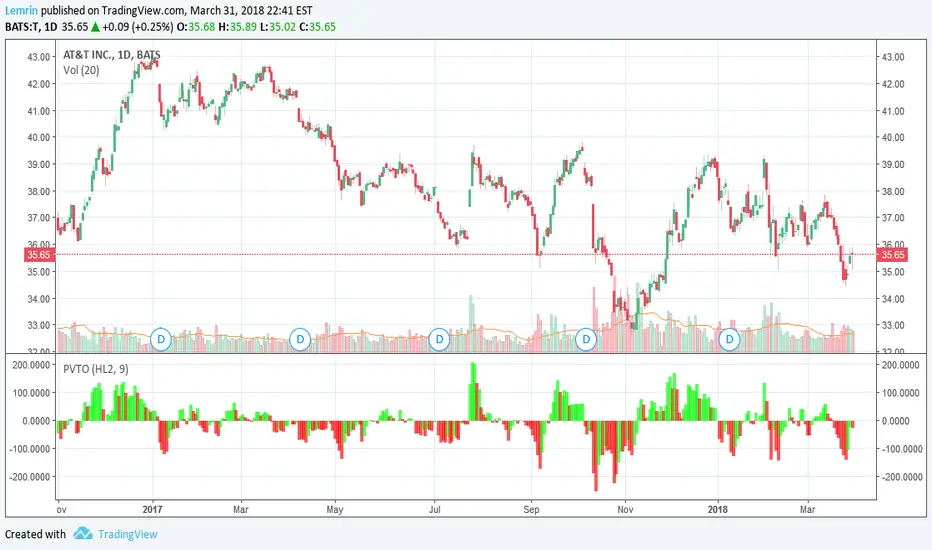
PVT OscillatorThis is the non-accumulating portion of the price-volume trend (PVT)--the amount by which PVT would change each bar--which I have turned into a zero-centered oscillator. The plot is a 9-day EMA of the PVT change, multiplied by 1000 for readability, with lime/red corresponding to whether the actual PVT increased or decreased for that bar.
As always, the length of this moving average is adjustable, as is the source of price(s) to use--open, close, high, low, HL2, HLC3, or OHLC4.
Volume RSIThis is a script about the RSI for the Volume Trend, with this indicator we can help us to watch the force of a volume trend (not price). Some times this can help us to clarify the change of the direction.
This is a continuation of the:
Volume Spread Graph
Volume CCI
Volume Trend Oscillator
ideas, comments and suggestions (or corrections).They are always welcome


Klinger Volume Price Trend combo (page2)I forgot to mention
Sorry,
Thanks to Vdub for the great idea of coding in nadex volume
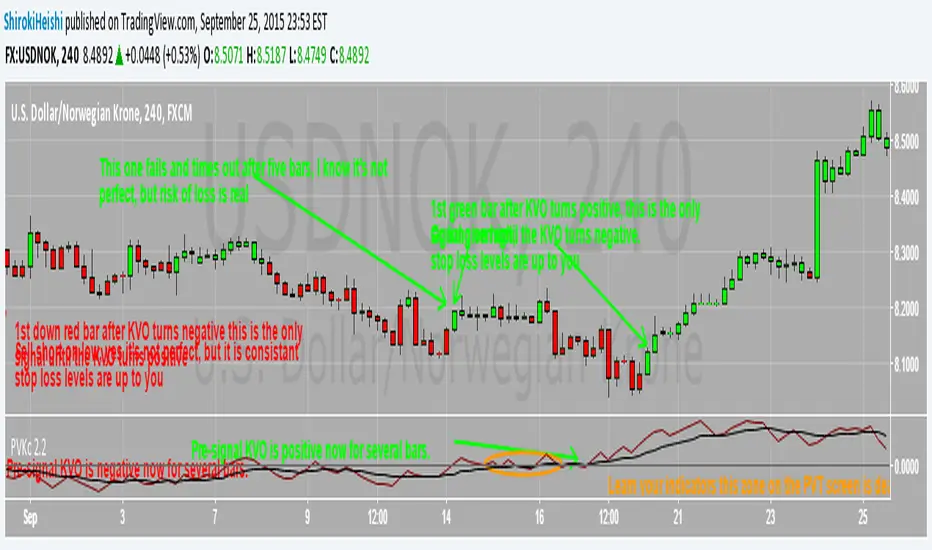
Klinger Volume Price Trend comboA simple to use volume signaling device. Instructions within the script
In this two screen example the first is the KVO presignal, second is PVT
Enjoy responsibly.
ShirokiHeishi

Modified Price-Volume Trend Indicator The related article is copyrighted material from Stocks & Commodities Apr 2010.