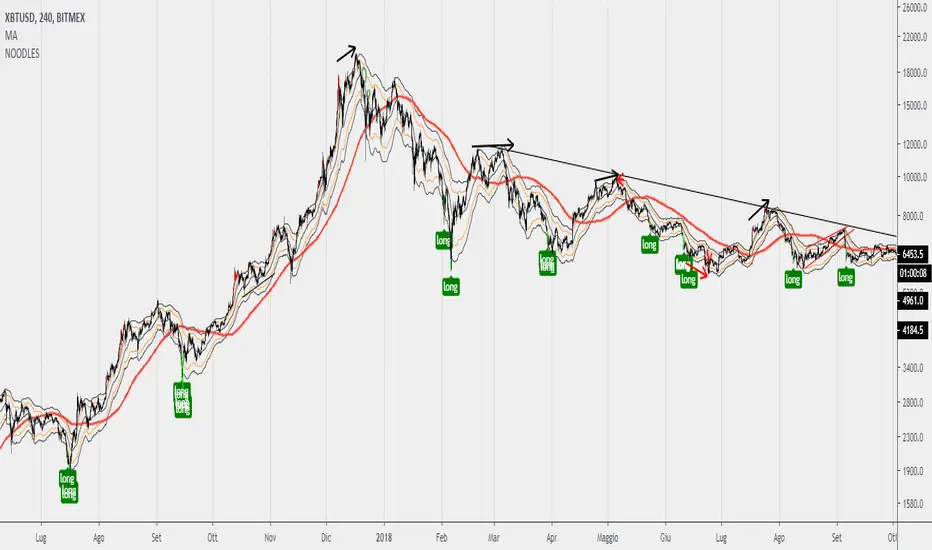
Noodles ema bands + BUY/SELL signal CandleEma bands as support and resistance based on 12/26.
+Buy and Sell signal candle (green and red)
This script work better on 1 hour timeframe. for altcoin change setup from source: ''LOW'' to ''OPEN''
Price Volume Trend (PVT)
TEDong Price Velocity MotionHi Folg,
TEDong Price Velocity Motion indikator for XBT is based on Physics Newton Law.
It gives a Buy signal when the Line value crosses up its EMA and a Sell signal when it crosses down its EMA .
Cross over markers Directional bgcolor, where RED for bearish (S) and GREEN for bullish (B)
If you include volume analyses in your trading strategy, automating EDong Price Velocity Motion will give buy signals whenever volume and price are rising altogether.
HINT:
Bullish when line/BG is green, bearish when line/BG is red. BUY on first green candle, SELLl on first red candle.
DONATE/TIP
BTC: 13nhMN2H4LoRi4VMcPcyR96jitxrH3uivB

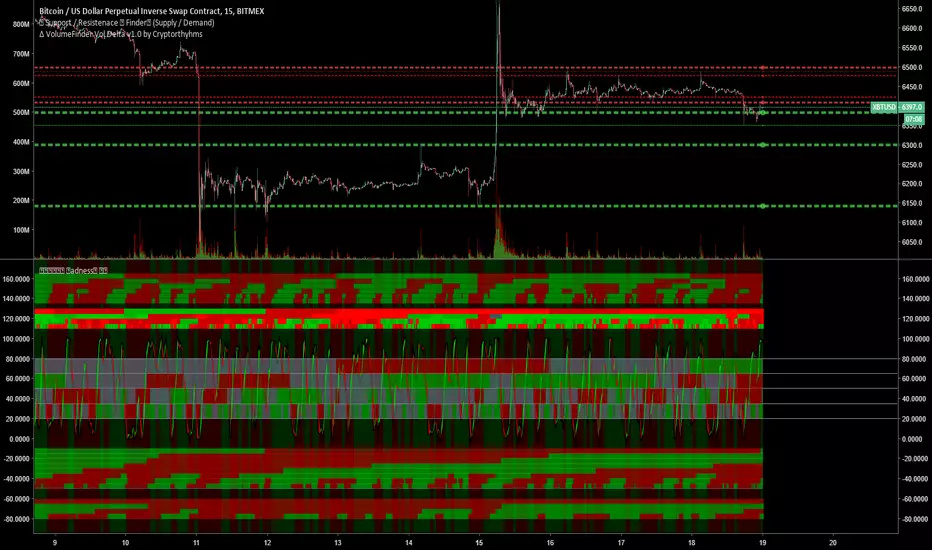
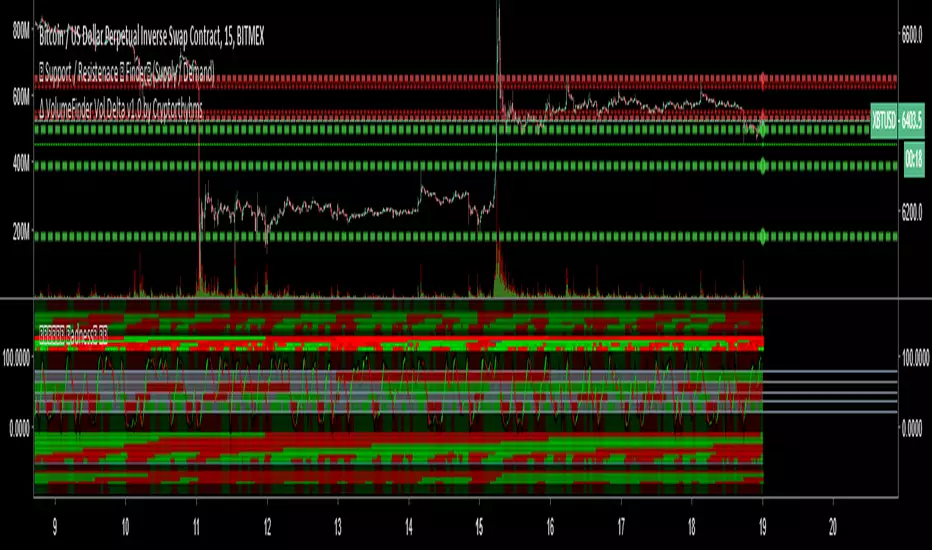
💸 Divergence Finder v1.0 by Cryptothythms💸 Divergence Finder v1.0 by Cryptothythms
Intro
This indicator is meant as a quantitative look at divergences. Special thanks to RicardoSantos (legend!) for his divergence detection script which was used as a basis to construct this.
Usage
Lime Green = Regular Bullish Divergence
Dark Green = Hidden Bullish Divergence
Red = Regular Bearish Divergence
Maroon = Hidden Bearish Divergence
Remember... divergences do not have a high probability success overall. So to mitigate that this is an attempt to source many "opinions" on the state of divergence from many different classes of indicators.
Leading indicators - Lead price action, but have a higher probability of false signals
Real time indicators - Track price action, momentum, etc in a tick by tick state. Generally a 1-3 bars lag can be present.
Lagging indicators - Lag price action a little, but offer more in terms of confirmation of the divergence
Volume indicators - Look at volume flow in different fashions and give an added dimension to divergence finding. Remember volume divergences interact with price independently. For instance volume can be going down, but price going up. Be sure to understand the relationship of volume and price action when considering these readings.
👍 Enjoying this indicator or find it useful? Please give me a like and follow! I post crypto analysis, price action strategies and free indicators regularly.
💬 Questions? Comments? Want to get access to an entire suite of proven trading indicators? Come visit us on telegram and chat, or just soak up some knowledge. We make timely posts about the market, news, and strategy everyday. Our community isn't open only to subscribers - everyone is welcome to join.
For Trialers & Chat: t.me/cryptorhythms

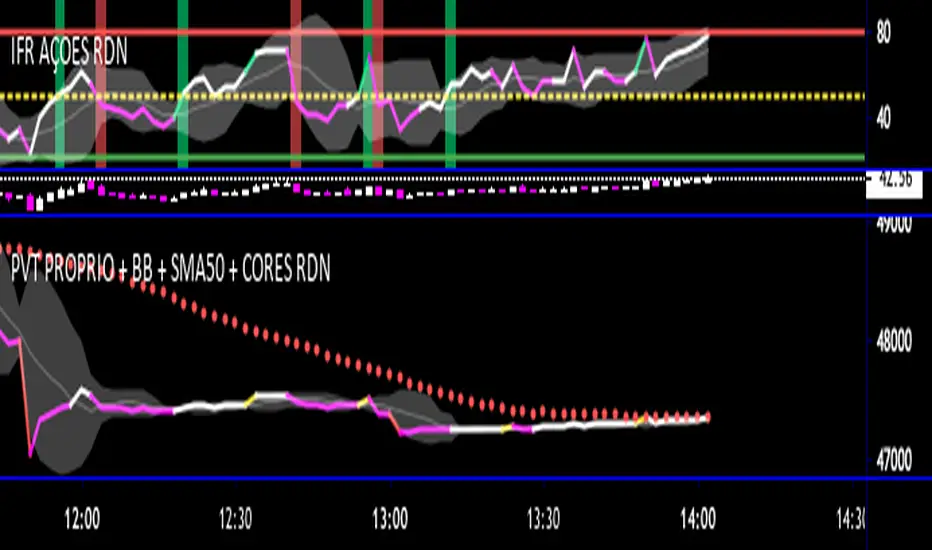
PVT + BB + Período Personalizado com cores RDNEste Script é personalizado. É um PVT com bandas de Bollinger que muda de cores os candles no gráfico e também a linha do PVT
Sugestões e maiores informações de uso adicione @rafdourado
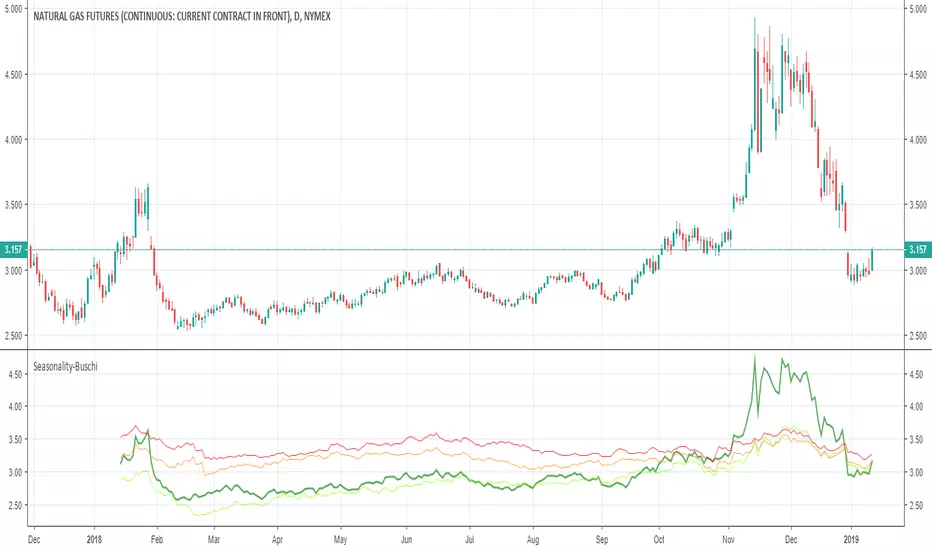
Seasonality-Buschi
English:
This script shows the price development over the last year (default: green) and mean prices over the last three (default: light green), six (default: orange) and nine (default: red) years and is therefore at least some kind of approach towards true seasonality.
Thanks to user "apozdnyakov" for providing most of the code!
Deutsch:
Dieses Skript zeigt den Kursverlauf über das letzte Jahr (Standard: grün) und die durchschnittlichen Verläufe über die letzten drei (Standard: hellgrün), sechs (Standard: orange) und neun (Standard: rot) Jahre und stellt damit zumindest eine Annäherung zu einer echten Saisonalität dar.
Dank an User "apozdnyakov", der den Großteil des Codes zur Verfügung gestellt hat!
Trader Set - Volume CandleThis is a candlestick system but not on price. These candles are drawn based on the volume movement. This is one of those professional charting systems that big industries use every day. Remember, the key to find what smart money is doing, is always VOLUME. Any new way that you can track new aspects of volume will help determining what the market will do, BEFORE it starts doing it !
There are total of Seven moving averages that you can ...:
1- Set their period separately
2- Set their type separately
3- Turn on/off separately
The averaging types that are supported, remember you have options PER moving average :
- SMA
- EMA
- RMA
- WMA
- HMA
- KAMA
- MAMA
- FAMA
This script IS FOR SALE , you can buy it with crypto currencies, or webmoney or perfect money. THE PRICE is 55$. for life time license.
You can find all the crypto wallet addresses plus webmoney and perfect money accounts in the link below. Please send the correct amount PLUS the transaction fee. After the transaction is confirmed, contact me with the info of the transaction for granting access.
AَِDDRESSES FOR WALLETS : justpaste.it

Cumulative Force IndexVolume indicator adapted from Elder's Force Index.
From here:
stageanalysis.net


[IE] RSI - BEAR/BULL - DivergencesDetect divergences in price and RSI.
Also mark overbought and oversold RSI.
Useful for scalps.
Contact in private for access
🕟𝕄🕗𝕋🕛𝔽 Madness MTF Grid by 🇨🇷🇾🇵🇹🇴🇷🇹🇭🇾🇭🇲🇸Here is a short description. This indicator being free will not have documentation for ALL things. Just the basics. There are 5 indicators included in it which I will not go into how each one works. There is ALOT of info on all the indicators included in here, just use google for that.
📊For each "row" of colored bands this represents one indicator. This is meant to be used on the 15m (or less) timeframe, and it looks up into higher TF's. It is meant to be maximized, so have this open in one tab and the chart on another. Dual Monitors are best. All options and Time frames are fully configurable inputs.
📈Indicators from top to bottom are:
1.)Polarity Filtration - 6 Timeframes
2.) Price Volume Trend - 4 Timeframes
3.) Stochastic RSI - 4 Timeframe Grid, and Current Timeframe in lines/ribbons
4.) MACD Crossovers - 8 Timeframes
5.)SuperTrend - 4 Timeframes
⏲Inside each larger "band" there are smaller rows. Each of these small rows represents one timeframe (30m, 60, 2h, 4h, etc) What timeframes you choose for them is completely configurable althought the current setup is already ideal to trade on 15m
⏲For these smaller rows the ones on top are highest timeframe(i.e. 4h) and the bottom small rows are lowest timeframe
⏲So each small row is like being able to check that indicator many timeframes at once. This will help you determine overall trends without switching to different timeframes on your chart all the time
📈The last piece of the puzzle is the background color. This background color is whether the chart is going up or down on the 1 hour heiken Ashi candle chart. Heiken ashi always shows up or down based on how they draw the candles, so its another useful trend indicator
👍If you enjoy MTF Madness all I ask in return is that you like the indicator and follow me on tradingview (profile here: www.tradingview.com)
❓If you have any questions, join us in the telegram chat in my signature!
JSE Wyckoff Wave Volume Code// The Stock Market Institute (SMI) describes an propriety indicator the "SMI Wyckoff Wave" for US Stocks. This code is an attempt to make a Wyckoff Wave for the Johannesburg Stock Exchange (JSE).
// The JSE Wyckoff Wave is in a separate code. This is the code for the volume of the wave. Please see code for the JSE Wyckoff Wave which goes with this indicator.
//
// The Wave presents a normalized price for the 10 selected stocks (An Index for the 10 stocks).
// The theory is to select stocks that are widely held, market leaders, actively traded and participate in important market moves.
// This is only my attempt to select 10 stocks and a different selection can be made.
// I am not certain how SMI determine their weightings but what I have done it to equalize the Rand value of the stock volumne so that moves are of equal magnitude.
// The then provides a view of the overall condition of the market and volume flow in the market.
//
// I have used the September 2018 price to normalize the stock price for the 10 selected stocks based. The stocks and weightings can be changed periodically depending on the performance and leadership.
//
// Please, let me know if there is a better work around this.
The stocks and their weightings are:
"JSE:BTI"/0.79
"JSE:SHP"/2.87
"JSE:NPN"/0.18
"JSE:AGL"/1.96
"JSE:SOL"/1.0
"JSE:CFR"/4.42
"JSE:MND"/1.40
"JSE:MTN"/7.63
"JSE:SLM"/7.29
"JSE:FSR"/8.25

True Range Specified VolumeThis indicator measures the "Effort" required to shift price.
By using Volume and Average True Range, it reveals how much volume was used to create each candle period.
The resistance threshold is set to 1.5x and will light up with an aqua or purple colour (bullish or bearish candle).
This means that the current bar is 1.5 times the previous bar and can be seen as a signal of a buying or selling frenzy - potential reversal.
If the bars light up with lime green or red, then this indicates that the value has exceeded TWICE the resistance threshold - a very strong signal.
A moving average is also included and can be set to filter out lower level signals. you can choose either a SMA or EMA and can adjust this moving average up or down by a percentage.
There is also an option to use the standard candle range rather than Average true range, should you get curious.
Enjoy!!
------------------------------------------------------------------
Kind regards
Created 2018 - by @Squiggles#8806
Want to support the creation of these indicators?
LTC Tip Jar: LX4bUBdjiRPsagUbZoAczSGgDC4YqTJL7w

SWING TRADEmust be used with RSI CANDLES , helps keep you in the trade even better.
green candles buy
red/black sell
p.s right click the right hand price bar and click reset scale :)

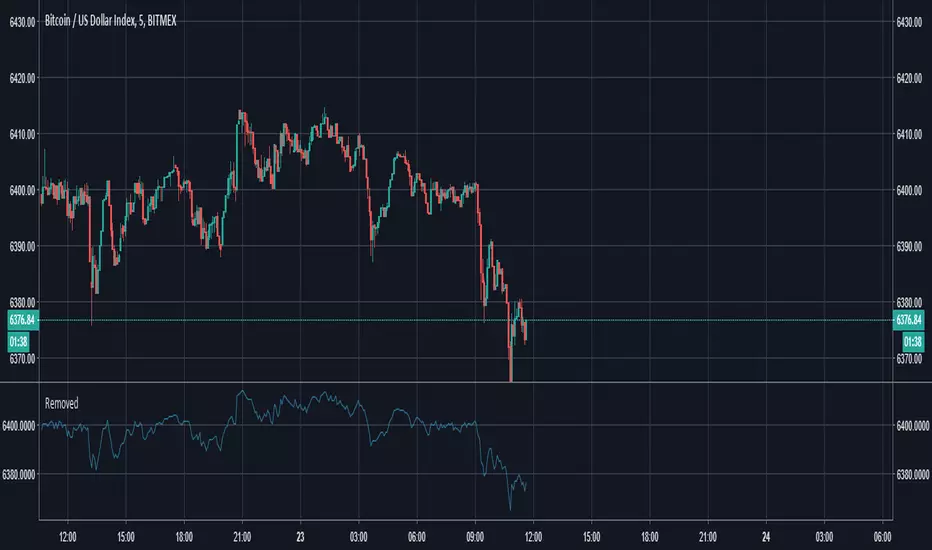
Price Volume ActionReal price movement vs. expectation based on volume. Useful for evaluating price/volume relationship and drawing insight.
The blue line is real % price movement. The background columns represent the expected % price movement based on the volume of that candle.
Similar to Ease of Movement in concept, but more appropriate for studying price action bar by bar.
The blue line (with default colors) being higher than it's gray column denotes ease of movement; a disproportionate amount of price movement compared to it's volume, basically a lack of resistance. The blue line being lower than the gray column implies higher resistance than expected.
In combination with the candles and volume this allows a deeper insight into the market action in context.
Options to switch between High/Low values and Open/Close values. Optional colorblind friendly color schemes.

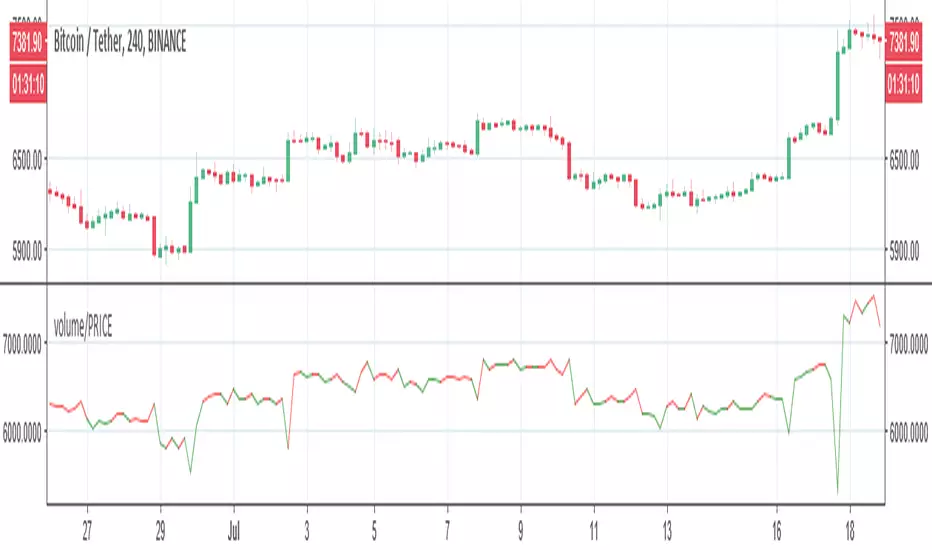
Volume/Pricethis is simple volume indicator by price
see the following trend- when the candle is red there is spike in volume before the rise up and next green candle. the indicator will deflect down with green -the stronger the volume the stronger the down deflection, the next bar will be green and strong up.
with down it will be opposite
Better X-Trend /Better Volume Paint BarThese are Emini-Watch's free indicators, Better X-Trend and Better Volume paint bar.
For more information go to:
emini-watch.com emini-watch.com
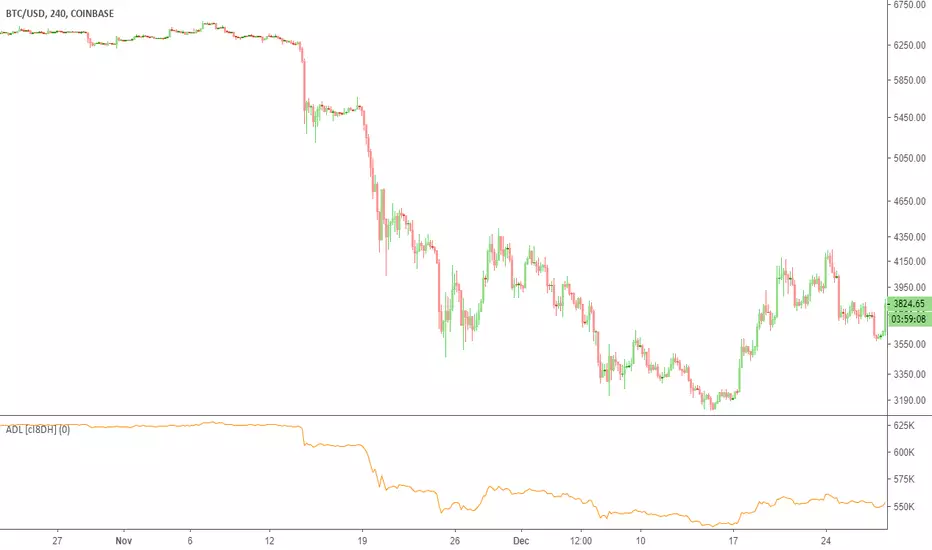
Accumulation/Distribution Level (ADL) [Cyrus c|:D]This indicator shows Accumulation/Distribution level which can be used for confirming trends or reversals (via divergence). It is an alternative to Chaikin's Accumulation/Distribution Line (ADL) and On Balance Volume (OBV) indicators. It can also replicate PVT and OBV via options in the input menu.
Here is a comparison of four related indicators:
OBV is too simple and has serious flaws as explained in PVT's wiki.
Chaikin's ADL is a broken indicator as can be seen in the chart below:
A/D Level addresses the flaws in these two indicators. It simply sums up portions of the volume that contributes to price change. These portions are visualized in dark green and red on "Accumulation/Distribution Volume (ADV)" indicator. This can also be achieved by ADV indicator if you are nerd enough.
PS: There is Williams A/D as well which is also a broken indicator.
Accumulation/Distribution VolumeThis is a simple yet powerful indicator that can replace volume, Money Flow, Chaikin Money Flow, Price Volume Trend (PVT), Accumulation/Distribution Line (ADL), On Balance Volume (OBV).
When "Baseline Chart" option is disabled, it looks similar to regular volume. The volume bars has two shades of green and red. The dark shade shows amount of accumulation and the light shade shows total volume (what you see on a regular volume indicator). Blue line is the moving average (or cumulative total) of A/D and the gray line is for total volume.
When money volume is enabled, volume it multiplied by price. As you can see in the chart below, trade volume in terms of USD was declining after ATH. This is not the case in regular volume chart which shows instrument volume (chart above).
In Baseline view, the aggregation method you choose can turn it into different indicators. With EMA/SMA aggregation, blue and gray line shows buy/sell pressure. At 0, there is not buy or sell pressure.
If you turn off volume bars (from style menu), it gives you a reliable indicator to measure divergence. This should be more reliable than most other range-bound indicators (i.e. RSI, MFI, CMF). I will publish a TA about correctly measuring divergence (it's a must read even if you are a pro trader). Make sure that the length is set to a large number on smaller TFs such as 4h.
For following results, set aggregation to cumulative and turn off money volume:
When wick weight=0, the GRAY line is identical to OBV indicator.
When normalized by spread and wick weight=10, the BLUE line is identical to ADL (improved by true range).
When normalized by previous bar price, wick weight=0, the BLUE line is identical to PVT.
How I use this indicator:
- Baseline chart, replaced my regular volume indicator
- Mostly 4h TF for divergence
- EMA aggregation (and occasional cumulative aggregation) with length above 50. I change the length to 100 and 200 for confirmation.
- Wick weight=0 or max 2.
With this indicator, you can learn how different indicators are built and how they are different from each other. I will publish a TA to explain more about different indicators and their pros and cons.
I will publish this indicator without volume bars and additional options to make it range bound.

DepthHouse Better VolumeDepthHouse Better Volume takes the standard volume bars and gives it an extreme overhaul.
The brighter colored bars signal strong buying or selling pressure in the market based on the volume.
The small lines within the columns represent the duration of this increased buying and selling volume.
This calculation is based on negative and positive volume flow. These variables are based on the moving average length, type, and percent change.
All of which are user defined.
DepthHouse Better Volume also changes how each bar color is calculated. The traditional calculation is dependent on the open and close of the candle. Whereas this volume indicator calculates the displayed color based on the position of the bar relevant to the last.
The user has the option to turn this feature on or off.
Try this indicator for FREE! Just leave a comment, or feel free to send me a PM

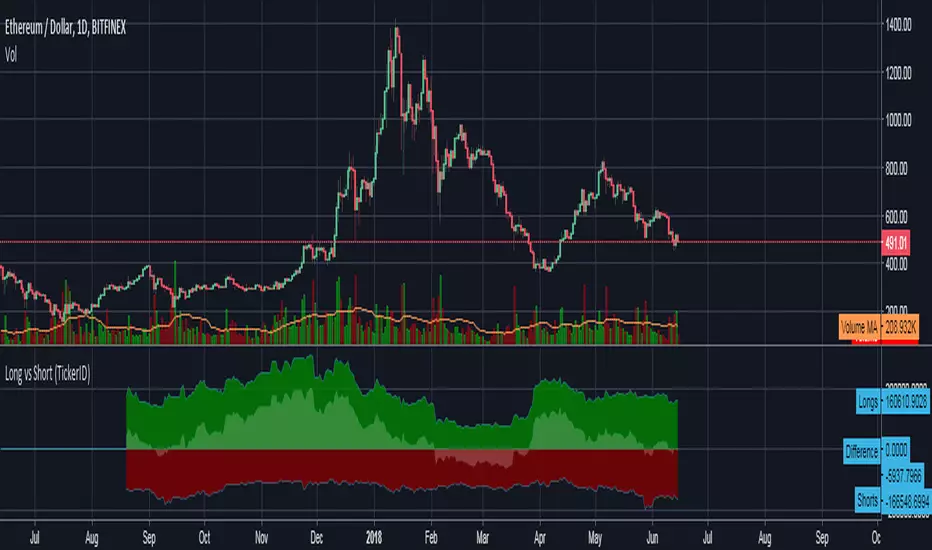
Bitfinex Long vs Short (TickerID)Uses the active ticker to show long/short values on all Bitfinex pairs that have that data available on Tradingview.
BottomFinder MTF Madness - 5x MTF Grid IndicatorsHello Again Trading View!
Bottom Finder Team here bringing another delicious indicator, this time to help spot those trends! This version is closed for Beta Testing with our subscribers only for the next few weeks. After beta improvements it will be released free to anyone who signs up as a free member on our site.
This is meant to be used on the 15m timeframe, and it looks up into higher TF's. It is meant to be maximized, so have this open in one tab and the chart on another. Dual Monitors are best. All options and Time frames are fully configurable inputs.
Indicators from top to bottom are:
1.)Polarity Filtration - 6 Timeframes
2.)Price Volume Trend - 4 Timeframes
3.)Stochastic RSI - 4 Timeframe Grid, and Current Timeframe in lines/ribbons
4.)MACD Crossovers - 8 Timeframes
5.)SuperTrend - 4 Timeframes
And last...
6.)Background Color indicator is up/down (green/red) price on 1 Hour Heiken Ashi candle chart.
No more swapping back and forth between timeframes!
For access to this and many other exclusive indicators - you can visit our telegram and ask about becoming a subscriber. All our paid indicators have a reasonable lifetime cap price. Once you reach it, indicator is yours for life - no more subscription.
Volume Strength Candles / Colored BarsIs Price Action Higher or Lower on STRONG or WEAK VOLUME from lookback
(Strong or Weak Bulls // Strong or Weak Bears)
Candles / Bars Indicate the Following (default 13 period lookback / Length)
MAROON Bear Candle with STRONG VOLUME more than 150% of the lookback / length (13 default), STRONG Bear Candle Confirmed With Volume
RED Bear Candle while VOLUME is BETWEEN 50% & 150% of the Lookback / Length (13 default), Neutral Bear Volume Neither strong or weak
ORANGE Bear Candle with WEAK VOLUME (Less than 50% of the Length / Lookback)
DARK GREEN Bull Candle with STRONG VOLUME MORE than 150% of lookback
GREEN Bull Candle with Neutral VOLUME BETWEEN 50% & 150% of the lookback / Length
AQUA Bull Candle with WEAK VOLUME less than 50% of the Lookback
Is price confirmed by volume?
Can Change the Lookback / Length from 13
Can Change the Colors and Transparency to easily see based off your chart background colors I recommend ZERO Transparency to easily identify volume strength (i use white background but many use black or other)
