Put/Call RatioPut/Call Ratio Indicator
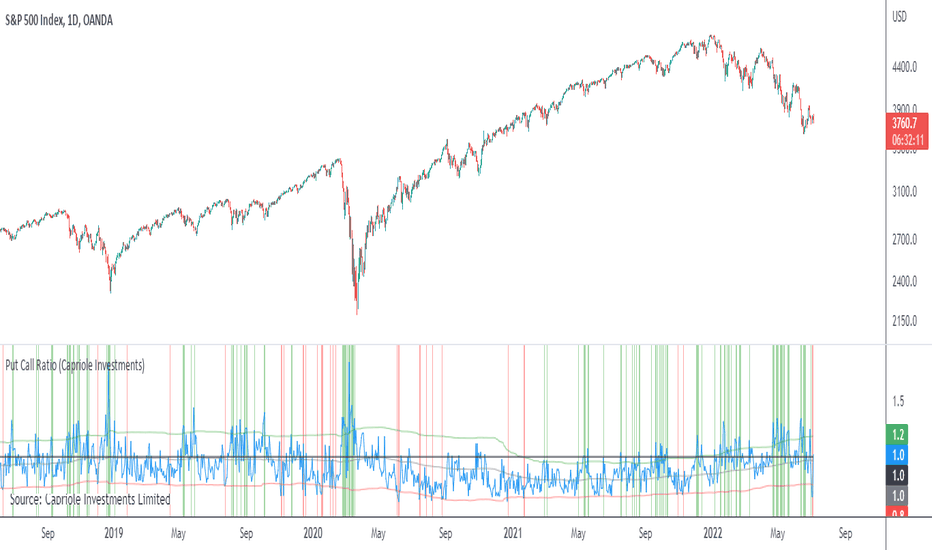
This indicator visualizes the Put/Call Ratio for various market symbols, helping traders assess market sentiment and potential reversals. It offers a dropdown menu to select from a range of Put/Call Ratios, including broad equities (CBOE), major indices (SPX, QQQ, IWM, VIX), and individual stocks (TSLA, GOOG, META, AMZN, MSFT, INTC).
The indicator plots the Put/Call Ratio with adjustable moving averages and standard deviation bands to highlight overbought or oversold conditions. A short-term moving average (default: 10 periods) is displayed with trend-based coloring, while longer-term moving averages (defaults: 30 and 200 periods) are calculated but hidden by default. Bands at 1, 1.5, and 2 standard deviations provide context for extreme readings.
Key Overbought/Oversold Signals:
Short-Term Extremes: The 10-day moving average moves beyond 1 standard deviation from the 200-day moving average, signaling potential overbought (above) or oversold (below) conditions. This will be highlighted by red or green background color.
Ratio Extremes: The Put/Call Ratio line itself crosses outside 2 standard deviations from the 200-day moving average, indicating stronger overbought or oversold zones.
Conditional coloring of the ratio line reflects its position relative to the bands, and background shading highlights when the short-term moving average crosses key levels.
Key Features:
Selectable Put/Call Ratio symbols.
Trend-colored moving averages.
Standard deviation bands for volatility analysis.
Dynamic line and background coloring for quick insights.
Usage:
Use this indicator to gauge market sentiment—high ratios may suggest bearish sentiment or oversold conditions, while low ratios may indicate bullish sentiment or overbought conditions. Combine with price action or other tools for confirmation.
Put/Call Ratio (PCR)
Accumulated Put/Call Ratio V2This is an updated version of the Accumulated P/C Ratio. Some changes include:
- Pinescript privacy changed from protected to open.
- Utilizes the "request.security_lower_tf" function for weekly and monthly charts.
- Now acquires and sums raw put volume (ticker: PVOL) and call volume (ticker: CVOL) separately, then divides the aggregate put to aggregate call to get the P/C ratio, as opposed to the original version which directly sums the put call ratio (ticker: PCC). Mathematically this calculation makes more sense, but the major drawback of this change seems to be that PVOL and CVOL don't have as much historical data as PCC.
The way to interpret the indicator is the same as the original version - higher values are bullish while lower values are bearish. A solid (0 transparency) bar means that the value is beyond 3 standard deviations within a particular period.
(CM|DB) Caruso Market DashboardThe Caruso Market Dashboard (CM|DB) provides a snapshot of key US market data, market internals (breadth), and economic statistics. It displays real-time prices of seven major markets along with daily updates of the put/call ratio and multiple breadth measurements. Lastly, it displays the Federal Reserve’s balance sheet and 4-week change of assets held to help investors keep abreast of important FED changes in policy.
Presented for both the Nasdaq and NYSE composites and updated at the end of each trading day, the market breadth section shows:
· the number of net 52-week highs and lows
· the actual number of new 52-week highs and 52-week lows.
· The percentage of volume traded on up stocks vs. total volume
· The percentage of stocks advancing vs. all stocks
· Percentage of stocks above their 5-day average
· Percentage of stocks above their 50-day average
· Percentage of stocks above their 200-day average
In addition to presenting all of this valuable information in a table, users can hide the table and plot each market and economic data point. This is very helpful when viewing trends as well as overbought and oversold levels for these data points.
I11L Long Put/Call Ratio InversionThe Strategy uses the Put/Call Options Ratio Inversaion as a Signal and Implements simple Money Management rules.
It is adjusted for the NDX and for the SPX in the 30min Range.
The Oscilation has to be finetuned to reflect the correct Reversal point.
A good indicator of the correct Reversal Point is a solid range of good backtesting results..
Accumulated Put/Call RatioThe Concept:
The Accumulated Put/Call Ratio indicator applies numerous adjustments to the conventional put/call ratio in pursuit of:
- clearer trading signals;
- adjustable sensitivity; and
- better readability.
Before getting into what the Accumulated Put/Call Ratio is, we first need to understand the original Put/Call ratio.
Put/Call Ratio
The conventional put-call ratio (P/C ratio) is calculated by dividing the number of traded put options by the number of traded call options.
A put option is the right to sell an asset, while a call option is the right to buy an asset. Generally speaking, sentiment is bearish when more put options are traded than call options. By dividing the number of puts to the number of calls, we can gauge how market participants feel about the current market condition. Since the P/C ratio uses puts as the numerator and calls as the denominator, a P/C ratio value above 1 suggests a bearish sentiment while a value below 1 suggests bullish sentiment.
However, the conventional P/C ratio also comes with some drawbacks.
Firstly, the P/C ratio is quite noisy and can create choppy trading signals.
Secondly, the P/C ratio generally moves inversely with the market, which might be counterintuitive for some people. The indicator would be much easier to read if it moved in the same direction with the market.
Thirdly, we cannot adjust the sensitivity of the P/C ratio through variable inputs (the raw P/C ratio data pulled from CBOE does not have any variable inputs).
This is where the Accumulated Put/Call Ratio comes in.
Accumulated Put/Call Ratio
The Accumulated P/C ratio attempts to address the above issues of the conventional P/C ratio by:
adding N bars of P/C ratio values together to get the Accumulated P/C ratio - such summation of multiple P/C ratio values greatly reduces the noisiness of the indicator;
calculating the difference between the current Accumulated P/C ratio and the previous high and low Accumulated P/C ratio values during a lookback period - this generates “difference from max.” and “difference from min.” signals that allow the trader to see both bullish sentiment and bearish sentiment simultaneously; and
adjusting the Accumulated P/C ratio such that trading signals are in the same direction as the market.
To further improve readability, the indicator calculates the mean and standard deviation values of the above differences to use as a coloring reference. A difference value closer to the mean will have more transparent colors, while a difference value closer to the 3rd standard deviation will have more solid colors (completely solid colors when > 3 standard deviations). This highlights the extreme values.
The Variables:
This indicator has three inputs: (1) N bars of accumulation, (2) Lookback Period, and (3) Standard Deviation Period.
The first variable “N bars of accumulation” sets the number of P/C ratio values for adding up. Smaller values produce fast but noisy signals, while larger values produce smooth but slow signals.
The second variable “Lookback Period” determines the lookback range for finding high and low Accumulated P/C ratio values. Again, smaller values are more sensitive but can become more choppy.
The third variable “Standard Deviation Period” is used for bar coloring only. This does not affect the indicator signal values.
The user will have to do some testing to see which settings suit their needs.
The Signals:
Trading signals for the Accumulated P/C ratio come in two forms:
1. Relative size of “difference from max.” (green bars) compared to “difference from min.” (red bars)
A P/C ratio closer to the max. is bearish (remember puts data is placed in the numerator), so when the “difference from max.” approaches 0, the indicator suggest bearish sentiment.
A P/C ratio closer to the min. is bullish, so when the “difference from min.” approaches 0, the indicator suggest bullish sentiment.
A “difference from max.” larger (in terms of absolute size) than the “difference from min.” is bullish.
A “difference from max.” smaller (in terms of absolute size) than the “difference from min.” is bearish.
2. Divergences
When the “difference from max.” is gradually decreasing during an uptrend, this forms a bearish divergence.
When the “difference from min.” is gradually increasing during a downtrend, this forms a bullish divergence.
Options Flow Intraday SentimentScript useful for Intraday Trading - which based on Options data loaded in background - is showing sentiment of Investors. Very often Options are forecasting and precedes moves that will happen later on derivatives like Futures Contracts. Due to its' nature, data is useful during Regular Trading Hours sessions ( RTH ).
We take into account Options Volume flow & Put/Call Ratio from Options. Data is based from dataset on Quandl and loaded to TradingView. Therefore data is normalized as per different factors we have different scale of received data. Then I apply calculations comparing PUT and CALL Volume, giving the biggest weight ratio to those Options which have nearest Expiration Date. Another condition taken into account is Type of Option: either In the Money, Out of Money or At the money. Last but not least for Options there is calculated risk, where those orderflow entries with lowest risk are having the biggest weight in calculation while those with highest risk - are having lower ratio. Risk is calculated based on delta factor (coming out of Options standard definitions).
Background of indicator is coloured in direction of sentiment when we have alignment of sentiment factors calculated in background in one direction. Script is displaying additionally PUT Volume, CALL Volume from Options and PUT/CALL Ratio. Those are only additional information that can be useful for traders, but the whole logic is hidden under the hood (as described earlier) and is showing coloured background when sentiment is aligned. Therefore be prepared to take potentially a trade in direction of the background - but not blindly
Currently it's supporting SPX ( S&P500 ) and support for more instruments will come with next updates.
Month Spread Ratio [Nic]Used for front month future contracts. Creates a ratio with the next monthly contract to detect rolling.
SMART4TRADER-US STOCKSThe indicator is intended to evaluate the stock market , as it takes into account the data on the BUY and SELL of all US shares. In the indicator, you can select various methods for providing data.
Priority = (BUY - SELL) with a intraday cumulative effect.
Ratio = (BUY / SELL) with a intraday cumulative effect.
Delta = (BUY - SELL) on each candle.
Volume = (BUY + SELL) on each candle.
Cumulative = (BUY - SELL) with cumulative for all available history.
------------------------------
Индикатор предназначен для оценки фондового рынка , так как в себе учитывает данные о покупка и продажах всех акций США. В индикаторе можно выбрать различные методы предоставления данных.
PRIORITY = (BUY - SELL) с накопительным эффектом внутри дня.
RATIO= (BUY / SELL) с накопительным эффектом внутри дня.
DELTA= (BUY - SELL) на каждой свече.
VOLUME= (BUY + SELL) на каждой свече.
CUMULATIVE= (BUY - SELL) с накопительным за всю доступную историю на графике.
Valuation Scenarios by Filipe RamosEnglish:
An indicator that allows you to project a scenario of fair value of a stock considering expected revenue growth and net margin in a DCF model. Rather than forecast what should be the price of a stock, this indicator calculates possible scenarios accordingly to expected growth and value added the user inputs. It has 3 parameters:
-Years: the timeframe of projected present value;
-Revenue yearly growth percentage: minimum value is 1.1 (represents 10% annual growth but with the discount rate of 10% means no growth at all);
-Margin: the net margin.
It projects a linear growth and an exponential growth.
PC-Indicator - Spar_maDeutsche Version Unterhalb.
English version:
This indicator is supposed to be another tool to recognize when a panic movement has begun and also ended. Of course, there are other indicators that work very well, but this can also help to identify the timeframe.
Description of for using the indicator with the example of the panic sell-off in March:
Before the selloff started, two areas can be identified in which the market is being tested. This is when at the same time, the price intersects with the 21 moving average and the put / call indicator. This indicates that something could be wrong (no guarantee, just an indicator). This happened first (marked with 1) when the virus was discovered: Few who had been informed had any idea what might happen. The second "drop" (marked 2) happened when it was publicly announced that such a virus existed. The third time the panic broke out (marked 3) long after the virus was known. The portfolios should have been hedged here at the latest. Shortly before the yellow marking the virus was reported daily and maximum panic were spread. This was the point at which the hedge could theoretically be ended (if you have the courage to do so). However, I myself waited until the 21st and the indicator were clearly broken.
This indicator could have helped to save a loss in value of the portfolio by at least 17%. I hope this indicator can continue to perform as well.
Please leave a like and subscribe if you are interested in further trading ideas from me.
Name of the indicator: “PC-Indicator - Spar_ma”
That’s my opinion and should be treated like it.
No trade advice!
______________________________________________________________________________________________
Deutsche Version:
Dieser Indikator soll ein weiteres Tool sein um erkennen zu können, wann eine panische Bewegung beendet ist. Natürlich gibt es weitere Indikatoren die sehr gut funktionieren, dieser kann jedoch zusätzlich dabei helfen zu erkennen wann es soweit ist.
Beschreibung des Indikators an Beispiel des Panischen sell-offs im März:
Bereits vor beginn sind zwei Bereiche zu erkennen, an denen der Markt getestet wird. Dabei kreuzen sich gleichzeitig der Kurs mit dem 21-gleitendem Durchschnitt und dem Put-/Call- Indikator. Das lässt darauf zurückführen, dass etwas kommen könnte. Dies geschah zuerst (mit 1 gekennzeichnet) bei der Entdeckung des Virus: Wenige die Informiert wahren, jedoch ahnten was passieren könnte. Der zweite „Drop“ (mit 2 gekennzeichnet) geschah als öffentlich bekannt gegeben wurde, dass ein solches Virus existiert. Beim dritten Mal brach die Panic aus (mit 3 gekennzeichnet), lange nachdem dieser Virus bekannt gewesen war. Spätestens hier sollte das Konto gehedged worden sein. Erst kurz vor der gelben Markierung wurde täglich vom Virus berichtet und maximale Panic verbreitet. Dies war der Zeitpunkt an dem theoretisch der Hedge beendet werden konnte (wenn man den Mut dazu hat). Ich selbst habe allerdings noch gewartet bis der 21ger und auch der Indikator klar durchbrochen wurde.
Dieser Indikator hätte dabei helfen können einen Wertverlust des Kontos um mindestens 17% ersparen zu können. Ich hoffe dieser Indikator kann weiterhin so gut performen.
Bitte lasst ein like da und abonniert mich, falls Ihr Interesse an weiteren trading-ideen von mir habt.
Name des Indikators: “PC-Indicator – Spar_ma”
Dies ist nur meine persönliche Meinung und sollte auch so betrachtet werden.
Dies ist keine Handelsempfehlung.
Risk And Reward Ratio CustomizableThis is Risk and Reward Ratio indicator that is Customizable.
You can adjust the value for risk in the setting area.
You can also adjust the value for reward in the setting area.
The default setting for risk is -5%, You can set untill -100%
The default setting for reward is 10%, You can set untill +1000%
This indicator will help in your decision making for the entry price and helpp you manage your risk and reward.
Put Call RatioPlots the CBOE Put Call Ratio and marks up locations of extremities.
Useful as a factor of confluence in identifying extremities in the market.
PIP BandsGot a little board due to the lock-down so I have written this little script.
It allows you to set PIP Bands at levels on the chart.
The Back Line is Close plus Spread, the Red Line is PIPs below and the Green Lines are spaced at PIPs above at equal distance.
The top four lines can be toggled off. Set off as default.
There is a toggle for JPY Currencies and also for Puts and Calls.
You can change the Spread and also the distance between bands by a set amount of PIP's.
You can either let it run at current close price or set price.
Hope you enjoy. Be safe.
Comments appreciated.
FS position sizethis is position sizing indicator base on Justin wise and his team on crackingcryptocurrency idea
so all credit goes to them
you can put your capital and risk amount that you tend to put on risk in a trade and it will measure your position size base on USD and BTC and it will measure your Take profits base on ATR which are editable.
Call / All Ratio ( C / A ) - NoldoFirst of all this script inspired by MagicEins' Put/Call-Ratio-Buschi script .
What is the Put-Call Ratio
The put-call ratio is an indicator ratio that provides information about relative trading volumes of an underlying security's put options to its call options. The put-call ratio has long been viewed as an indicator of investor sentiment in the markets, where a large proportion of puts to calls indicates bearish sentiment, and vice versa. Technical traders use the put-call ratio as an indicator of performance and as a barometer of overall market sentiment. Put-call ratios on broader indexes such as the S&P 500 are also used as more general gauges of market climate.
Put-Call Ratio Interpretation
One way to interpret the put-call ratio is to say that a higher ratio means it's time to sell and a lower ratio means it's time to buy, because when the ratio is high it suggests that people are either expecting or protecting more readily against a future decline in the price of the underlying. A Put-Call ratio between 0.5 and 1 is considered a sideways trend in the markets.
Some also view the Put-Call ratio as a contrarian indicator. Traders know that derivatives are used to do more than place bets; they are used as hedges and insurance. If there's a lot of insurance being placed to the sell side, it means traders are worried about prices falling.
Some traders buy when the put-call ratio is above 1, meaning the market is out of balance to the sell side, and sell when the put-call ratio is below 1, meaning the market is out of balance to the buy side. These traders are looking to make money on the correction. The interpretation of the ratio is left to the analyst's or trader's investment philosophy.
Reference : Investopedia (www.investopedia.com)
Let' s start.
In short, calls represent "bulls" and puts represent "bears".
Some analysts do the opposite,for trend reversals the choice is up to you.
I usually look at the opposite comments in commercial positions because I look at this flow angle neutral.
If you want to do the opposite, you must create Put / All Ratio.
So i created this ratio to observe easily movements under or over 0.50 area .
Or you can take the point close to 0.50 as a horizontal trend. Many more comments can be made.I have a few ideas about this, and I'm going to publish them soon . My best suggestion is that it covers a single bar and is very volatile, so you can look for averages and strong accelerations.
This code is open source under the MIT license. If you have any improvements or corrections to suggest, please send me a pull request via the github repository github.com
Stay tuned , best regards.
CBOE PCR Factor Dependent Variable Odd Generator This script is the my Dependent Variable Odd Generator script :
with the Put / Call Ratio ( PCR ) appended, only for CBOE and the instruments connected to it.
For CBOE this script is more accurate and faster than Dependent Variable Odd Generator. And the stagnant market odds are better and more realistic.
Do not use for timeframe periods less than 1 day.
Because PCR data may give repaint error.
My advice is to use the 1-week bars to gain insight into your analysis.
This code is open source under the MIT license. If you have any improvements or corrections to suggest, please send me a pull request via the github repository github.com
I hope it will help your work.Best regards!
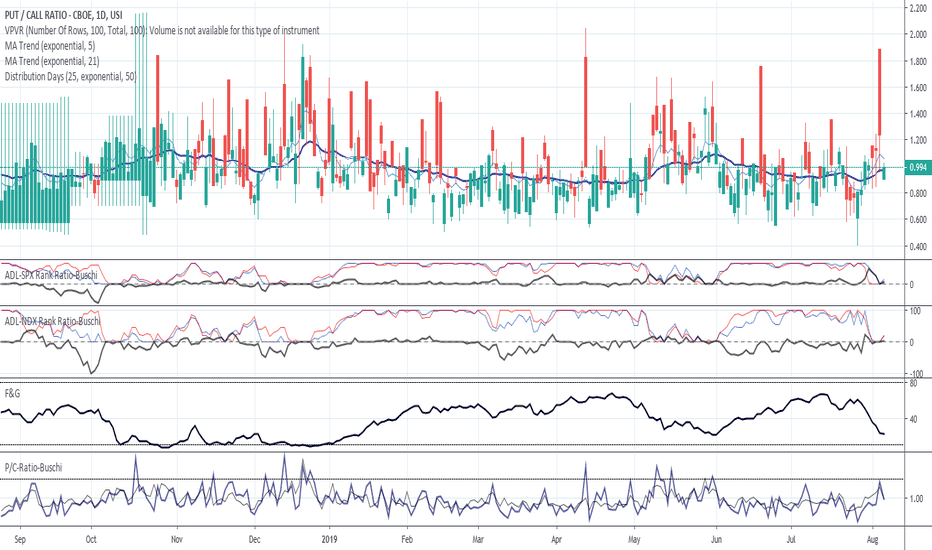
Put/Call-Ratio-Buschi
English:
This script shows the Put/Call-Ratio as seen on the Cboe-Website: www.cboe.com
A higher Put/Call-Ratio means a higher trading volume of puts compared to calls, which is a sign of a higher need for protection in the market.
For best reflection of the Cboe's data, which is shown in 30 minutes intervals, a 30 min-chart is recommended.
30 min-data as well as end-of-day data are shown.
Deutsch:
Dieses Skript zeigt das Put/Call Ratio, wie es auf der Cboe-Website angegeben ist: www.cboe.com
Ein höheres Put/Call Ratio bedeutet ein höheres Handelsvolumen von Puts gegenüber Calls, was ein Zeichen für Absicherungsbedarf im Markt darstellt.
Um die Cboe-Daten bestmöglich wiederzugeben, die in 30 Minuten-Intervallen herausgegeben werden, wird ein 30 min-Chart empfohlen.
Es werden sowohl die 30-Minuten-Daten als auch die Tagesenddaten angezeigt.
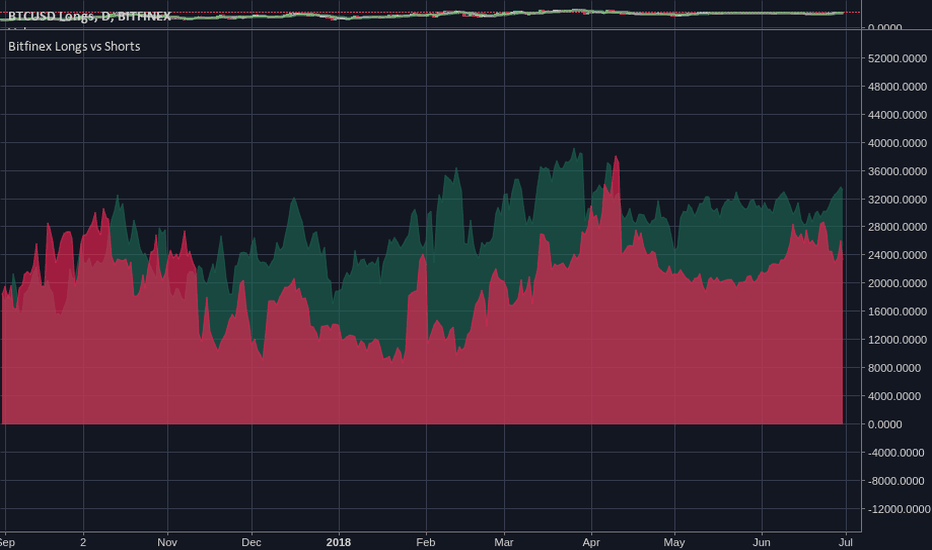
Bitfinex Longs vs Shortssexy view of the current long/short positions on Bitfinex. I saw some pay-for, hidden-source-code version of this and thought: "oh man."
Bitfinex dominionThis indicator will show you which gang is dominating the market : the bearish gang (short masters),
or the bullish gang (long masters).
The bearish gang is drawn in red and the Bullish one is in green color.
If red is above green, that means we have a bearish tendency on the market.
if green goes above red, that means the market is going the bullish way.
It's nice to use it on 1H or 30 minutes intervals.
Here's what I do : When the dominion is changing hands (=a shift in color), then that mean the market
is moving in another direction. I then use my other indicators to make a decision so to create a trade
at the very moment of the dominance change or not...
NB1: make sure you know what you do before using this "what I do" strategy. It can be not suited to
everyone. Trading is a risky business. So don't take words as granted from people like me or others.
The best thing to do is : testing,testing then re-testing while having a good money management.
I've burnt myself many times before.
NB2: Margin trading can be really risky if you use this "what I do" strategy. Because price can go far in
counter direction before getting back to our target price. So you can risk a margin call. So it's better
using this "what I do" strategy on market trading only.
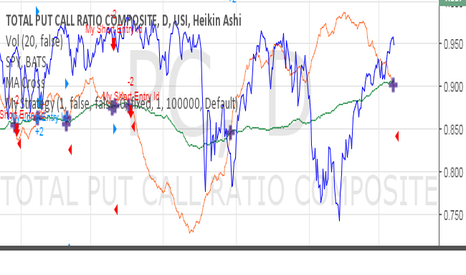
Put/call ratio cross - buy and sell SPYWhen 50DMA and 200DMA cross on PC, algo trades SPY accordingly


