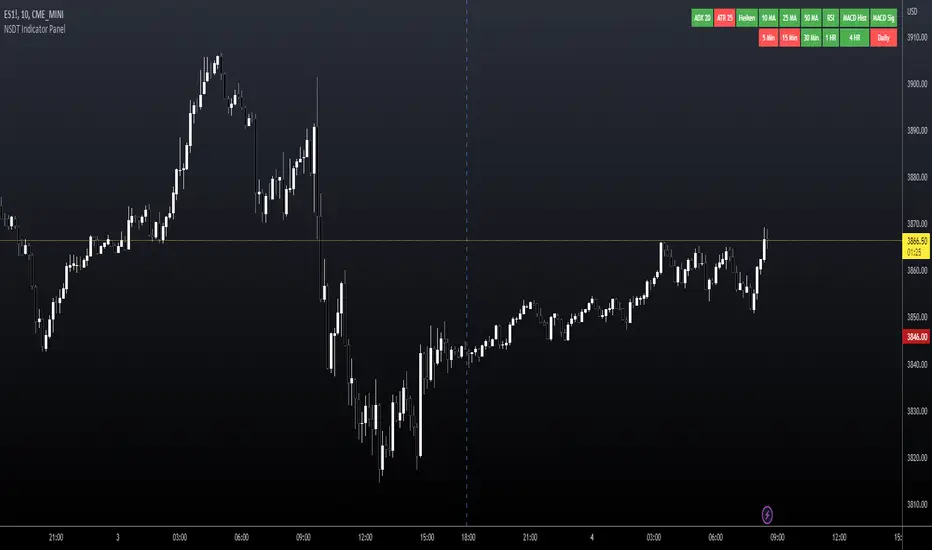
NSDT Indicator PanelThis indicator places a table on the bottom of the chart where each section changes color based on settings in each individual indicator. It provides a way to quickly glance at the chart and see the overall direction of the market with the combination of indicators.
All settings for each individual indicator are editable, so you can customize them to your unique specifications.
Relative Strength Index (RSI)
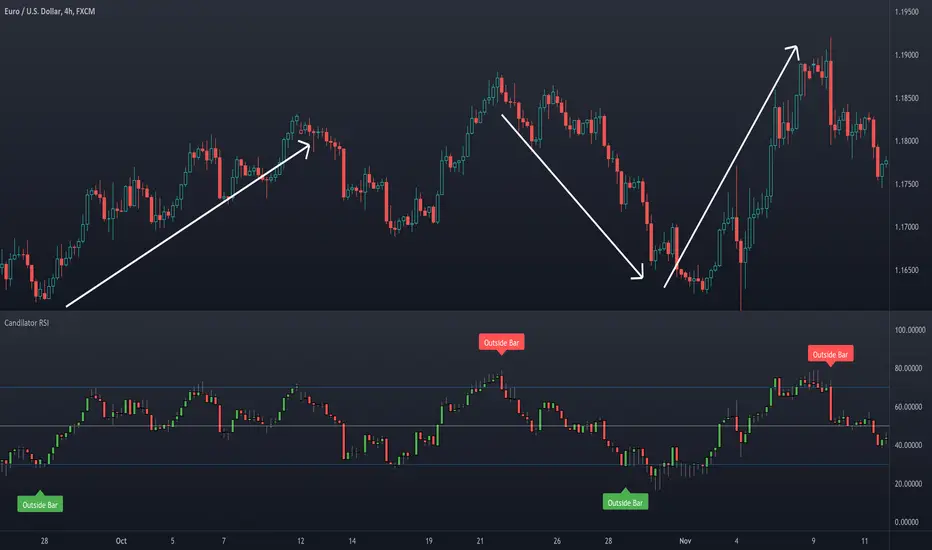
Candilator RSI [AstrideUnicorn]OVERVIEW
The name Candilator comes from blending the words "candlestick" and "oscillator". And as the name suggests, this indicator is a good old RSI plotted as a candlestick chart. To produce a candlestick chart, Candilator RSI calculates four RSI's based on the open, high, low, and close time series. It also has a candlestick patterns detection feature.
HOW TO USE
You can use Candilator RSI as a normal RSI to analyze momentum, detect overbought and oversold markets, and find the oscillator's divergences with the price. You can also get creative and apply all sorts of technical analysis to the RSI candlestick chart, including candlestick patterns analysis.
Candilator RSI can automatically scan the price for some candlestick patterns in the overbought and oversold zones. This feature can help detect price reversals early.
SETTINGS
The indicator settings are divided into two groups: Main Settings and Pattern Detection. In the Main Settings, you can find standard RSI settings. In the Pattern Detection part, you can turn on and off the automatic search for a particular candlestick pattern.
Rate Of Change and rsi zonesHi,
I played with the ROC ( Rate of change ) indicator.
First of all I made it smooth. And came up with decent buy sell signals for long-term potential trades. It can be useful for DCA and profit booking in market tops ( before potential crash)
Recommended time frame = 1 Daily , 3 Daily , Weekly.
Usage :
1. Look for Buy and sell arrow signals. But don't jump straight away. Specially for sell. You might sell early. Instead you can move up your stop loss when you see a sell signal or profit book partially.
if you wait and combine with your own supply and demand zones you can get some nice sell price.
2. Better to wait and look for a divergence in price and ROC. As price will slow down it will reflect on the ROC line. Which means market is exhausted and potentially a correction might happen.
3. You can draw trendline one the ROC and look for breakout. ( warning won't always work )
4. You can also see the RSI in thick red/green color. It will help you determine oversold and overbought zones. Trick is don't sell when it's oversold ( red thick line) . Because it might be a start of a strong uptrend.
So better is to wait and see when the signal is printing then execute.
Best strategy is to DCA and sell in parts whenever you see such signals.
I believe it will visually help us that when to be bull and when to be bear.
Anyway if you find it useful let me know in the comment.
Also if you have some idea to improve the code you can contribute as well.
Thanks . Feedbacks are welcome.

RSI with Divergences, Reverse Formulas, and Bull/Bear ZonesRegular RSI indicator that can underline divergences, turn green or red specifying user specified bull/bear zones, and with a label showing the price needed to turn bull/bear!
Specify the inputs:
+ RSI Length
+ Bull Threshold
+ Bear Threshold
+ Panel Position Offset
Also with toggle-able:
+ Bullish Divergence
+ Bearish Divergence
+ Hidden Bullish Divergence
+ Hidden Bearish Divergence
The zones included in the indicator are default and not meant to be used for all markets. The goal is to alter the bull/bear zones to find good breakout points and selloff points for your chosen security. Does not currently support automatic zone creation, or saving zones for each security (if that is even possible, may just need to create different layouts for each security).
Thanks!

Advantage RSI PredictorAdvantage RSI Predictor reverses the calculation of Relative Strength Index. Once the bar ends, this indicator calculates the price that needs to be reached (next bar) for RSI to move to a certain level. The indicator is plotted over price to show support and resistance zones based on RSI settings defined by user.
What do I see?
upper and lower (red) lines show where the price needs to move for RSI to show predefined levels; default settings are: RSI (close,14); 70-point as overbought level (upper); 30-point as oversold level (lower)
middle line (On/Off) calculates where the price needs to move for RSI to be 50 points
Why do I use it?
knowing support and resistances in advance, you can use it in day trading when intraday move reaches your support or resistance
by switching to a higher time frame, you can establish where support and resistance is in multiple time ranges
Finally, last but definitely not least, the main reason behind publishing this indicator is to prove that the RSI indicator is NOT what it is perceived to be.
RSI does not measure the velocity or magnitude of the recent move, but simply the distance between price and exponential moving average of the corresponding length.
50-point RSI Predictor(length) = Exponential moving average(2*length-1) shifted by 1 bar.

TropRSIThis is a variety of RSI based on the distance from the MA. It calculates the difference between price and a user defined EMA, then it calculates the RSI for the values obtained.
I find it more reactive and at the same time more adjustable thatn normal RSI.
It also shows divergences.
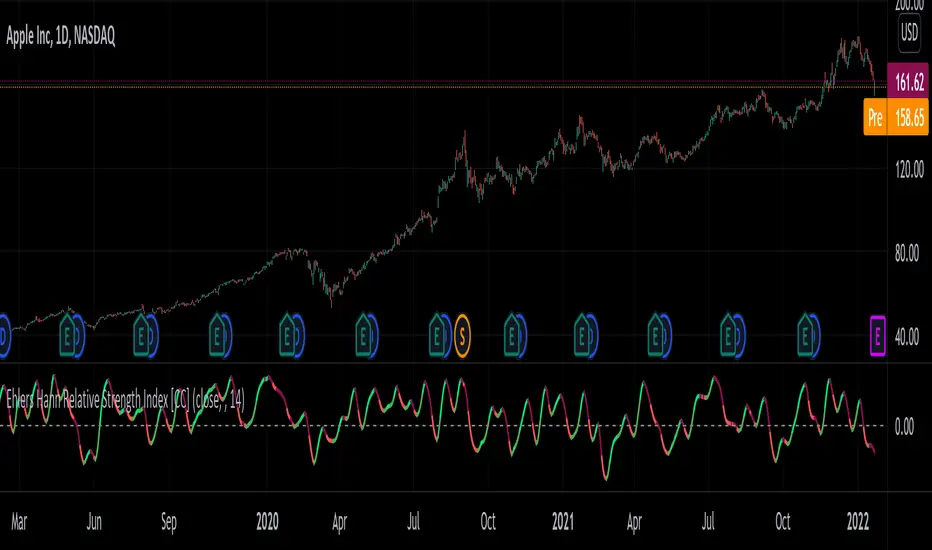
Ehlers Hann Relative Strength Index [CC]The Hann Relative Strength Index was created by John Ehlers (Stocks and Commodities Jan 2022 pgs 26-28) and this indicator builds upon his Hann Window Indicator to create an unique rsi indicator that doesn't rely on overbought or oversold levels to determine a reversal point and also provides a very superior smoothing without any of the lag associated with traditional smoothing. A much more useful RSI than the standard version in my honest opinion. Short term you buy when the line turns green and sell when it turns red. Medium to long term you buy when the indicator rises above the 0 line and sell when it falls below the 0 line. I have included strong buy and sell signals in addition to normal ones so strong signals are darker in color and normal signals are lighter in color.
Let me know if there are any other indicators or scripts you would like to see me publish!
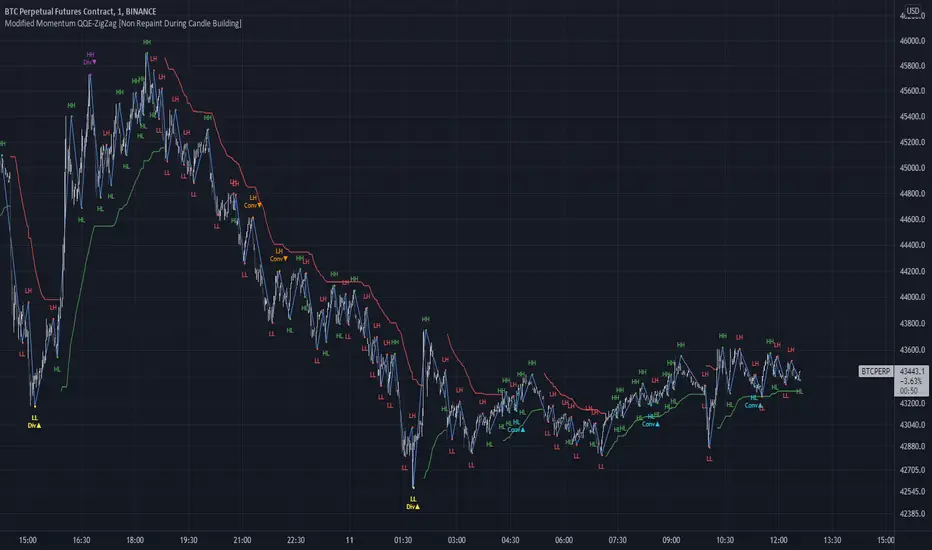
Modified QQE-ZigZag [Non Repaint During Candle Building]V V V V V V V Please Read V V V V V V V
I ask Peter and he is fine, that im published this script
Tell me if you have some ideas or criticism about that sricpt
>>>>>>>>>> This is a modified Version of Peter_O's Momentum Based ZigZag <<<<<<<<<<<
This is only a test, and i want to share it with the community
It works like other ZigZags
Because Peters_O's original Version is only non repaint on closed historical Data ,
during a Candle building process it can still repaint (signal appears / 21 seconds later signal disapears / 42 seconds later signal appears again in the same candle / etc.),
but that isnt important for backtesting, its only important for realtime PivotPoints during a candle.
My goal for this zigzag was to make it absolute non repaint neither during a candle building process (current candle),
so once the signal is shown there is no chance that it disapers and shown a few seconds later again on that same candle, it can only show up one time per candle an thats it,
and that makes it absolute non repaint in all time frames.
Credits to:
==> Thanks to @glaz , for bringing the QQE to Tradingview <3
==> Thanks to @Peter_O , for sharing his idea to use the QQE as base for a Zigzag
and for sharing his MTF RSI with the Community <3
Changes:
- I changed the MTF RSI a little bit, you can choose between two version
- I changed the QQE a little bit, its now using the MTF RSI , and its using High and Low values as Source to make it absolute non repaint during a candle is building
- I added a little Divergence Calculation beween price and the MTF RSI that is used for the ZigZag
Colors :
- Green for HH / HL Continuation
- Red for LL / LH Continuation
- Yellow for Positive Divergence
- Purple for Negative Divergence
Important:
It is not possible to backtest this script correctly with historical Data, its only possible in Realtime,
because the QQE is using crossunders with RSILowSource and the QQE Line to find the Tops and,
because the QQE is using crossovers with RSIHighSource and the QQE Line to find the Bottoms,
and that means it is not possible to find the correct Time/Moment when that crossovers / crossunders happens in historical Data
=============> So please be sure you understand the Calculation and Backtest it in Realtime when you want to use it,
because i didn't published this script for real trading
=============> Im not a financial advisor and youre using this script at your own risk
=============> Please do your own research
datsana V.1datsana ;
script uses analysis of :
- directional price movements ,
- strength / weakness of market,
- volatility
based on these indicators :
- DMI
- RSI & RSI div.
- Bollinger Bands
- Ehlers fisher transform
- DM
in order to find possible bullish / bearish reversals .
this script also uses a ‘deceleration’ system to filter reversal signals :
when a market is considered as too much volatile , then this ´deceleration system’ filters out all signals . ( you can turn off deceleration in the script settings )
you can also manage the ´deceleration density’ : the lower the deceleration density is , the more the filter be strict ( it will filter out more signals )
this indicators prints :
- RSI div. based support / resistance levels .
- bollinger bands
- ema199 / ema299 difference cloud
- liquidity gaps candles pattern ( ‘tkps’)
- possible reversal signals ( small arrows )
- filtered possible reversal signals ( triangles + ‘T’ or ‘B’ letters )
this script works better on low timeframes ( I recommend 15m to 1h TFs )

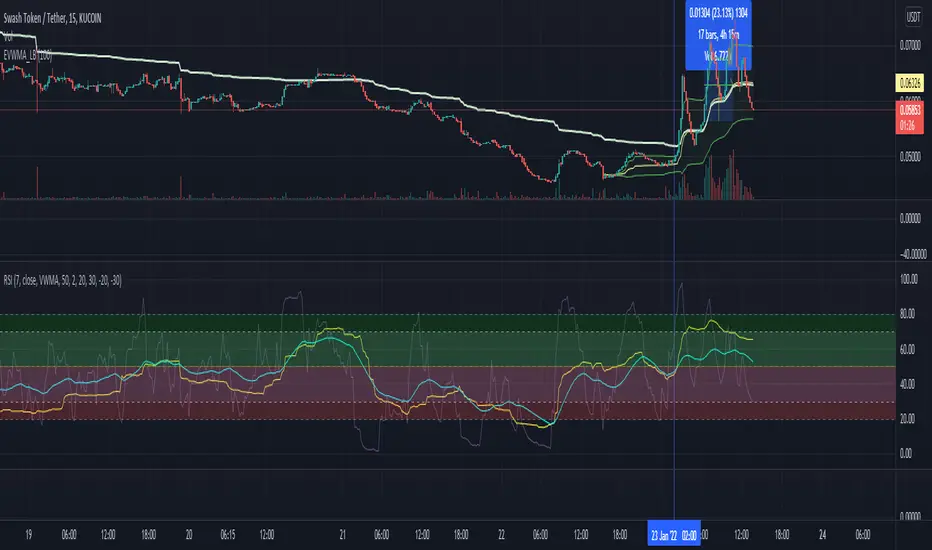
RSI v4 with Bands
Script is extended version of usual RSI script
This script plots VWMA(RSI7) vs EMA(RSI7) under pre-set time frame.
Strategy is to make sure both points remain in the Green zone while entering into BUY position
Use it as indicator not as financial advice.
~ @imbharat
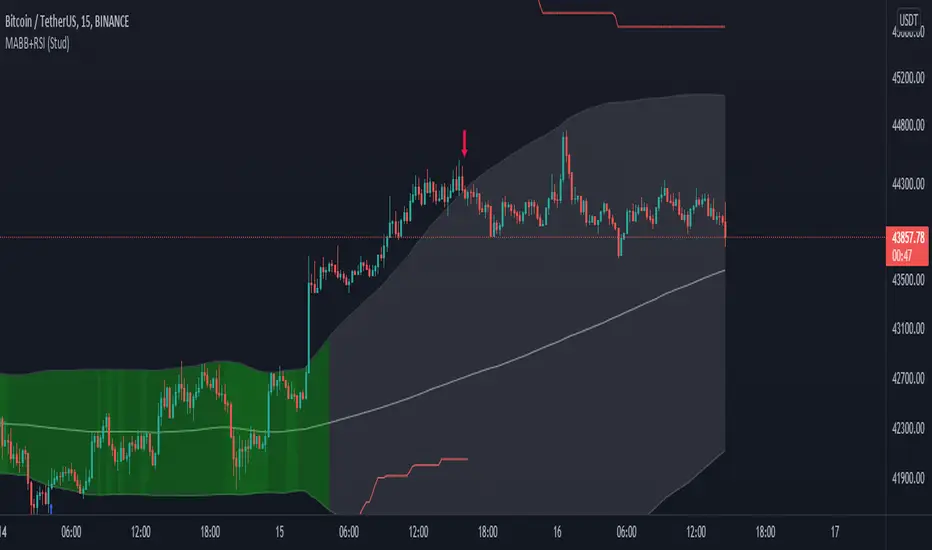
MA Bollinger Bands + RSI (Study)This study/indicator script is meant to allow users to set alerts based on my MA Bollinger Bands + RSI (Strategy).
Both Study and Strategy scripts reflect the exact same user inputs, parameters and trading signals.
6 different alerts available:
- MABB+RSI Long (or Short) Signal (all): activates for every single Long (or Short) signals
- MABB+RSI Long (or Short) Signal: activates when trade direction changes from Short to Long (or from Long to Short)
- MABB+RSI Long (or Short) Re-Entry Signal: after a stop loss was hit, activates upon same trade direction if new signal
(“Enable SL” & “Allow re-entry” must be switched on)
Chart legend:
- Red arrow = Short Signal
- Blue arrow = Long Signal
- Red square = Stop loss (when trade entry)
- Purple square = Stop loss (when hit)
NB1: Be sure to set both Study and Strategy script settings to the same values if you want to achieve similar results in both scripts.
NB2: When setting up your alerts, preferably use option “Once per bar close” to get proper confirmations.
Enjoy!
Relative Strength Index TOP and Bottom Circles with AlertsFind the top and bottom using the RSI, the red circle means overbought > 70 and the green circle means oversold < 30

Relative Strength Exponential Moving Average [CC]The Relative Strength Exponential Moving Average was created by Vitali Apirine (Stocks and Commodities Jan 2022 pgs 22-25) and this is a handy moving average that combines a typical overbought/oversold mechanic with an overall trend indicator. Even though the typical length is so large it reacts extremely quickly when the stock becomes overbought or oversold. Because of this the indicator by itself doesn't work as well during choppy periods so Vitali recommends using a moving average crossover system during choppy so do one indicator with the default length of 50 and use a different length of 10 so when the shorter length crosses over the longer length then buy and vice versa you would sell. Generally speaking buy when the line turns green and sell when it turns red. I have used strong buy and sell signals in addition to normal signals so strong signals are darker in color and normal signals are lighter in color.
Let me know if there are any other scripts or indicators you would like me to publish!

Buy / Sell alert indicator [Crypto_BCT]Hello everyone!
I bring to your attention a indicator to determine the point of buy and sell purchase.
It is based on oscillators and a moving average.
It can be used to work with bots, for example 3COMMAS DCA bot.
Signal Condition Settings:
ATR
The current candle is larger than the ATR for this period
EMA
The signal is necessarily below (for buy) and above (for sell) the EMA of the specified period
(Buy) RSI low
The RSI index is below this value
(Sell) RSI High
The RSI index is higher than this value
(Buy) MFI low
The MFI index is below this value
(Sell) MFI High
The MFI index is higher than this value
(Buy) CCI low
CCI index is below this value
(Sell) CCI High
The CCI index is higher than this value
(Buy) Lowest bar from
The closing of the current bar is lower than the closing of the bars back in this range
(Sell) Highest bar from
The closing of the current bar is higher than the closing of bars in this range
(Buy) Lowest EMA bar ago
During a given distance back, the EMA value only decreased
(Sell) Highest EMA bar ago
At a given distance back, the EMA value only increased
I hope it will be useful!

RSI StrategyThis RSI strategy will allow you to go long when RSI is overbought and go short when RSI is oversold. You can also change the checked boxes to reverse this. Uncheck "Overbought Go Long & Oversold Go Short" and check "Overbought Go Short & Oversold Go Long" to use this reversed option.
You can also choose to use an ema filter as an additional qualifier for entry. Uncheck "No EMA Filter" and check "Use EMA Filter" if you want to use it.
Be sure to enter slippage and commission into the properties to give you realistic results.
I've also built in backtesting date ranges and the ability to trade only within certain times of day and have it close all trades at the end of that time frame. This is especially useful for day trading stocks. To specify a time from use the format 0930-1100 or whatever your trading hours will be. Check off "Enable Close Trade At End Of Time Frame" to close the trade at the end of your trading hours.
You can also specify a % based take profit and stop loss. Also keep in mind that the way this code is designed if you use the stop loss and/or take profit and it reaches either target and closes, then it will immediately re-enter if the condition for long or short entry is true.
Finally there's custom alert fields so you can send custom alert messages for strategy entry and exit for use with automated trading services. Simply enter your messages in the fields within the strategy properties and then put {{strategy.order.alert_message}} in your alert message body and it will dynamically pull in the appropriate message.

Buy alert [Crypto_BCT]Hello everyone!
I bring to your attention a simple indicator to determine the point of purchase.
It is based on oscillators and a moving average.
It can be used to work with bots, for example 3COMMAS DCA bot.
Signal Condition Settings:
ATR
The current candle is larger than the ATR for this period
EMA
The signal is necessarily below the EMA of the specified period
MFI low
The MFI index is below this value
CCI low
CCI index is below this value
RSI low
The RSI index is below this value
Lowest bar from
The closing of the current bar is lower than the closing of the bars back in this range
Lowest EMA bar ago
During a given distance back, the EMA value only decreased
I hope it will be useful!
