[astropark] Renko OBV divergencesDear Followers,
today a new great Scalper Tool , based on Ob Balance Volume (OBV) oscillator, which works from 1 minute timeframe Renko chart , which is the best and more secure timeframe to use on a Renko chart. But of course it works great on all timeframes (included the 1D timeframe), both on FOREX and on Cryptocurrencies!
This tool has some cool features:
it works on all timeframes , starting from 1 minute: so you can enjoy high-frequency trading by using a 24/7 running bot and a proper money and risk management strategy
it shows you both bullish and bearish divergences with a triangle up or down respectively
when it finds a strong bullish/bearish divergence , a flag will be displayed instead of a triangle
This script will let you set all notifications you may need in order to be alerted on each triggered divergence.
You may like to use it together with my Renko Scalper V2
and my Renko RSI Divergences indicator
On Bitmex/ByBit/Binance Bitcoin/USD chart best settings is Traditional Renko chart with 10$ box size, while 0.5$ box size is suggested on Ethereum/USD pair.
This is a premium indicator , so send me a private message in order to get access to this script.
Renko

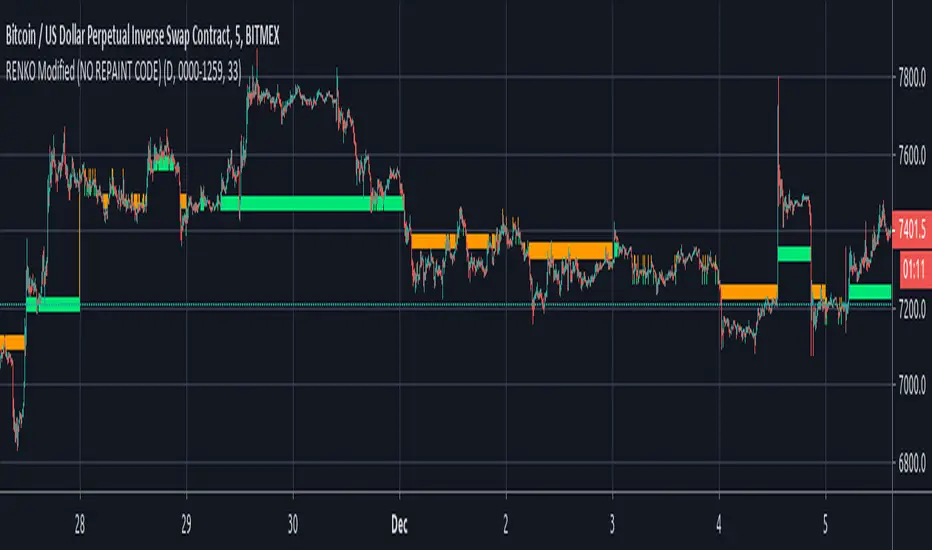
RENKO Modified (NO REPAINT CODE)I'm releasing this code in public Interest in hope of getting it improved by the community. If someone wants to use this code, then he/she should publish this code in Public Library with Open Source reference.
The code is entirely mine and not anyone else's.
I would love to see some imporvements to this code, so if you have any suggestions then let me know in the comments section and if someone can actually make it better than it would be great.
I'll share the logic for BUY and Sell upon agrreing on mutual terms.
As of this moment, the code simply plots Renko Bars, based on Daily Open.
I have added Daily close as an option in this, just in case someone wants it.
similarly you can call upon High and Low (for Obvious Reasons)
It CAN NOT REPAINT at all!!!!
[astropark] Renko RSI divergencesDear Followers,
today a new great Scalper Tool , which works excellent from 1 minute timeframe Renko chart , which is the best and more secure timeframe to use on a Renko chart. But of course it works great on all timeframes (included the 1D timeframe)!
This tool has some cool features:
it works on all timeframes , starting from 1 minute: so you can enjoy high-frequency trading by using a 24/7 running bot and a proper money and risk management strategy;
it shows you both bullish and bearish divergences with a triangle up or down respectively
when it finds a strong bullish/bearish divergence , a flag will be displayed instead of a triangle
This script will let you set all notifications you may need in order to be alerted on each triggered divergence.
You may like to use it together with my Renko Scalper V2
On Bitmex/ByBit/Binance Bitcoin/USD chart best settings is Traditional Renko chart with 10$ box size, while 0.5$ box size is suggested on Ethereum/USD pair.
This is a premium indicator , so send me a private message in order to get access to this script.

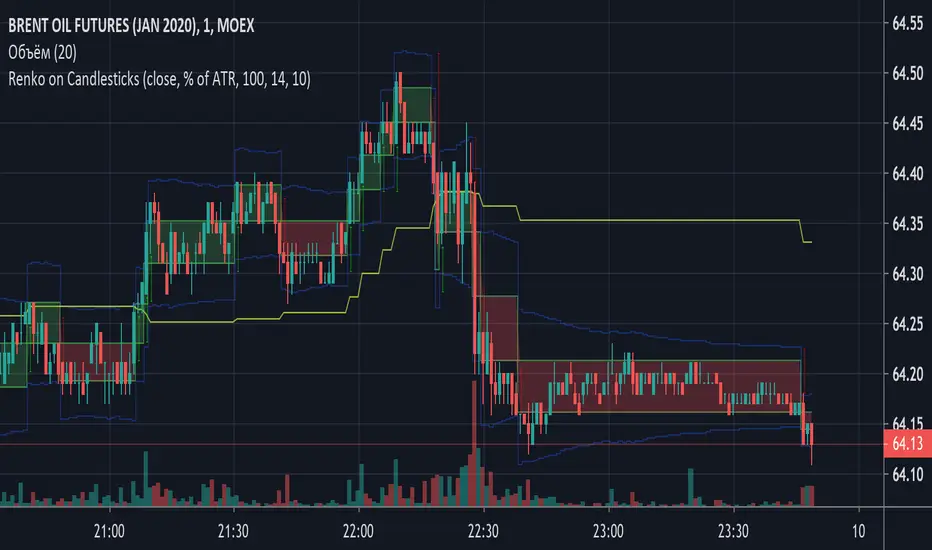
Renko on CandlesticksThis script drowse renkoboxes on top of candlesticks. This script does not repaint and can be used for alerts generation. If you add Renko to the same chart using security function it won't be the same (which seems to be a bug in TV). To check if my implementation is correct you can open Renko in a separate window and check timestamps.
Unlike standard implementation, when you use ATR based Renko bars, every box can have different size! The current ATR is applied after every bar. The standard implementation takes the current ATR value and applies it to the whole chart, so the chart may look totally different when you reload the page.
G-SIRPG-SIRP Has been Developed with One Idea in Mind... Automated Trading.
Just set it up and walk away.
It makes use of the noise cancelling power of our Re engineered Renko Candles on Traditional Settings.
Using Normal Code on Normal Renko will NOT work as the Candles will repaint thereby causing a Skewed backtest result.
This is Why G-SIRP is one of a kind as we have managed to find a solution to a Problem using Pine that is not currently available in any documentation on Pine.
We have incorporated Alot of Logic into the script to allow you to ride a trend successfully that includes a Trailing Stop Loss So that you are making sure that profit is being locked in.
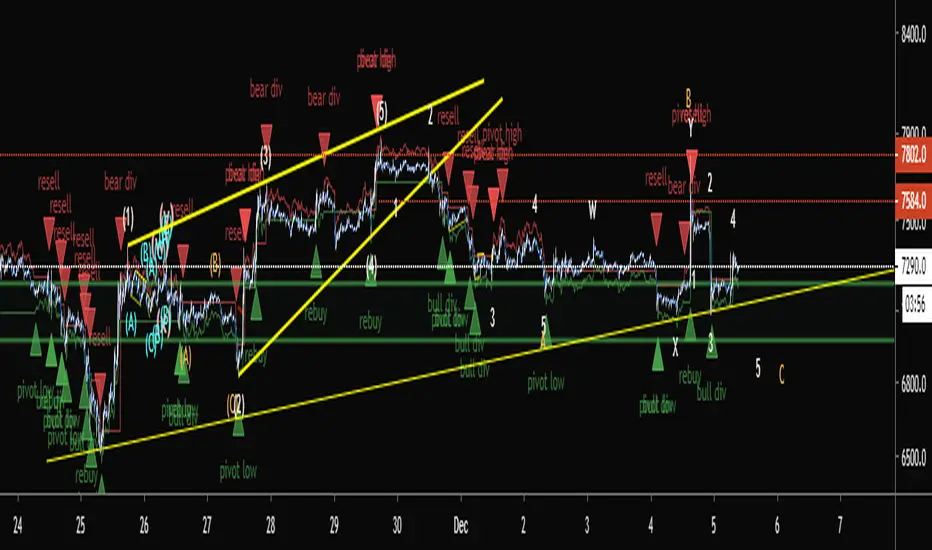
GODMODE reversal points Script shows reversal points on renko candles
Green shape = buy point
Red shape = sell point
Ema's works as support and resistance
Also ema's can be useful as a stoploss
Ema's available
55 = yellow
99 = aqua
Renko channel BREAK (alert)This is the Alert version for Renko channel BREAK.
Please use this script after research the Strategy version!!

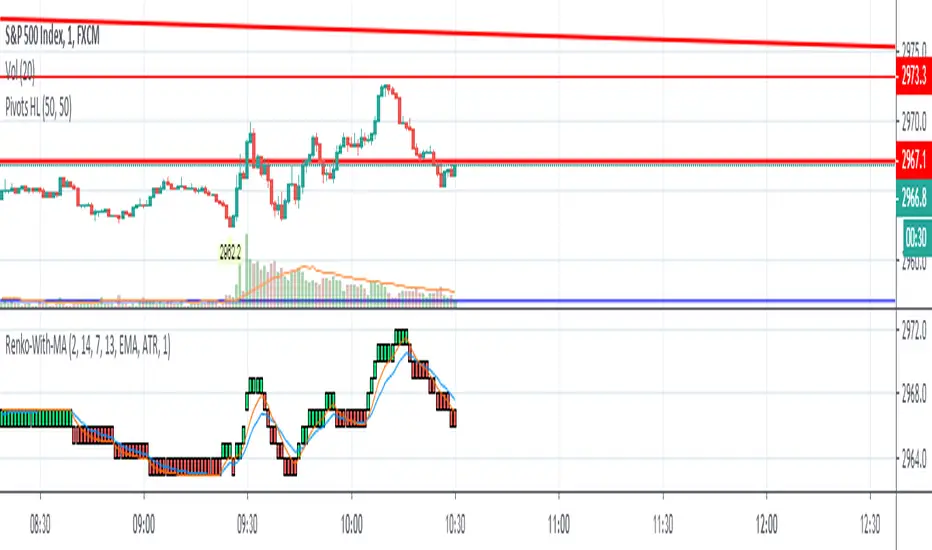
real Renko traditionalThis is traditional Renko chart that can overly conventional Candles chart.
Different from the original Renko chart provided by Tradingview (which is Repainting and Misleading ), this script does not use the SECURITY function so there is no Repainting!
//Inspired by backtrader
// github.com

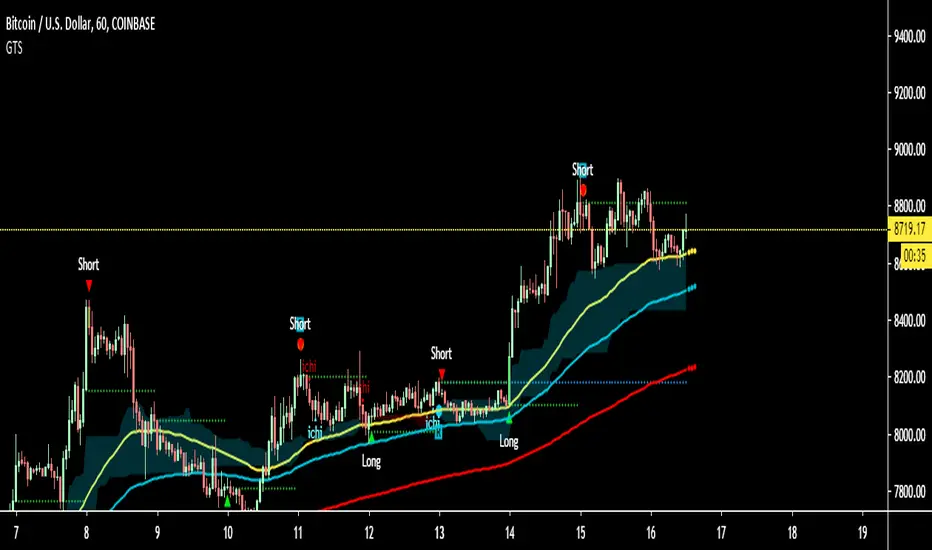
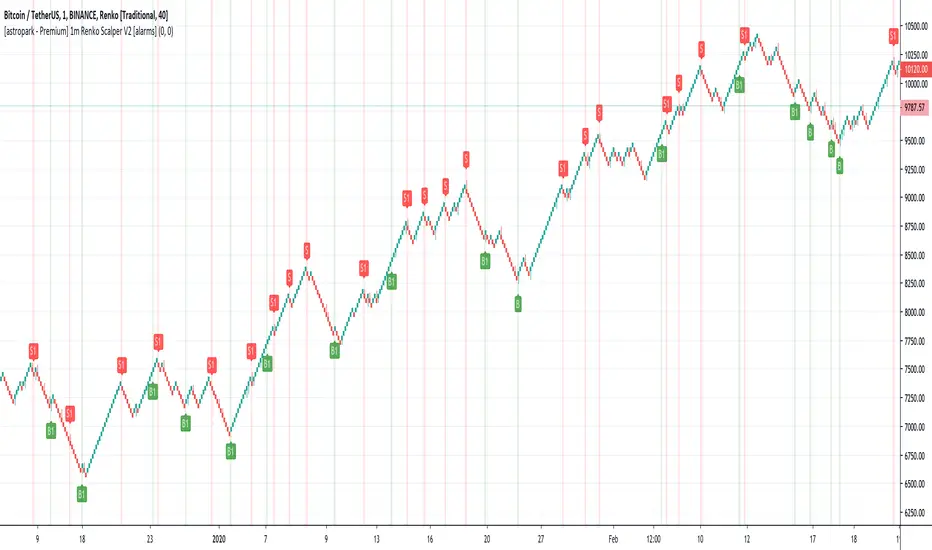
[astropark - Premium] 1m Renko Scalper V2 [alarms]Dear Followers,
today a new Scalper Tool , which works great on 1 minute timeframe , which is the best and more secure timeframe to use on a Renko chart, besides it works great up to 15m (I don't suggest to use a renko chart over 15m timeframe)!
It is an upgraded version of Bitmex Renko Scalper that you can find in my tradingview script page.
This tool has some cool features:
it works on 1 minute timeframe : so you can enjoy high-frequency trading by using a 24/7 running bot;
wait bricks optional mode : you may like to make script wait for triggering a new signal by waiting 1 or 2 more confirmation bricks
trailing stop : you can set a trailing stop in trade, so script will alert you if it will be reached in chart
This strategy can trigger till 5 buy or 5 sell signals in a row before reverting, so use a proper money management .
Strategy results are calculated on the timeframe from july to now, so on about 4 months, using 10000$ as initial capital and working at 3x leverage (very safe leverage!).
The user who wants to use this strategy, especially via an automated bot, must always set a stoploss at 5% from entry point or use a proper risk management strategy .
This is not the "Holy Grail", so use it with caution.
This script will let you set all notifications you may need in order to be alerted on each triggered signals.
The backtesting script version of this indicator, which will let you backtest this script and find best settings for your preferred market, can be found here below:
On Bitmex XBTUSD chart best settings is Traditional Renko chart with 10$ box size.
This is a premium indicator , so send me a private message in order to get access to this script .

Renko Dynamic Index ZonesThe goal of this indicator is to plot the Dynamic Index, Signal, and Histogram values "as if" the chart is a true price action based Renko chart. It can be used on a time series chart or Renko series chart. The Dynamic Index is derived from the raw price action of a time-based chart, where the historic and live price values are clustered into Renko bricks. The Renko brick production algorithm is entirely backed by Renko Overlay Ribbon and thoroughly tested. The Dynamic Index gets its inspiration from the Commodity Channel Index.
The algorithm takes into account rapid brick production within a single time candle and adjusts accordingly. The output may vary slightly between different chart time frames for the same indicator settings, but this is due to the lack of price fluctuation visibility that can occur in higher chart time frames. If the brick tick size is low, an appropriate chart interval should be selected that maximizes the amount of price volatility visible to the indicator. A bad setting would be something like a 1 tick EURUSD Renko setting on an H4 or Day chart, there simply is no way to derive the exact and ordered price fluctuations in a single candle, 1 pip at a time. A more appropriate chart time frame would be 1-5 minutes for this selected Renko brick size.
The difference between this indicator and the companion Renko Dynamic Index oscillator can be understood in the following video. The indicator plots the current Dynamic Index - Signal cross and Dynamic Index - Zero cross thresholds on the chart so that you know exactly where the most important crossing values are at all times. These can be used as a dynamic stop or a dynamic entry location for trades. The overbought and oversold dynamic zones are also plotted on the chart.
If you are interested in the RSI-RENKO DIVINE™ Strategy please have a look here:
Contact me in Trading View or telegram for more information and access instructions.

Use On Renko Chart - Cheap Entry Signals HI BIG PLAYERS,
in according of an enquiry from an user of tradingview I coded this script for free.
This script allows to identify a trend on the basis of higher high & higher low and lower high & lower low. And only after this fulfill conditions the entry signal comes out. The enquiry relates to Renko-charts, this is why it was build more usable on Renko-Charts.
In addition, it is possible to choise yourself the view of highest/lowest peaks and signals in the options.
Please give me a like to this indicator and of course: you are invited to follow me or visit my other scripts in relation to Wolfe Wave and Elliott Wave.
King regards
NXT2017

Renko MACD TrendThe goal of this indicator is to plot the MACD, Signal, and Histogram values "as if" the chart is a true price action based Renko chart. It can be used on a time series chart or Renko series chart. The MACD is derived from the raw price action of a time-based chart, where the historic and live price is clustered into Renko bricks. The Renko brick production algorithm is entirely backed by Renko Overlay Ribbon and thoroughly tested.
The algorithm takes into account rapid brick production within a single time candle and adjusts accordingly. The output may vary slightly between different chart time frames for the same indicator settings, but this is due to the lack of price fluctuation visibility that can occur in higher chart time frames. If the brick tick size is low, an appropriate chart interval should be selected that maximizes the amount of price volatility visible to the indicator. A bad setting would be something like a 1 tick EURUSD Renko setting on an H4 or Day chart, there simply is no way to derive the exact and ordered price fluctuations in a single candle, 1 pip at a time. A more appropriate chart time frame would be 1-5 minutes for this selected Renko brick size.
The difference between this indicator and the companion Renko MACD indicator can be understood in the following video. The indicator plots the current MACD - Signal cross and MACD - Zero cross thresholds on the chart so that you know exactly where the most important crossing values are at all times. This can be used as a dynamic stop or a dynamic entry location for trades.
If you are interested in the RSI-RENKO DIVINE Strategy please have a look here:
Contact me in Trading View or telegram for more information and access instructions.
Telegram: t.me
Daily Edge: www.daily-edge.com
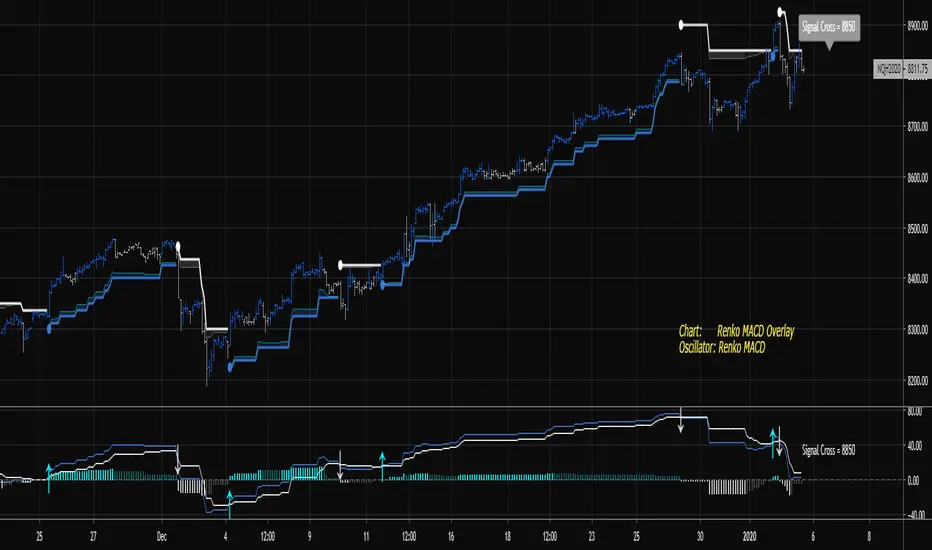
Renko MACDThe goal of this indicator is to plot the MACD, Signal, and Histogram values "as if" the chart is a true price action based Renko chart. It can be used on a time series chart or Renko series chart. The MACD is derived from the raw price action of a time-based chart, where the historic and live price is clustered into Renko bricks. The Renko brick production algorithm is entirely backed by Renko Overlay Ribbon and thoroughly tested.
The algorithm takes into account rapid brick production within a single time candle and adjusts accordingly. The output may vary slightly between different chart time frames for the same indicator settings, but this is due to the lack of price fluctuation visibility that can occur in higher chart time frames. If the brick tick size is low, an appropriate chart interval should be selected that maximizes the amount of price volatility visible to the indicator. A bad setting would be something like a 1 tick EURUSD Renko setting on an H4 or Day chart, there simply is no way to derive the exact and ordered price fluctuations in a single candle, 1 pip at a time. A more appropriate chart time frame would be 1-5 minutes for this selected Renko brick size.
Please find the following video introduction helpful for this indicator and the Renko MACD Trend indicator:
If you are interested in the RSI-RENKO DIVINE Strategy please have a look here:
Contact me in Trading View or telegram for more information and access instructions.
Telegram: t.me
Daily Edge: www.daily-edge.com


[RESEARCH] Chart Type IdentifierA viable and workable concept of chart type identification using Pine Script.
Was wollen wir trinken , sieben Tage lang
Was wollen wir trinken, so ein Durst!
Was wollen wir trinken, sieben Tage lang
Was wollen wir trinken, so ein Durst!

[RESEARCH] Renko Chart IdentifierDespite I am not a big fan of Renko I spent some time to solve a common problem of chart type identification using absolutely obvious technique: Renko bricks have the same size. That's all. Not a cutting-edge maths.
This tool allows to identify:
ATR Renko charts (see ^)
Traditional Renko charts
Here is example for Traditional Renko:
It also works correctly with other chart types:
Classic Candles
Heikin-Ashi
Kagi
PnF
Range Bars
Remember @everget !
And pay attention to the license before use)

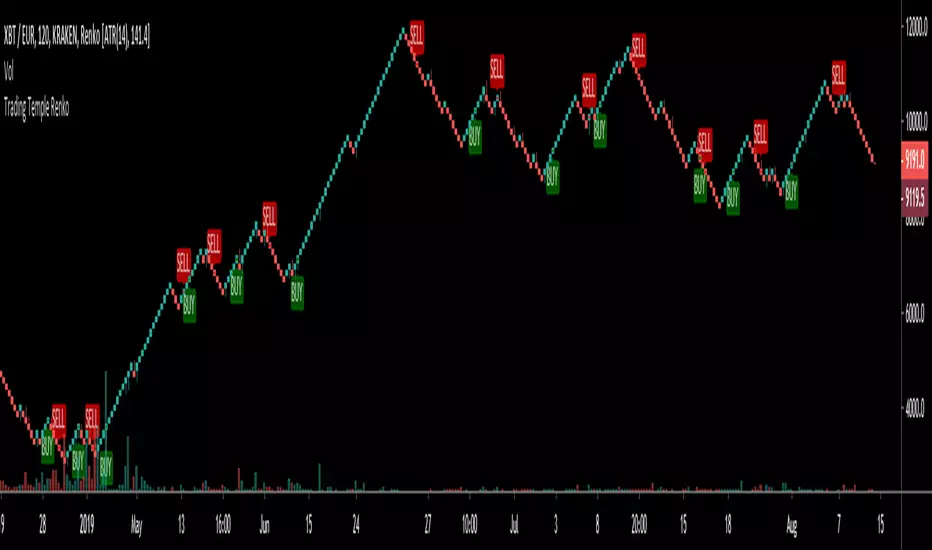
Trading Temple Trend Tracker Renko v1Trend Tracker to be used for trades following the current trend.
To be used with Renko bricks based on ATR and intraday charts (below 1D)
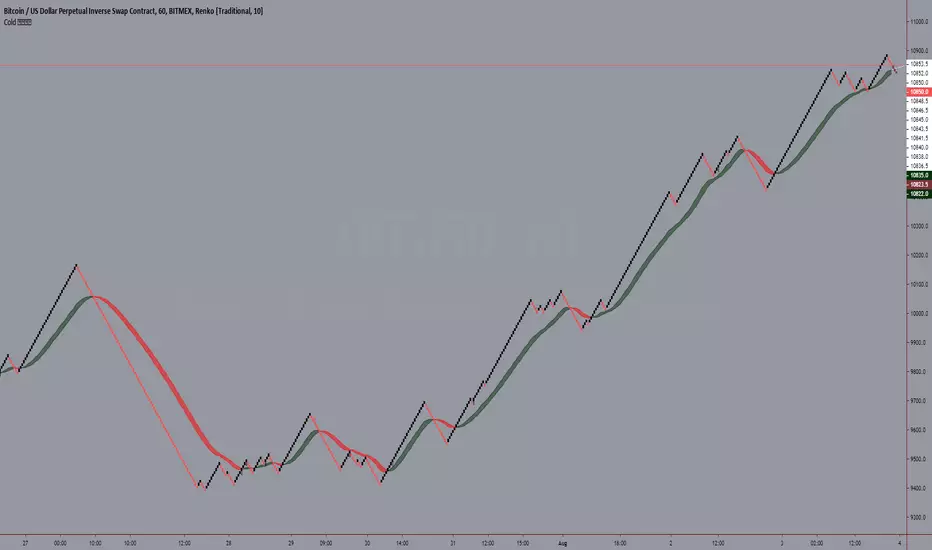
Cold 𝕃𝔼𝔾𝕆MA Ribbon
An Attempt For Smoother trend
Optional next candle forecaster for ma and its signal
Optional MA from coloring experimentation

Renko Overlay RibbonThis script has been moved to protected from this location
due to mishandling on multiple trading platforms. Since I have proprietary strategies built on this code, it has caused me to make it protected. This is not an Invite Only script anyone can use it, however the source code is no longer visible.
All calculations are performed against calculated Renko bricks form a price chart. The engine that drives this script is complex, but robust. It attempts to garner the order of nested Renko bricks inside a time candle when multiple bricks are produced. I call these "volatile bricks". In a normal Renko chart where tick data is used, this would be displayed as rapid brick production on the screen.
It is important to choose an appropriate time frame when in Traditional mode. Setting the ribbon to 1 pip on EURUSD using a Day chart is not wise, because there is no way to know just how many 1 pip bricks were produced and in which up/down sequence. ATR mode is different because the bricks are constantly changing in size, adapting to the current ATR of the chart time interval.
Please view these old videos taken from the original page for questions on why this indicator was created in the first place:
My strategy built on this indicator can be found here:
Multiple indicators based on renko bricks on time charts can be found here (they also work on renko charts in Trading View). These are special scripts that use this indicator as the engine to generate indicators "as if" you were operating on a Renko chart.
PM for questions, enjoy.

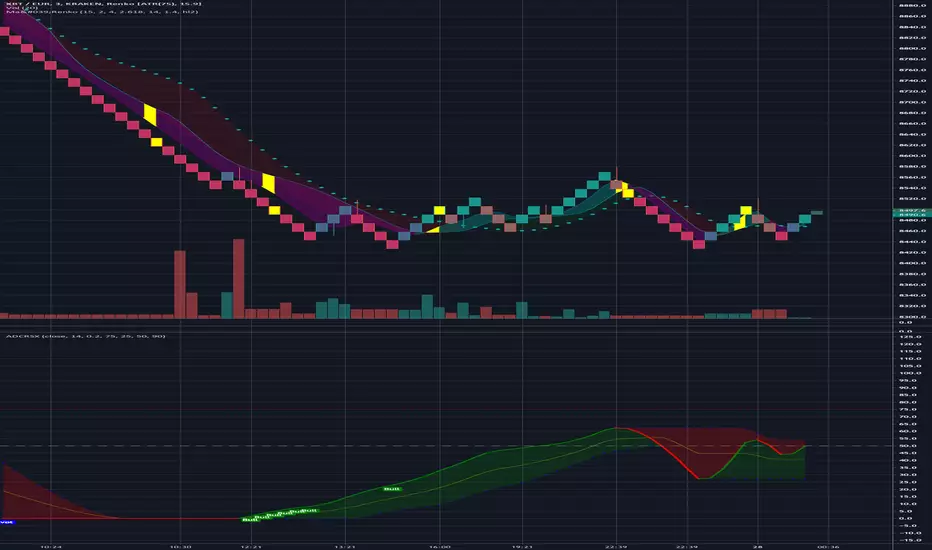
Ma'RenkoMa'Renko is simple, yet powerful trading system designed to help scalpers who use Renko charts (including ATR-based, but it should work with any type of candles as well). The thickness of color bands represents different trend characteristics (mostly volume and speed of price changing) which allow a trader to filter out false pivot points, enter and exit more wisely. The chart speaks for itself.