ProfitTrailer Example TradingView Signals [v2019-01-31]ProfitTrailer Example TradingView Signal
This script provides an example of a TradingView Signal for use with ProfitTrailer's
new SIGNALS functionality and it's new TradingView integration capability.
This signals script implements a simple Moving Average Cross strategy
that works on any chart timeframe.
It allows you to pick the Price source i.e. Open, Close (default), etc.
You are able to choose between EMA (default) or SMA moving average
calculations.
You can define the fast and slow period lengths for use within the
moving average calculations.
If you get some value out of this indicator please consider making
a small donation to my favourite charity the Save the Childrens Fund.
Every donation will make a difference to the lives of children.
All donations over $2 are tax deductable. You can donate here:
savethechildrenfundraising.org.au
Copyright (c) 2019, Grant Cause aka CryptoCoyns
Signal

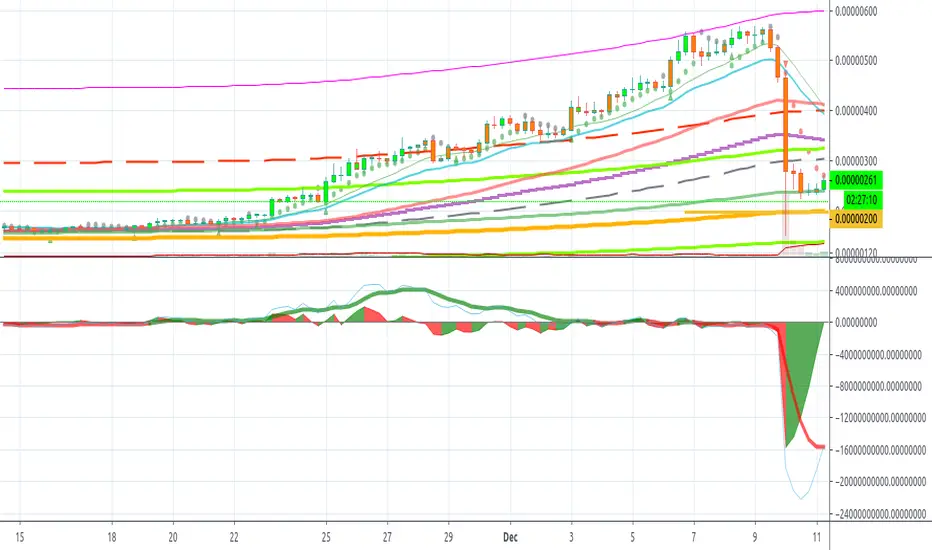
Volume ImpactVolume Impact (The area)
Average Volume (The thick line, xTrigger)
Volume Impact = Volume Chance - Average Volume
It provides very reliable buy sell signals. Buy(green) when increasing, sell(red) when decreasing. Volume Impact might drop before the actual price so it has an early warning potential.
Before trend changes volume average diverges from the prices. It moves reverse to the prices.
Also before trend changes, volume impact peaks diverges from price peaks. So you know a big drop is coming.
Klinger Volume Oscillator inspired this indicator... This data is there but it is more difficult to interpret.
In summary, you can foresee trend changes.
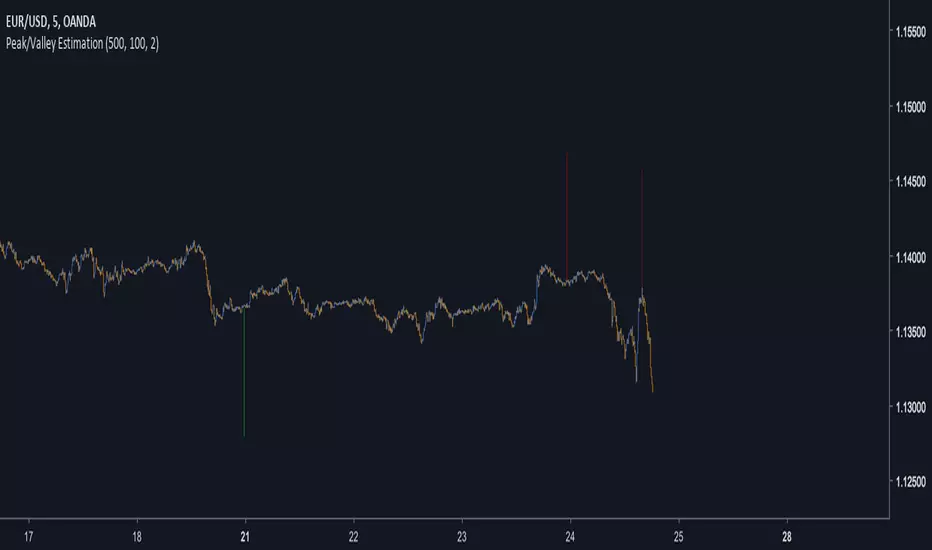
Peak/Valley EstimationEarly Signal
Estimating the Peaks and Valleys or extrema of the price is one of the best way to catch up early movements of a trend. Of course there is no perfect way to do so, if we want a perfect estimation of peaks and valleys then we must use a non causal indicator ( repainting ), if we want a causal indicator ( non repainting ) then we will need to tradeoff accuracy for allowing our indicator to be causal, its always a matter of tradeoff at the end when trying to have a desired effect (smoothness/lag for filters) .Our indicator is causal, it wont repaint but the accuracy will depend on various parameters.
In order to detect peaks and valleys in a certain period we must detrend the price, this mean subtracting it by its moving average. We take the absolute value of this result and we filter it with a local linear regression ( LSMA ) in order to eliminate noise, then we make the assumption that the highest of our result is or a peak or a valley of the price, so we divide our detrended calculation by its highest and we get a scaled result. Lets call this final result the peak index .
Parameters
There are 3 parameters in this indicator, a length parameter who control the period of the highest mentioned above, a smooth parameter who smooth our detrended price, and finally a mod parameter who select the trigger method for estimating a peak/valley.
Here are how mods work :
mod = 1 : when the peak index is equal to 1 and the previous value is not equal to 1 then we have a peak/valley. Its the fastest of the 3 mods but the one with less accuracy.
mod = 2 : when the peak index crossunder 0.8 then we have a peak/valley. This method is more robust but slower than the previous one.
mod = 3 : when the peak index is not equal to 1 and the previous peak index is equal to 1 then we have a peak/valley. Its an average of the precedents mod in term of speed and accuracy.
Lower length values tend to estimate the peak/valley of short periods of time but can also lead to the reverse desired effect ( breakouts signals ). Smoothing is important since it reduce the number of noise in our calculation and therefore help to get better results, its a parameter that should be high, sometimes higher than length if this one is low.
Estimation of medium terms peaks/valleys with length and smooth parameter both period 100 and mod = 3
Estimation peaks in palladium way to early, an example of bad accuracy. Such behaviour can be fixed with a change in the parameters.
Complementarity With Classics Indicators
As i said before its always a matter of tradeoff, here we get faster signals but we loose in accuracy, at the contrary classics indicators often have slower signals but with more accuracy. Mixing both of them can provide additional robustness in a strategy, lets take back our palladium case, using mod 3 could have been better, but its still not optimal, so lets use a classic indicator such as a moving average of period 200, our conditions are :
Long when our peak/valley estimator estimated a valley and the price crossover our moving average.
Short when our peak/valley estimator estimated a peak and the price crossunder our moving average.
here is an exemple of such signal :
We balanced our tradeoff in a way to fix both methods problems, of course its still not a perfect fix but it provide more robustness.
Other Uses
The indicator can also be used only as an order closing indicator, its safer than taking a position based on its estimation. The indicator can also give a use to the peak index used in the calculation as a trend strength indicator.
Values below 0.5 indicate a ranging market while values over 0.5 indicate a trending market.Since its a scaled measure you can use it a smoothing constant in a adaptive filter.
Conclusions
I showed how to estimate peaks and valleys and how to use such information in order to make better decision when using classical indicators, of course at the end nothing is perfect and considering the non stationarity of the markets the parameters efficiency could change drastically.
For any questions/demands feel free to pm me, i would be happy to help you
pooya ATRthis is modified ATR for signal strength test
with custom ATR in multi time chart
comment your opinion...

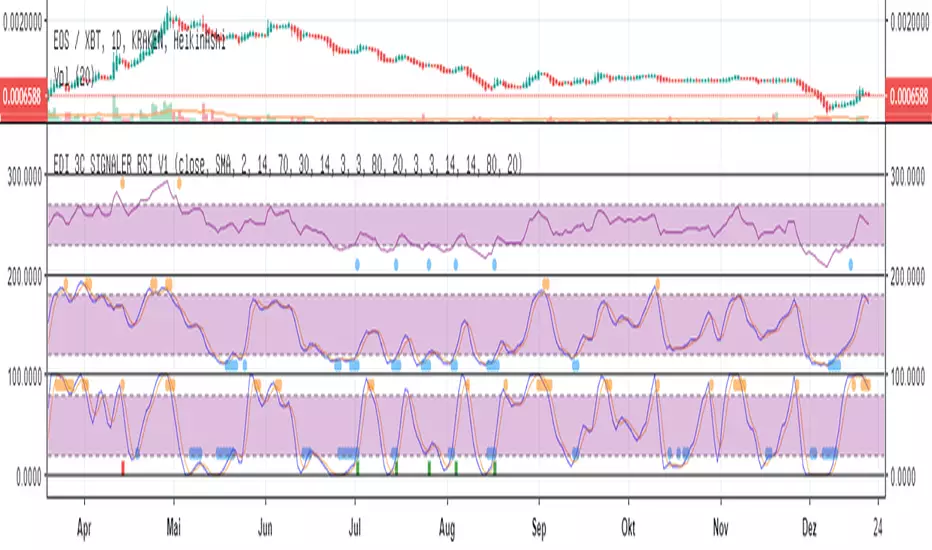
Eds Bot Signaler on Basis of RSI Stoch StochRSIEDS AWESOME BOT SIGNALER
Specially for use with e.g. 3commas or autoview
But can also be used just in normal manual (visual) mode
This Script is very early Beta. Works for visual manual use....
and also for 3Commas Bot as "Signaler" (how to connect with Bot, see the docu on 3commas).
... but can use as Signaler for any Bot who is able to get Tradingview sms-mails. (e.g. autoview)
It combines RSI, Stoch and Stoch-RSI.
You can choose normal RSI, or " returning RSI " (signals when leaving the sell/buy-zone. much higher profits with this)
You can choose how many of the indicators are needed to "fire".
You can choose if one of the indicators is a "must"
For Stoch & Stoch-RSI you can Choose sma or ema calculations of the moving average.
All the Values speak for themselves, if you are used to technical analyses (stay away in the moment, if you dont know, what rsi, stoch etc is used.
The Signals are also shown in the chart, the single ones, but also the combined which fires the Bot-Signal (shown as green and red column-candle at bottom)
Enjoy !! Free use in the moment.
More detailled Explanation in the future. Just play around!
If you wanna give something back:
BTC: 15buigKjh4JYnuVwcEWiYMpYvP3Lbp4ypL
Renko Strategy Open_CloseSimple Renko strategy, very profitable. Thanks to vacalo69 for the idea.
Rules when the strategy opens order at market as follows:
- Buy when previous brick (-1) was bearish and previous brick (-2) was bearish too and actual brick close is bullish
- Sell when previous brick (-1) was bullish and previous brick (-2) was bullish too and actual brick close is bearish
Rules when the strategy send stop order are the same but this time a stop buy or stop sell is placed (better overall results).
Note that strategy open an order only after that condition is met, at the beginning of next candle, so the actual close is not the actual price.
Only input is the brick size multiplier for stop loss and take profit: SL and TP are placed at (brick size)x(multiplier) Or put it very high if you want startegy to close order on opposite signal.
Adjust brick size considering:
- Strategy works well if there are three or more consecutive bricks of same "color"
- Expected Profit
- Drawdown
- Time on trade
This strategy uses Renko charts with TRADITIONAL bricks, so no repaint.
Study with alerts, MT4 expert advisor and jforex automatic strategy are available at request.
Please use comment section for any feedback.

Negative Volume IndexHello traders!
This indicator was originally developed by Paul L. Dysart in the 1930s and then described and popularized by Norman G. Fosback in his book "Stock Market Logic: A Sophisticated Approach to Profits on Wall Street" .
Like and follow for more cool indicators!
Happy Trading!

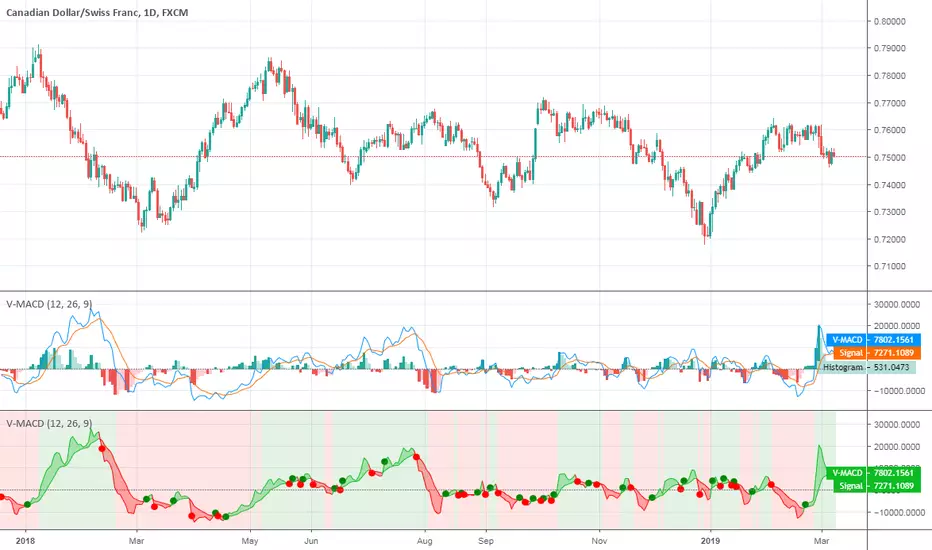
V-MACDHello traders!
This is a variation of classical MACD that uses volume instead of price.
Like and follow for more cool indicators!
Happy Trading!
VW-MACDHello traders!
I am reading "Investing with Volume Analysis: Identify, Follow, and Profit from Trends" by Buff Pelz Dormeier so I am going to implement all indicators that are considered there.
VW-MACD was developed by Buff Pelz Dormeier in 2000 and is based on the difference between a short-term volume-weighted moving average and a long-term volume-weighted moving average. The signal line is traditionally left as an exponential moving average.
Like and follow for more cool indicators!
Happy Trading!

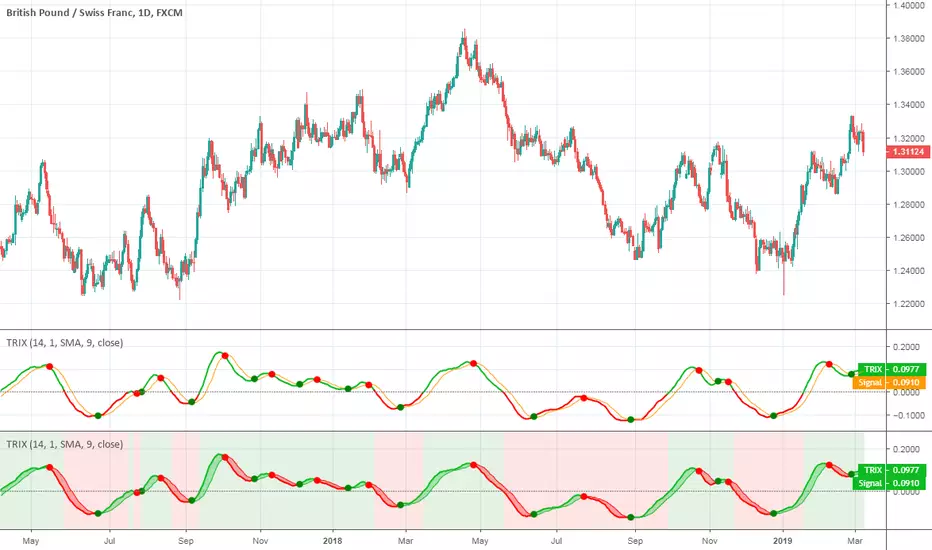
TRIXThis indicator was originally developed by Jack K. Hutson (Stocks & Commodities (July 1983): "Good TRIX").
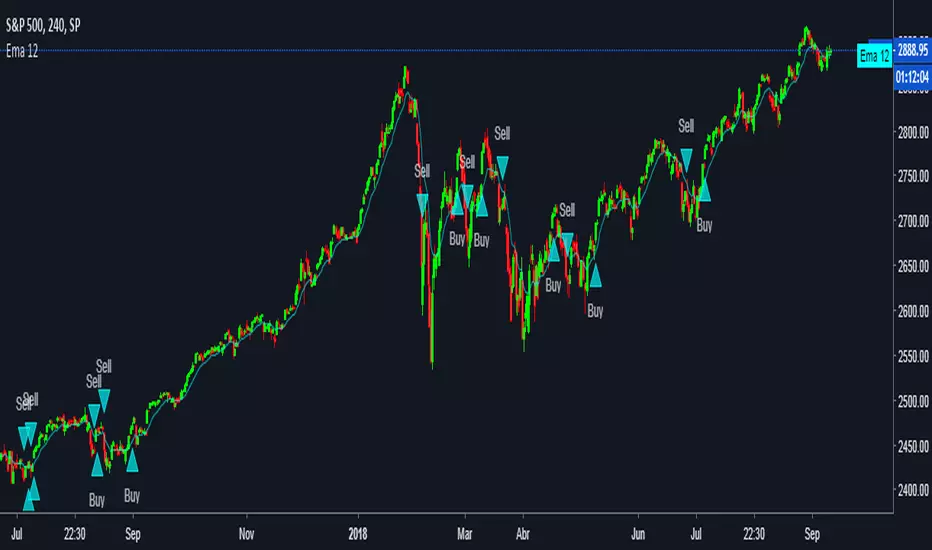
EMA fasterDraw EMA(12) and put a signal when EMA(12) cross with EMA(50).
EMA(50) is not rendered on the canvas.
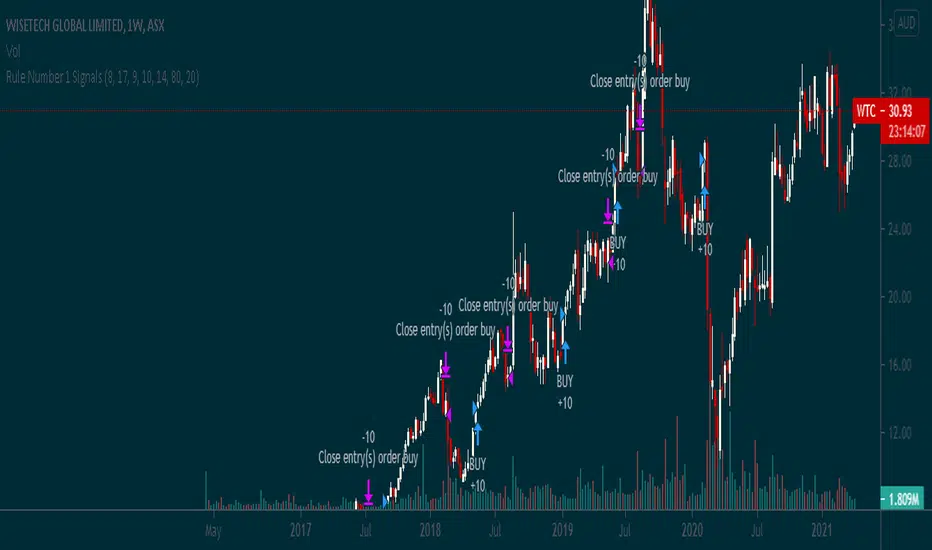
Rule Number 1 SignalsThis script takes the Rule #1 3 tools and plots them on the graph, to provide an additional level of indication for when to sell and when to buy.
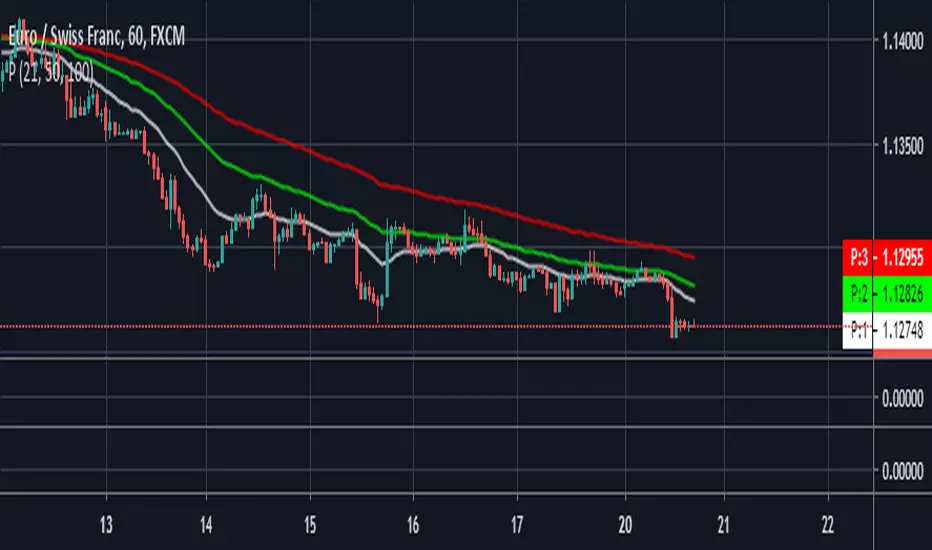
Triple EMA-by pooyaPublished by POOYAMONTOYA
This is a triple moving average with optional inputs in one oscillator
For more information and use our platform please contact us

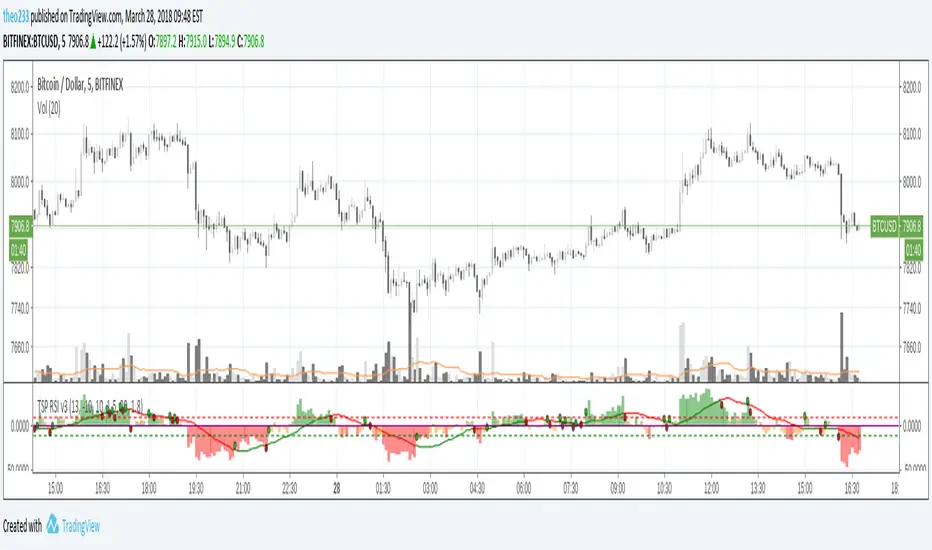
TSP Sexy RSIThe Sexiest RSI in Town !
- Range zone are indicated with lower colors
- MA 10 cross signals
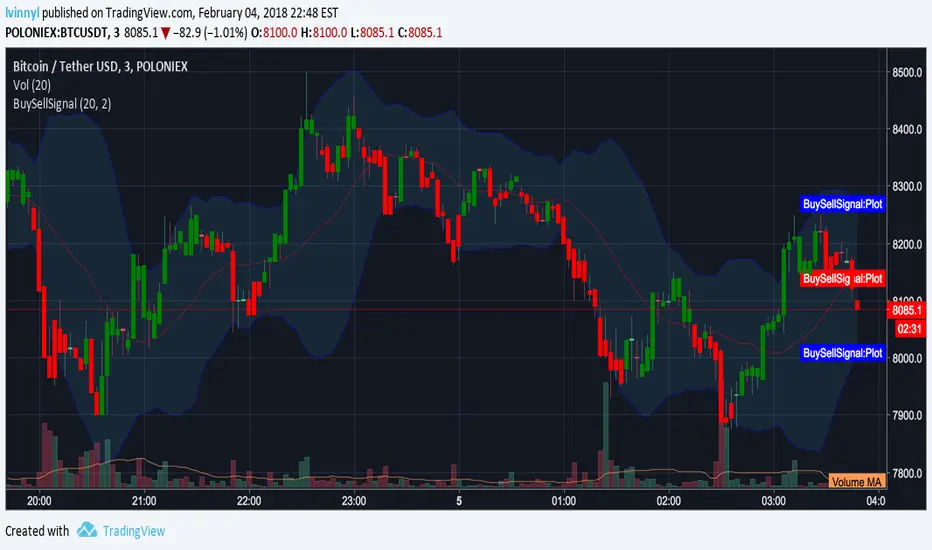
GreenRedSignal with Alerts by lvinnyl// Script created by JoinFree
// Modified by lvinnyl to trigger alerts
// Click on image below for original script...
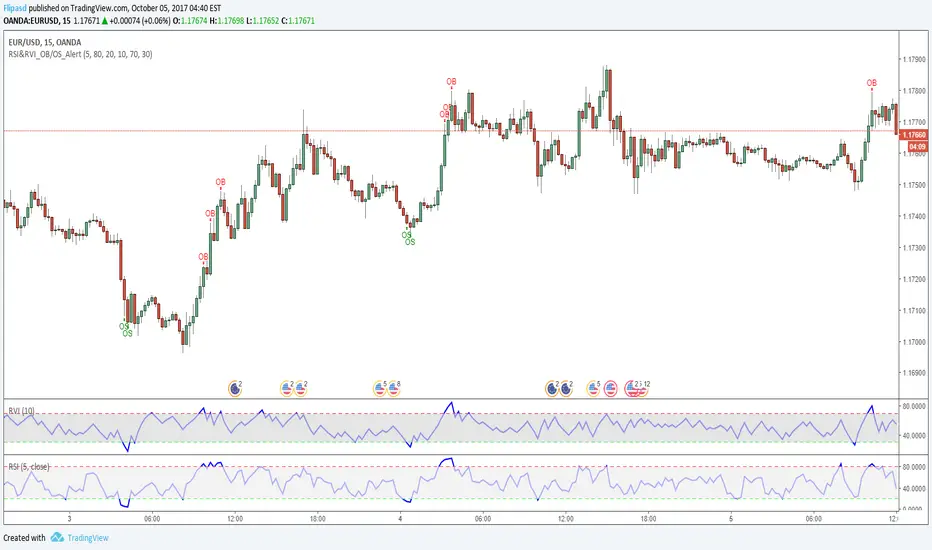
RSI & RVI OB/OS Alert ArrowThe script shows arrows on bars that are in overbought or oversold, based on the set parameters of Relative Strength Index ( RSI ) and Relative Volatility Index (RVI).
Also there is a universal allert, which includes both conditions - overbought and oversold.
You can change the period of RSI and RVI, as well as the upper and lower boundaries of these indicators.
RSI DivergenceRSI DIVERGENCE is a difference between a fast and a slow RSI. Default values are 5 for the fast one and 14 for the slow one.
You can use this indicator in 2 different ways:
normal RSI : check double or triple top/bottom on a chart meanwhile RSI is descending/ascending (check the example on chart)
signal line : when RSI Divergence cross zero line from bottom to top you get a buy signal (the line become green), vice versa when the RSI Divergence cross zero line in the opposite way you get a sell signal (the line become red)


Stochastic Momentum Index (SMI)Stochastic Momentum Index (SMI) or Stoch MTM is used to find oversold and overbought zones. It also helps to figureout whether to enter short trade or long trade.
Red Shade in the Top indicates that the stock is oversold and the Green shade in the bottom indicates overbought.
Strategy:
Enter Long once the Overbought Zone ended and there's a crossover below -35.
Exit Long once the oversold zone is ended and there's a crossover.
Enter Short once the oversold zone is ended and there's a crossover above 35.
Exit Short once the Overbought Zone ended and there's a crossover.
Backup: Always use with another indicator because there will be multiple up and down movement in one Trend.

Doji signalsYou can create an alert based on this signal :)
Works on standard and Heikin-ashi candles
You can also adjust the sensitivity (how big you want the body of the doji)
:)


MULTIPLE TIME-FRAME STRATEGY(TREND, MOMENTUM, ENTRY) Hey everyone, this is one strategy that I have found profitable over time. It is a multiple time frame strategy that utilizes 3 time-frames. Highest time-frame is the trend, medium time-frame is the momentum and short time-frame is the entry point.
Long Term:
- If closed candle is above entry then we are looking for longs, otherwise we are looking for shorts
Medium Term:
- If Stoch SmoothK is above or below SmoothK and the momentum matches long term trend then we look for entries.
Short Term:
- If a moving average crossover(long)/crossunder(short) occurs then place a trade in the direction of the trend.
Close Trade:
- Trade is closed when the Medium term SmoothK Crosses under/above SmoothD.
You can mess with the settings to get the best Profit Factor / Percent Profit that matches your plan.
Best of luck!
