Expected Range and SkewThis is an open source and updated version of my previous "Confidence Interval" script. This script provides you with the expected range over a given time period in the future and the skew of that range. For example, if you wanted to know the expected 1 standard deviation range of MSFT over the next 20 days, this will tell you that. Additionally, this script will also tell you the skew of the expected range.
How to use this script:
1) Enter the length, this will determine the number of data points used in the calculation of the expected range.
2) Enter the amount of time you want projected forward in minutes, hours, and days.
3) Input standard deviation of the expected range.
4) Pick the type of data you want shown from the dropdown menu. Your choices are either the expected range or the skew of the expected range.
5) Enter the x and y coordinates of the label (optional). This is useful so it doesn't impede your view of the plot.
Here are a few notes about this script:
First, the expected range line gives you the width of said range (upper bound - lower bound), and the label will tell you specifically what the upper and lower bounds of the expected range are.
Second, this script will work on any of the default timeframes, but you need to be careful with how far out you try to project the expected range depending on the timeframe you're using. For example, if you're using the 1min timeframe, it probably won't do you any good trying to project the expected range over the next 20 days; or if you're using the daily timeframe it doesn't make sense to try to project the expected range for the next 5 hours. You can tell if the time horizon you're trying to project doesn't work well with the chart timeframe you're using if the current price is outside of either the upper or lower bounds provided in the label. If the current price is within the upper and lower bounds provided in the label, then the time horizon that you're projecting over is reasonable for the chart timeframe you're using.
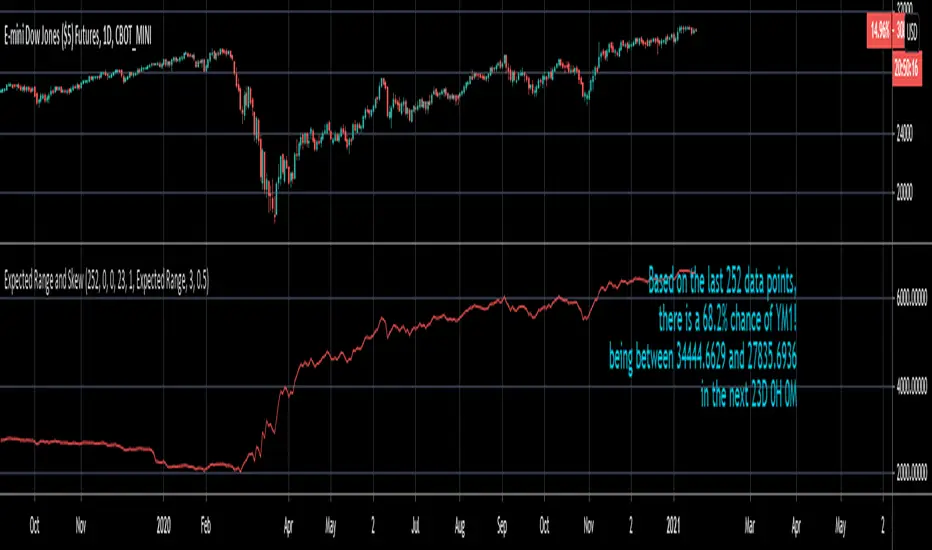
Third, this script does not countdown automatically, so the time provided in the label will stay the same. For example, in the picture above, the expected range of Dow Futures over the next 23 days from January 12th, 2021 is calculated. But when tomorrow comes it won't count down to 22 days, instead it will show the range over the next 23 days from January 13th, 2021. So if you want the time horizon to change as time goes on you will have to update this yourself manually.
Lastly, if you try to set an alert on this script, you will get a warning about it possibly repainting. This is because of the label, not the plot itself. The label constantly updates itself, which triggers the warning. I tested setting alerts on this script both with and without the inclusion of the label, and without the label the repainting warning did not occur. So remember, if you set an alert on this script you will get a warning about it possibly repainting, but this is because of the label constantly updating, not the plot itself.
SKEW
Implied Volatility SuiteThis is an updated, more robust, and open source version of my 2 previous scripts : "Implied Volatility Rank & Model-Free IVR" and "IV Rank & IV Percentile".
This specific script provides you with 4 different types of volatility data: 1)Implied volatility, 2) Implied Volatility Rank, 3)Implied Volatility Percentile, 4)Skew Index.
1) Implied Volatility is the market's forecast of a likely movement, usually 1 standard deviation, in a securities price.
2) Implied Volatility Rank, ranks IV in relation to its high and low over a certain period of time. For example if over the past year IV had a high of 20% and a low of 10% and is currently 15%; the IV rank would be 50%, as 15 is 50% of the way between 10 & 20. IV Rank is mean reverting, meaning when IV Rank is high (green) it is assumed that future volatility will decrease; while if IV rank is low (red) it is assumed that future volatility will increase.
3) Implied Volatility Percentile ranks IV in relation to how many previous IV data points are less than the current value. For example if over the last 5 periods Implied volatility was 10%,12%,13%,14%,20%; and the current implied volatility is 15%, the IV percentile would be 80% as 4 out of the 5 previous IV values are below the current IV of 15%. IV Percentile is mean reverting, meaning when IV Percentile is high (green) it is assumed that future volatility will decrease; while if IV percentile is low (red) it is assumed that future volatility will increase. IV Percentile is more robust than IV Rank because, unlike IV Rank which only looks at the previous highs and lows, IV Percentile looks at all data points over the specified time period.
4)The skew index is an index I made that looks at volatility skew. Volatility Skew compares implied volatility of options with downside strikes versus upside strikes. If downside strikes have higher IV than upside strikes there is negative volatility skew. If upside strikes have higher IV than downside strikes then there is positive volatility skew. Typically, markets have a negative volatility skew, this has been the case since Black Monday in 1987. All negative skew means is that projected option contract prices tend to go down over time regardless of market conditions.
Additionally, this script provides two ways to calculate the 4 data types above: a)Model-Based and b)VixFix.
a) The Model-Based version calculates the four data types based on a model that projects future volatility. The reason that you would use this version is because it is what is most commonly used to calculate IV, IV Rank, IV Percentile, and Skew; and is closest to real world IV values. This version is what is referred to when people normally refer to IV. Additionally, the model version of IV, Rank, Percentile, and Skew are directionless.
b) The VixFix version calculates the four data types based on the VixFix calculation. The reason that you would use this version is because it is based on past price data as opposed to a model, and as such is more sensitive to price action. Additionally, because the VixFix is meant to replicate the VIX Index (except it can be applied to any asset) it, just like the real VIX, does have a directional element to it. Because of this, VixFix IV, Rank, and Percentile tend to increase as markets move down, and decrease as markets move up. VixFix skew, on the other hand, is directionless.
How to use this suite of tools:
1st. Pick the way you want your data calculated: either Model-Based or VixFix.
2nd. Input the various length parameters according to their labels:
If you're using the model-based version and are trading options input your time til expiry, including weekends and holidays. You can do so in terms of days, hours, and minutes. If you're using the model-based version but aren't trading options you can just use the default input of 365 days.
If you're using the VixFix version, input how many periods of data you want included in the calculation, this is labeled as "VixFix length". The default value used in this script is 252.
3rd. Finally, pick which data you want displayed from the dropdown menu: Implied Volatility, IV Rank, IV Percentile, or Volatility Skew Index.

Volatility SkewThis indicator measure the historical skew of actual volatility for an individual security. It measure the volatility of up moves versus down moves over the period and gives a ratio. When the indicator is greater than one, it indicators that volatility is greater to the upside, when it is below 1 it indicates that volatility is skewed to the downside.
This is not comparable to the SKEW index, since that measures the implied volatility across option strikes, rather than using historical volatility.
Skew Index Rank-Buschi
English:
a quick and simple tampering with the SKEW Index (also known as the "Black Swan Index")
Personally, I find it quite difficult to use the SKEW Index as a reliable indicator. Nevertheless I implemented a ranking system (from 0 to 100) with the option to include a certain time period (default: 252 trading days (units)) and a moving average (default: 21 days (units)).
Feedback is most welcome to modify / improve the script.
Deutsch:
eine schnelle und einfache Bearbeitung des SKEW Index (auch als "Schwarzer Schwan Index" bekannt)
Persönlich finde ich es recht schwierig, den SKEW Index als verlässlichen Indikator zu verwenden. Trotzdem habe ich hier einfach einmal ein Ranking-System (von 0 bis 100) aufgesetzt mit der Option, einen gewissen Zeitrahmen (Standardwert: 252 Handelstage (Einheiten)) und einen gleitenden Durchschnitt (Standardwert: 21 Tage (Einheiten)) einzubinden.
Feedback ist sehr willkommen, um das Skript zu überarbeiten / zu verbessern.

Rolling Skew (Returns) - Beasley SavageSkewness is a term in statistics used to describe asymmetry from the normal distribution in a set of statistical data. Skewness can come in the form of negative skewness or positive skewness, depending on whether data points are skewed to the left and negative, or to the right and positive of the data average. A dataset that shows this characteristic differs from a normal bell curve.
