(JS)S&P 500 Volatility Oscillator For Options 2.0I am going to start taking requests to open source my indicators and they will also be updated to Version 4 of Pinescript.
I added some features to the original code such the ability to smooth the oscillator and select the look back periods for the historical volatility.
Link to original:
Original post:
"The idea for this started here: www.tradingview.com with the user @dime
This should only be used on SPX or SPY (though you could use it on other things for correlation I suppose) given that the instrument used to create this calculation is derived from the S&P 500 (thank you VIX ). There's a lot of moving parts here though, so allow me to explain...
First: The main signal is when Implied Volatility (from VIX ) drops beneath Historical Volatility - which is what you want to see so you aren't purchasing a ton of premium on long options. Green and above 0 means that IV% has dropped lower than Historical Volatility . (this signal, for example, would suggest using a Long Call or Put depending on your sentiment)
Second: The green line running underneath zero is the bottom portion of the "Average True Range" derived from the values used to create the oscillator. the closer the bottom histogram is to the green line, the more "normal" IV% is. Obviously, if this gets far away from the line then it could be setting up nicely to short options and sell the IV premium to someone else. (this signal, for example, would suggest using something like a Bull Put Spread)
Third: The red background along with the white line that drops down below zero signals when (and how far) the IV% from 3 months out (from VIX3M ) is less than the current IV%. This would signal the current environment has IV way too high, a signal to short options once again (and don't take any long option positions!).
Tried to make this simple, yet effective. If you trade options on SPX , SPY , even ES1! futures - this is a tool tailored specifically for you! As I said before, if you want you can use it for correlation on other securities. Any other ideas or suggestions surrounding this, please let me know! Enjoy!
Feb 17, 2019
Release Notes: Cosmetic update for a much cleaner look:
-Replaced the "HIGH IV" with a simlple "H"
-Now the white line is constantly showing you the relationship between VIX and VIX3M - when VIX is greater than VIX3M the background still goes red
-However, now when VIX drops below Historical Volatility, the background is bright green
-When both above are true - it's dark green
-The Average True Range on the bottom is now a series of crosses"
S&P 500 (SPX500)

Mega Trend Plus - S&P 500 Trend Follower / Market GaugeFirstly, 100% of the credit goes to Greg Morris @ Stockcharts.com for the article detailing the concept and most of the settings/components. I've simply implemented his idea. I haven't sought permission from him, but given that he was open with the components of the indicator I'm assuming he's happy for me to go ahead and code this in pinescript. See the article here: stockcharts.com
Okay, so this is part of a system/indicator Greg outlined in the article that he calls Trend Gauge. The idea is fairly simple: take a group of indexes that cover the breadth of the market you want to trade, track their relationship/position to their 200 period Exponential Moving Average (EMA), and assign scores to bull/bear crosses + relative location to the EMA. Once you've normalized and aggregated the scores you finish up with a trend following indicator that works surprisingly well.
This part is called Mega Trend Plus, and tracks whether an index is above or below its 200 period EMA. I'll be releasing the second part ("Trend Strength") soon. Once that's done I'll combine them to form the full "Trend Gauge" indicator.
I decided to provide the base version that people can then experiment with and tweak to their liking, so Greg's version shown in the article is smoother than the one provided here. It's up to you to play with smoothing options, and potentially tweak the weightings of the various components. Please see the script for info on what the various inputs are - I've added notes there.
So, how does it do? Well, as you can see from the chart above it works pretty well overall. The S&P 500 has been fairly trendy over the last few decades, so it's been prime territory for a system like this. It would have kept you out of the big bear markets (particularly GFC & 2015-16), and that's the goal of any trend-based system. They thrive on how little they lose, not necessarily on how much they make.
As you can see, the indicator is pretty choppy. So it's not designed (in the current configuration) to provide accurate buy/hold/sell signals. It currently functions more as a market gauge / strength indicator.
Hopefully you find this concept interesting. It's simple, but the best systems often are.
Please add comments below if you come up with an interesting configuration or variation.
Let me know if you have any queries.
DD

A.I.Driven TradersAI Model Trades for 20190612The entry and exit levels here are NOT derived from any specific indicator but are coming from our A.I. driven proprietary models.
This is an attempt at exploring the trading community here at TradingView and sharing our daily trading plans published at our site with the community here in the form a Pine Script - just starting and learning this platform. Please help point out any obvious errors or gotchas committed in the scripts. Thanks and have a great trading day!
**** The Trading Plan Published for today ****
>>>> Medium-Frequency Models: <<<<< For today, Wednesday 06/12, our medium-frequency models indicate using the 2895 as a pivot point - opening a long on a break above 2895, and opening a short on a break below 2895 (wait for a close on at least a five minute chart to determine the break), both sides with a 9-point trailing stop.
Note: For the trades to trigger, the breaks should occur during the regular session hours starting at 9:30am ET. By design, these models do NOT open any new positions after 3:45pm. Only one open position at any given time.
>>>>> Aggressive Intraday Models: <<<<< For today, Wednesday 06/12, our aggressive intraday models indicate going long on a break above 2892 or 2875 with an 6-point trailing stop, and going short on a break below 2887 or 2878 with an 8-point trailing stop.
Note: For the trades to trigger, the breaks should occur during regular session hours starting at 9:30am ET. Due to the intraday nature of these aggressive models, they indicate closing any open trades at 3:55pm and remaining flat into the session close. No opening of new positions after 3:45pm. Only one open position at any given time.

Market direction and pullback based on S&P 500.A simple indicator based on www.swing-trade-stocks.com The link is also the guide for how to use it.
0 - nothing. If the indicator is showing 0 for a prolonged amount of time, it is likely the market is in "momentum mode" (referred to in the link above).
1 - indicates an uptrend based on SMA and EMA and also a place where a reversal to the upside is likely to occur. You should look only for long trades in the stock market when you see a spike upwards and S&P 500 is showing an obvious uptrend.
-1 - indicates a downtrend based on SMA and EMA and also a place where a reversal to the downside is likely to occur. You should look only for short trades in the stock market when you see a spike upwards and S&P 500 is showing an obvious uptrend.

@WACC Volatility Weighted PUT/CALL Positions [SPX]This indicator is based on Volatility and Market Sentiment. When volatility is high, and market sentiment is positive, the indicator is in a low or 'buy state'. When volatility is low and market sentiment is poor, the indicator is high.
The indicator uses the VIX as it's volatility input.
The indicator uses the spread between the Call Volume on SPX/SPY and the Put Volume.
This is pulled from CVSPX and PVSPX.
When volatility and put/call reaches a critical level, such as the levels present in a crisis or a sell off, the line will be green. See Sept 2015, 2008, and Feb 2018.
This level can be edited in the source code.
As the indicator is based on Put/Call, the indicator works best on larger time frames as the put/call ratio becomes a more discernible measure of sentiment over time.

SMI-VIX-SPY-NDX-Index
This script offers an SMI index of VIX, SPY, and NDX. Rather than overlaying VIX, NDX and SPY on the same chart.
It's much easier to see the correlation between VIX's price and NDX / SPY price in this manner.
Thanks to Buckkets & William Blau for the TSI smoothing method.

Bollinger + RSI, Double Strategy Long-Only (by ChartArt) v1.2This strategy uses the RSI indicator together with the Bollinger Bands to go long when the price is below the lower Bollinger Band (and to close the long trade when this value is above the upper Bollinger band).
This simple strategy only places a long, when both the RSI and the Bollinger Bands indicators are at the same time in a oversold condition.
In this new version 1.2 the strategy was simplified even more than before by going long-only, which made the strategy more successful in backtesting than the previous version (that older version also opened short trades).
This strategy does not repaint and was updated to PineScript version 3.
All trading involves high risk; past performance is not necessarily indicative of future results. Hypothetical or simulated performance results have certain inherent limitations. Unlike an actual performance record, simulated results do not represent actual trading. Also, since the trades have not actually been executed, the results may have under- or over-compensated for the impact, if any, of certain market factors, such as lack of liquidity. Simulated trading programs in general are also subject to the fact that they are designed with the benefit of hindsight. No representation is being made that any account will or is likely to achieve profits or losses similar to those shown.
P.S. For advanced users: If you want also be able to short with the same strategy approach, then please use my older version 1.1:

Session barsthis script marks off the extended hours trading for NY session. Shades the off hours and overnight data. Highlights the regular trading session for NY session. It can be adjusted for any particular market.
I use it specifically to show the missing data on the SPY as compared with the continuous data on the SPX500.

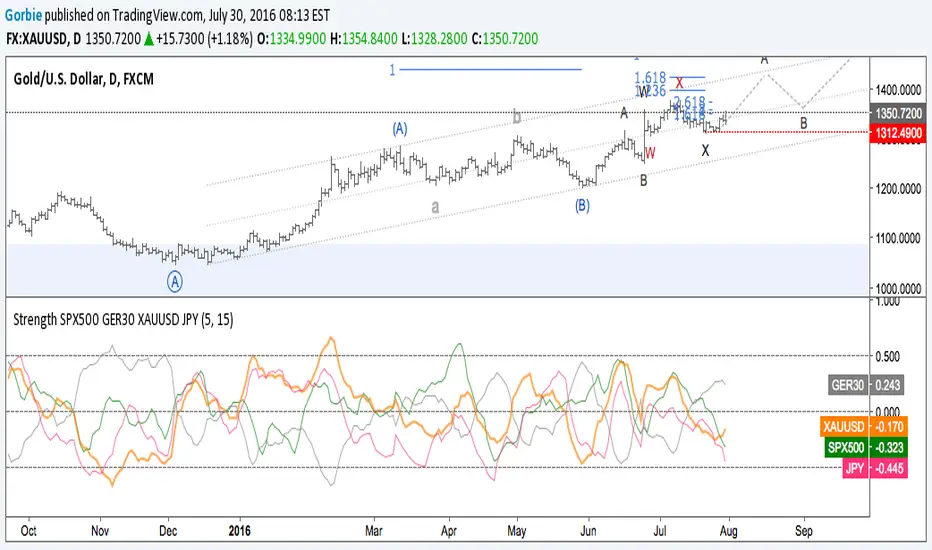
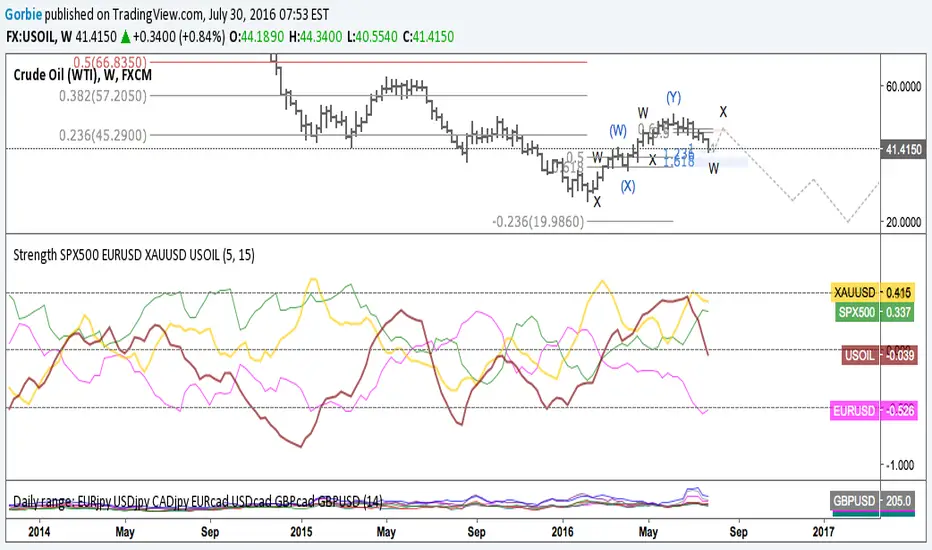
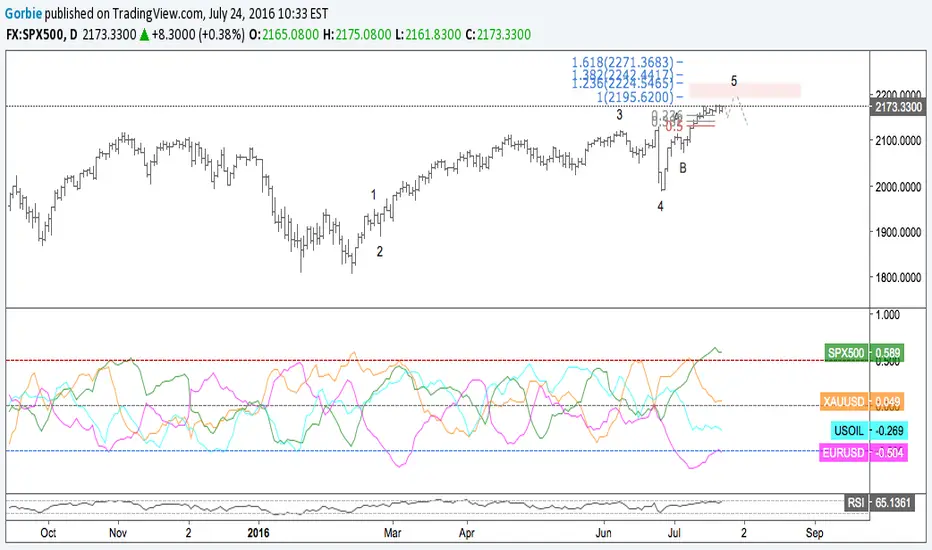
Strength SPX500 EURUSD XAUUSD USOILStrength of SPX500, EURUSD, XAUUSD and US OIL.
Buy or sell on extreme of strength into the overbought or the oversell.
Retracement SpotterThis employ the multi time frame analysis to give you the most accurate retracement signal.
The entries are fairly simple.
Buy = color turns green, then turn blank
Sell = color turns read, then turn blank

Sectors Relative Strength Normal DistributionI wrote this indicator as an attempt to see the Relative Strengths of different sectors in the same scale, but there is also other ways to do that.
This indicator plots the normal distribution for the 10 sectors of the SPY for the last X bars of the selected resolution, based on the selected comparative security. It shows which sectors are outperforming and underperforming the SPY (or any other security) relatively to each other by the given deviation.

SPY Master v1.0This is a simple swing trading algorithm that uses a fast RSI-EMA to trigger buy/cover signals and a slow RSI-EMA to trigger sell/short signals for SPY, an xchange-traded fund for the S&P 500.
The idea behind this strategy follows the premise that most profitable momentum trades usually occur during periods when price is trending up or down. Periods of flat price actions are usually where most unprofitable trades occur. Because we cannot predict exactly when trending periods will occur, the algorithm basically bets money on all trade opportunities during all market conditions. Despite an accuracy rate of only 40%, the algorithm's asymmetric risk/reward profile allows the average winner to be 2x the average loser. The end result is a positive (profitable) net payout.
TRADING RULES:
Buy/Cover = EMA3(RSI2) cross> 50
Sell/Short = EMA5(RSI2) cross< 50
BACKTEST SETTINGS:
- Period = March 2011 - Present
- Initial capital = $10,000
- Dividends excluded
- Trading costs excluded
PERFORMANCE COMPARISON:
There are 657 trades, which means 1,314 orders. Assuming each order costs $2 (what I pay for at Interactive Brokers), total trading costs should be $2,628.
-SPY (buy & hold) = 132.73 ---> 193.22 = +45.57% (dividends excluded)
-SPY Master v1.0 = $12,649 - $2,628 = $10,021 = +100.21%
DISCLAIMER: None of my ideas and posts are investment advice. Past performance is not an indication of future results. This strategy was constructed with the benefit of hindsight and its future performance cannot be guaranteed.

TICKv2USI:TICK
FX:SPX500
CME_MINI:ES1!
High/Low/Close/SMA of $TICK
Changes:
editable SMA lenght of HL/2 instead of ema of ohlc4. (green line)
added close (yelllow).
added 4 more editable lines.

ATR Pips [LazyBear] [Elixium Mod: FEAR GAUGE]Modified version of ATR Pips
The indicator's value is a third of the daily range which is good to use as a stop loss value for intra day scalping on markets such as index futures and forex.
It's good for detecting and confirming inflection points in the market.
