Multi-Ticker RS vs SPYThis Pine Script, titled "Multi-Ticker RS vs SPY," is a clean and efficient indicator designed for TradingView, enabling traders to monitor the relative strength (RS) of up to 10 ticker symbols compared to the S&P 500 ETF (SPY) on a single chart. Ideal for options traders, such as those managing a $1,400 account, it provides a simple way to assess which stocks are outperforming or underperforming the broader market. As of February 26, 2025, the script supports any chart timeframe, such as 5-minute or daily intervals, and calculates RS based on a user-defined lookback period, defaulting to 1 bar for real-time insights.
Users can input ticker symbols via customizable settings, with defaults set to popular stocks like AAPL, TSLA, NVDA, GOOGL, AMZN, MSFT, FB, NFLX, INTC, and PYPL. The script fetches closing prices for each ticker and SPY, computes their percentage changes over the lookback period, and determines RS as the ratio of each ticker’s change to SPY’s change, handling division by zero gracefully. It displays each ticker’s current RS score in a vertical column of labels on the chart’s top-left corner, updated on the last bar to avoid clutter. Users can adjust label size (tiny, small, normal, large) and text color for visibility, ensuring a tailored, error-free experience for quick market analysis.
Spy500

2 Moving Averages | Trend FollowingThe trading system is a trend-following strategy based on two moving averages (MA) and Parabolic SAR (PSAR) indicators.
How it works:
The strategy uses two moving averages: a fast MA and a slow MA.
It checks for a bullish trend when the fast MA is above the slow MA and the current price is above the fast MA.
It checks for a bearish trend when the fast MA is below the slow MA and the current price is below the fast MA.
The Parabolic SAR (PSAR) indicator is used for additional trend confirmation.
Long and short positions can be turned on or off based on user input.
The strategy incorporates risk management with stop-loss orders based on the Average True Range (ATR).
Users can filter the backtest date range and display various indicators.
The strategy is designed to work with the date range filter, risk management, and user-defined positions.
Features:
Trend-following strategy.
Two customizable moving averages.
Parabolic SAR for trend confirmation.
User-defined risk management with stop-loss based on ATR.
Backtest date range filter.
Flexibility to enable or disable long and short positions.
This trading system provides a comprehensive approach to trend-following and risk management, making it suitable for traders looking to capture trends with controlled risk.

ADD 2This is a modification to the original ADD script by Tom1trader
I added the option to choose the timeframe, moving average type and length.
Note from the original script:
"This is the NYSE Advancers - decliners which the SPX pretty much follows. You can chart it like any index (ADD -NYSE $ADV MINUS $DECL) but I find it more useful in a separate panel with colors for direction.
The level gives an idea of days move (example: plus or minus 500 is not much movement through the session) but I follow the direction as when more stocks advance (green) or decline (red) the index tends to track it pretty closely.
On SPX , SPY and correlates - very useful for intra-day trading (Scalping or 0DTE option trades) but not for higher time frames at all. If you chart the ADD in a chart and compare 5 minute to daily you will see what I mean."

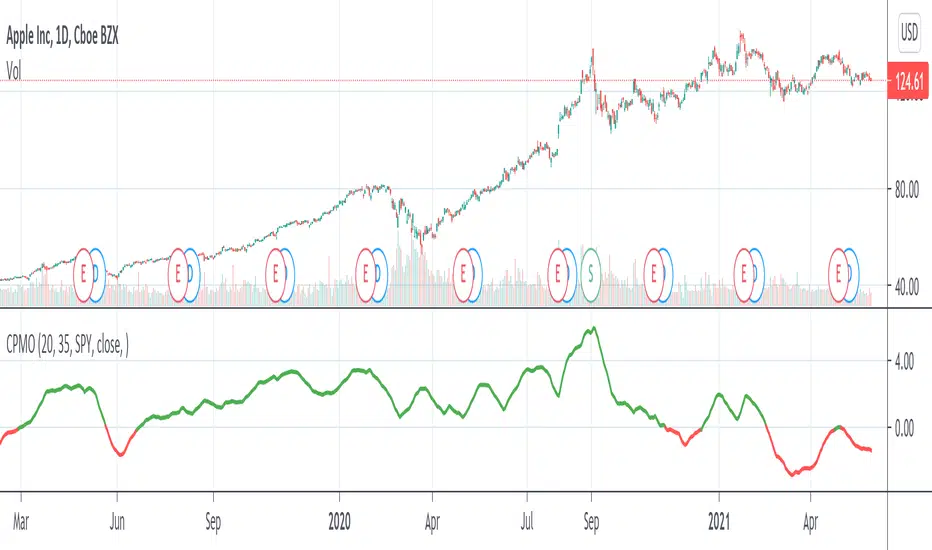
Compare Price Momentum Oscillator [CC]The Compare Price Momentum Oscillator was created by Vitali Apirine (Stocks and Commodities Aug 2020 pg 16) and this is a handy indicator to compare the momentum of the current symbol you are looking at to the s&p to determine the relative strength of the underlying security. Buy when the line turns green and sell when it turns red.
Let me know if there are any other scripts you would like to see me publish!
S&P Bear Warning IndicatorTHIS SCRIPT HAS BEEN BUILT TO BE USED AS A S&P500 SPY CRASH INDICATOR ON A DAILY TIME FRAME (should not be used as a strategy).
THIS SCRIPT HAS BEEN BUILT AS A STRATEGY FOR VISUALIZATION PURPOSES ONLY AND HAS NOT BEEN OPTIMIZED FOR PROFIT.
The script has been built to show as a lower indicator and also gives visual SELL signal on top when conditions are met. BARE IN MIND NO STOP LOSS, NOR ADVANCED EXIT STRATEGY HAS BEEN BUILT.
As well as the chart SELL signal an alert option has also been built into this script.
The script utilizes a VIX indicator (maroon line) and 50 period Momentum (blue line) and Danger/No trade zone(pink shading).
When the Momentum line crosses down across the VIX this is a sell off but in order to only signal major sell offs the SELL signal only triggers if the momentum continues down through the danger zone.
A SELL signal could be given earlier by removing the need to wait for momentum to continue down through the Danger Zone however this is designed only to catch major market weakness not small sell offs.
As you can see from the picture between the big October 2018 and March 2020 market declines only 2 additional SELLS were triggered.
To use this indicator to identify ideal buying then you should only buy when Momentum line is crossed above the VIX and the Momentum line is above the Danger Zone (ideally 3 - 5 days above danger zone)
