[SS] Linear ModelerHello everyone,
This is the linear modeler indicator.
It is a statistical based indicator that provides a likely price target and range based on a linear regression time series analysis.
To represent it visually, all the indicator does is it represents a linear regression channel and actually plots out the range at various points based on the current trend (see the chart below):
The indicator will perform the same assessment, but give you a working range and timeline for targets.
As well, the indicator will back-test the range and variables to see how it is performing and how reliable the results are likely to be.
General Functions:
In the chart above you can see all the various parameters and functions.
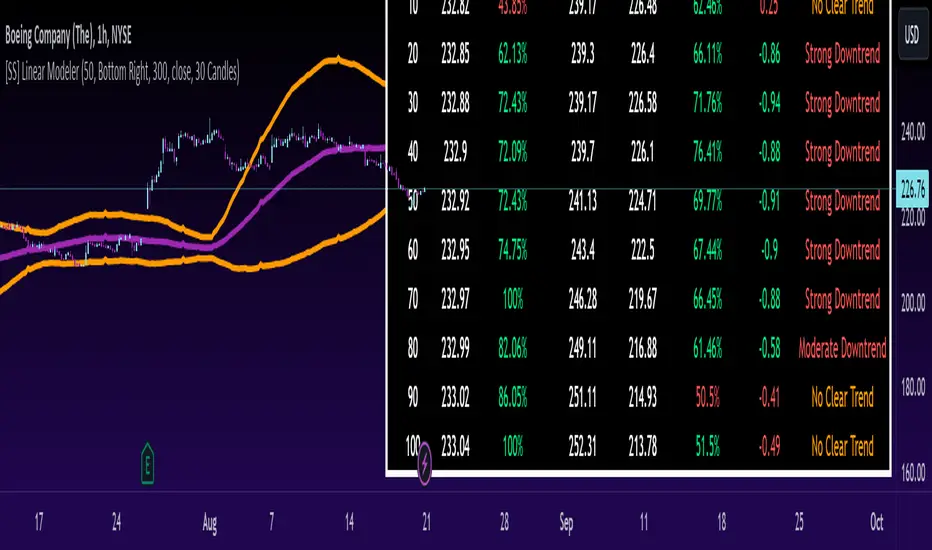
The indicator will display the most likely target (MLT) to be expected within the next pre-determined timeframe (by candles).
So for the first target, the indicator is saying within the next 10 candles, BA's MLT is 221.46 and based on BT results the reliability of this assessment is around 46%.
The indicator will also display the anticipated range at each designated timeframe.
In the chart above, we can see that at 20 candles, the likely range that BA should be trading in is 204 and 238 with a reliability of around 62% based on previous performance.
Plot Functions:
As this is performing a linear time series projection, you can have the indicator plot the projected ranges. Simply go to the settings menu and select the desired forecast length:
This will plot out the desired range and result over the specified time period. Here is an example of BA plotted over the next 50 candles on the hourly:
You can technically use this as an SMA/EMA type indicator, just keep in mind it may be a bit slower than a traditional EMA and SMA indicator, as it is processing a lot of data and plotting out forecasted data as opposed to an SMA or EMA.
If you wish to use it as an EMA or SMA, you can unselect the "Display Chart" Function to hide the table, and you can also select the "Plot Label" function. This will display the current projection analytics directly on your plotted line so you don't need to reference the table at all:
Tips on use:
I use this on the larger and smaller timeframes. On all timeframes, I will look to targets that display 90% to 100% in the BT results.
Bear in mind, this does not mean that we will 100% of the time hit this target, these targets can fail, it just means that there is a higher confidence of hitting this target than other, less reliable targets.
I will plot these targets out if they fall within the implied range of the timeframe I am looking at and will act on them according to the price action.
This is a great indicator to use in combination with other range based indicators. If you use the implied range from options to help guide your trading, you can see which targets are likely to be hit based on the current trend that fall within that implied range.
You can also assess the strength of the trends at various points in time and have an actionable range with a reliability reading at various points in time.
That is pretty much the bulk of the indicator.
Hopefully you find it helpful and useful.
As always, leave your questions and suggestions below.
Thanks for reading and checking it out!
Statistics
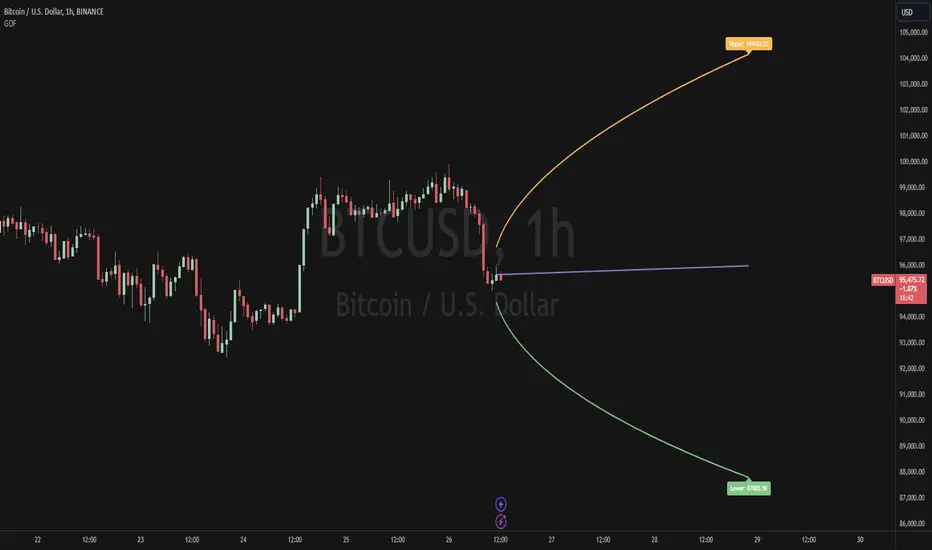
Guassian Distribution Forecast [prediction intervals]The Indicator
The Indicator combines volatility and frequency distributions to forecast an area of possible price expansion with an approximate confidence interval / level and level of significance (significance level).
The Script Formula
Additional comments
To alter the models forecasting precision to reflect a given confidence interval, e.g the 90% confidence level (C.L.), use the 1.64 multiplier (toggle value in "Standard normal distribution sd" setting), to use a specific C.L., e.g. the 85th percentile either search for this on google, or calculate it yourself using a Standard Normal Distribution Probability table. Additionaly volatility may be changed by toggling the lookback period setting, this can be thought of as widening the distribution tails.
The look forward parameter is currently fixed at 20, this is because it does not currently work correctly with higher integers, I will try resolve this problem and any other bugs as soon as possible
External Indicator Analysis Overlay | Buy/Sell | HTF Heikin-AshiThis chart overlay offers multiple candlestick display options. The Regular (Japanese) and the Heikin-Ashi candles are well known. The Mari-Ashi (or Renko) option is something special as it should be timeframe independent, so that sideways action should be represented in one candle. That is difficult to realize as an overlay on the normal candlestick structure, but perhaps the chosen implementation is useful nonetheless. The Velocity option is experimental and is designed to show if the price has accelerated too much in a trend direction. In this case, the highs and lows do not reflect the actual highs and lows, but indicate the overshooting velocity. The opening of the candle also depends on the inherent velocity, but the close of the candle is always the actual close. Anyway, it doesn't look very useful, but the option is there.
All options can be applied to higher timeframes. A usable setting is obtained by disabling only the body of the TradingView candles in regular mode and enabling this overlay.
A large part of this overlay consists of buy/sell indication settings. For activation it is necessary to select an external source. For example the “Relative Bi-Directional Volatility Range”, specifically the Trend Shift Signal (TSS). This signal switches from 0 to 1, if the trend becomes bullish or from 0 to -1, if the trend becomes bearish. It will be automatically detected without specifying the Indication Type. Alternatively, the Volatility Moving Average (VMA) would meet the requirements for the Indication Type “Buy = positive | Sell = negative”. The Moving Average Convergence Divergence (MACD) also fulfills these conditions. Another example is to use any Moving Average with the Indication Type “Buy = rising | Sell = falling”. In the chart above the Hull Moving Average (HMA) is used. In addition, it is possible to reverse the signal, so that positive signals become negative and vice versa. The signals will be labeled as Buy or Sell on the chart.
The user can analyze whether the provided signals are good or bad indications for going long or short or simply for rebalancing a portfolio. Therefore, it is possible to set a starting point for the analysis and choose a weighting for the investments from 0% to 100% of the portfolio. To avoid sleepless nights, a very reliable (and conservative) setting seems to be Rebalancing with 50% (very similar to the well-known 60/40 portfolio). The calculation results are shown in a table.
As a small addition there is the possibility to label the peaks by setting the distance between the highs/lows. This will make the quality of the buy and sell signals even more clear.

Dynamic Liquidity Map [Kioseff Trading]Hello!
Just a quick/fun project here: "Dynamic Heatmap".
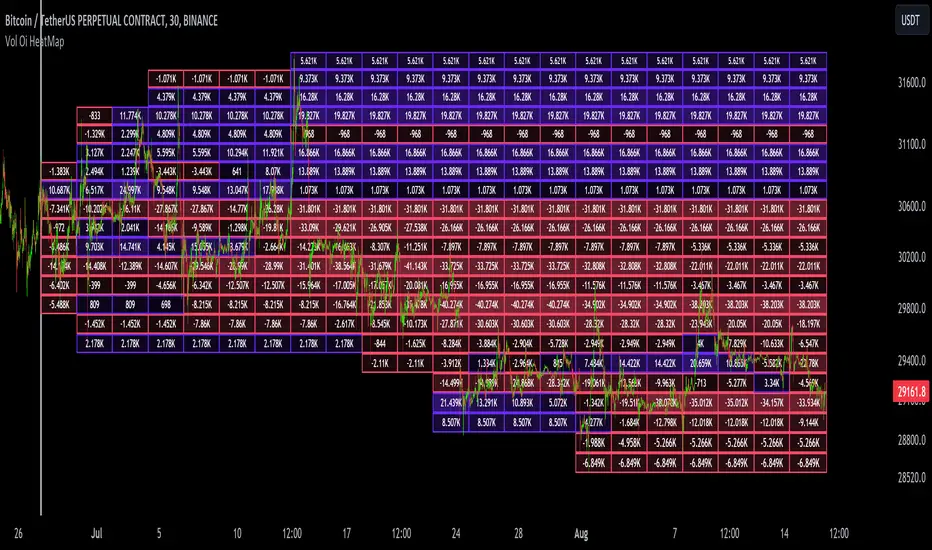
This script draws a volume delta or open interest delta heatmap for the asset on your chart.
The adjective "Dynamic" is used for two reasons (:
1: Self-Adjusting Lower Timeframe Data
The script requests ~10 lower timeframe volume and open interest data sets.
When using the fixed range feature the script will, beginning at the start time, check the ~10 requested lower timeframes to see which of the lower timeframes has available data.
The script will always use the lowest timeframe available during the calculation period. As time continues, the script will continue to check if new lower timeframe data (lower than the currently used lowest timeframe) is available. This process repeats until bar time is close enough to the current time that 1-minute data can be retrieved.
The image above exemplifies the process.
Incrementally lower timeframe data will be used as it becomes available.
1: Fixed range capabilities
The script features a "fixed range" tool, where you can manually set a start time (or drag & drop a bar on the chart) to determine the interval the heatmap covers.
From the start date, the script will calculate the calculate the sub-intervals necessary to draw a rows x columns heatmap. Consequently, setting the start time further back will draw a heat map with larger rows x columns, whereas, a start time closer to the current bar time will draw a more "precise" heatmap with smaller rows x columns.
Additionally, the heatmap can be calculated using open interest data.
The image above shows the heatmap displaying open interest delta.
The image above shows alternative settings for the heatmap.
Delta values have been hidden alongside grid border colors. These settings can be replicated to achieve a more "traditional" feel for the heatmap.
Thanks for checking this out!
Volume SuperTrend AI (Expo)█ Overview
The Volume SuperTrend AI is an advanced technical indicator used to predict trends in price movements by utilizing a combination of traditional SuperTrend calculation and AI techniques, particularly the k-nearest neighbors (KNN) algorithm.
The Volume SuperTrend AI is designed to provide traders with insights into potential market trends, using both volume-weighted moving averages (VWMA) and the k-nearest neighbors (KNN) algorithm. By combining these approaches, the indicator aims to offer more precise predictions of price trends, offering bullish and bearish signals.
█ How It Works
Volume Analysis: By utilizing volume-weighted moving averages (VWMA), the Volume SuperTrend AI emphasizes the importance of trading volume in the trend direction, allowing it to respond more accurately to market dynamics.
Artificial Intelligence Integration - k-Nearest Neighbors (k-NN) Algorithm: The k-NN algorithm is employed to intelligently examine historical data points, measuring distances between current parameters and previous data. The nearest neighbors are utilized to create predictive modeling, thus adapting to intricate market patterns.
█ How to use
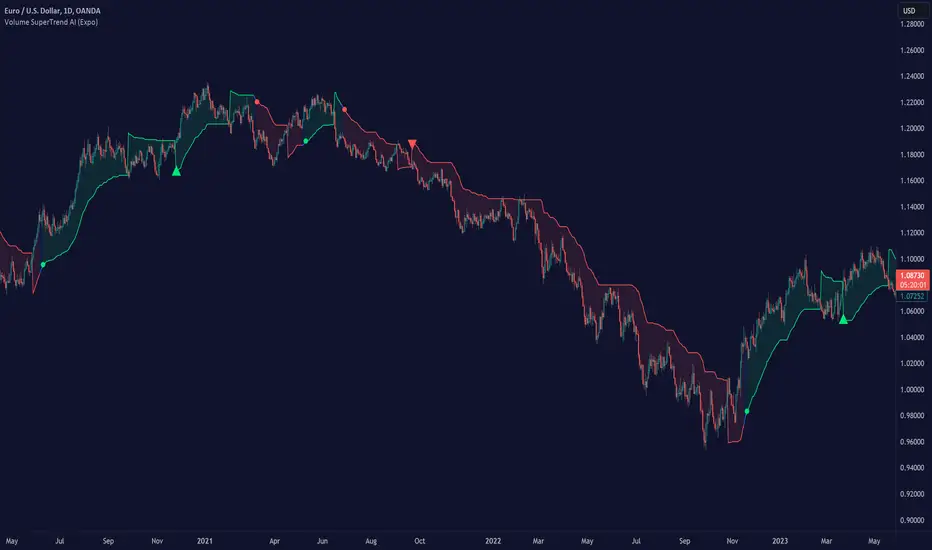
Trend Identification
The Volume SuperTrend AI indicator considers not only price movement but also trading volume, introducing an extra dimension to trend analysis. By integrating volume data, the indicator offers a more nuanced and robust understanding of market trends. When trends are supported by high trading volumes, they tend to be more stable and reliable. In practice, a green line displayed beneath the price typically suggests an upward trend, reflecting a bullish market sentiment. Conversely, a red line positioned above the price signals a downward trend, indicative of bearish conditions.
Trend Continuation signals
The AI algorithm is the fundamental component in the coloring of the Volume SuperTrend. This integration serves as a means of predicting the trend while preserving the inherent characteristics of the SuperTrend. By maintaining these essential features, the AI-enhanced Volume SuperTrend allows traders to more accurately identify and capitalize on trend continuation signals.
TrailingStop
The Volume SuperTrend AI indicator serves as a dynamic trailing stop loss, adjusting with both price movement and trading volume. This approach protects profits while allowing the trade room to grow, taking into account volume for a more nuanced response to market changes.
█ Settings
AI Settings:
Neighbors (k):
This setting controls the number of nearest neighbors to consider in the k-Nearest Neighbors (k-NN) algorithm. By adjusting this parameter, you can directly influence the sensitivity of the model to local fluctuations in the data. A lower value of k may lead to predictions that closely follow short-term trends but may be prone to noise. A higher value of k can provide more stable predictions, considering the broader context of market trends, but might lag in responsiveness.
Data (n):
This setting refers to the number of data points to consider in the model. It allows the user to define the size of the dataset that will be analyzed. A larger value of n may provide more comprehensive insights by considering a wider historical context but can increase computational complexity. A smaller value of n focuses on more recent data, possibly providing quicker insights but might overlook longer-term trends.
AI Trend Settings:
Price Trend & Prediction Trend:
These settings allow you to adjust the lengths of the weighted moving averages that are used to calculate both the price trend and the prediction trend. Shorter lengths make the trends more responsive to recent price changes, capturing quick market movements. Longer lengths smooth out the trends, filtering out noise, and highlighting more persistent market directions.
AI Trend Signals:
This toggle option enables or disables the trend signals generated by the AI. Activating this function may assist traders in identifying key trend shifts and opportunities for entry or exit. Disabling it may be preferred when focusing on other aspects of the analysis.
Super Trend Settings:
Length:
This setting determines the length of the SuperTrend, affecting how it reacts to price changes. A shorter length will produce a more sensitive SuperTrend, reacting quickly to price fluctuations. A longer length will create a smoother SuperTrend, reducing false alarms but potentially lagging behind real market changes.
Factor:
This parameter is the multiplier for the Average True Range (ATR) in SuperTrend calculation. By adjusting the factor, you can control the distance of the SuperTrend from the price. A higher factor makes the SuperTrend further from the price, giving more room for price movement but possibly missing shorter-term signals. A lower factor brings the SuperTrend closer to the price, making it more reactive but possibly more prone to false signals.
Moving Average Source:
This setting lets you choose the type of moving average used for the SuperTrend calculation, such as Simple Moving Average (SMA), Exponential Moving Average (EMA), etc.
Different types of moving averages provide various characteristics to the SuperTrend, enabling customization to align with individual trading strategies and market conditions.
-----------------
Disclaimer
The information contained in my Scripts/Indicators/Ideas/Algos/Systems does not constitute financial advice or a solicitation to buy or sell any securities of any type. I will not accept liability for any loss or damage, including without limitation any loss of profit, which may arise directly or indirectly from the use of or reliance on such information.
All investments involve risk, and the past performance of a security, industry, sector, market, financial product, trading strategy, backtest, or individual's trading does not guarantee future results or returns. Investors are fully responsible for any investment decisions they make. Such decisions should be based solely on an evaluation of their financial circumstances, investment objectives, risk tolerance, and liquidity needs.
My Scripts/Indicators/Ideas/Algos/Systems are only for educational purposes!
Seasonal - Trading Day of MonthIndicator Description: Historical Comparative Price Analysis
The Historical Comparative Price Analysis indicator serves as a comprehensive tool for evaluating price changes over distinct trading periods. By configuring the date settings, the indicator captures the percentage change data for each individual day or month, facilitating a clear historical perspective. Each year is represented in a separate row, allowing for a side-by-side presentation of corresponding data for the same trading day or week.
Within the "Summary" row, the indicator calculates the average change for each selected trading day within a specified time frame. This calculation, rooted in Larry Williams' concept, considers trading days rather than calendar days. The "Summary" row provides a quick insight into whether the current price change exceeds or falls short of the average change within the chosen time frame.
The indicator's final row presents a comprehensive overview, including the maximum and minimum average changes. It showcases the closing price from the first column of the 10th row, aiding in distinguishing between the last trading day of the month and the first trading day, which varies due to different market opening times.
To enhance visual analysis, the indicator attempts to display the price average of the chosen time frame as a reference line on the chart. The maximum and minimum values are added or subtracted from the reference line to create an average price channel. The color of the candlesticks dynamically changes to indicate whether the current price change is above or below the average.
For optimal results, we recommend selecting the previous year's data and the current month's data from the 1st to the 31st day. In weekly charts, multiple months can be selected to provide a broader perspective on price trends.
Enhance your trading insights with the Historical Comparative Price Analysis indicator, and gain a deeper understanding of how current price changes relate to historical averages.
Note: This description is intended for educational and informational purposes and is not intended as financial advice. Always conduct your research and analysis before making trading decisions.

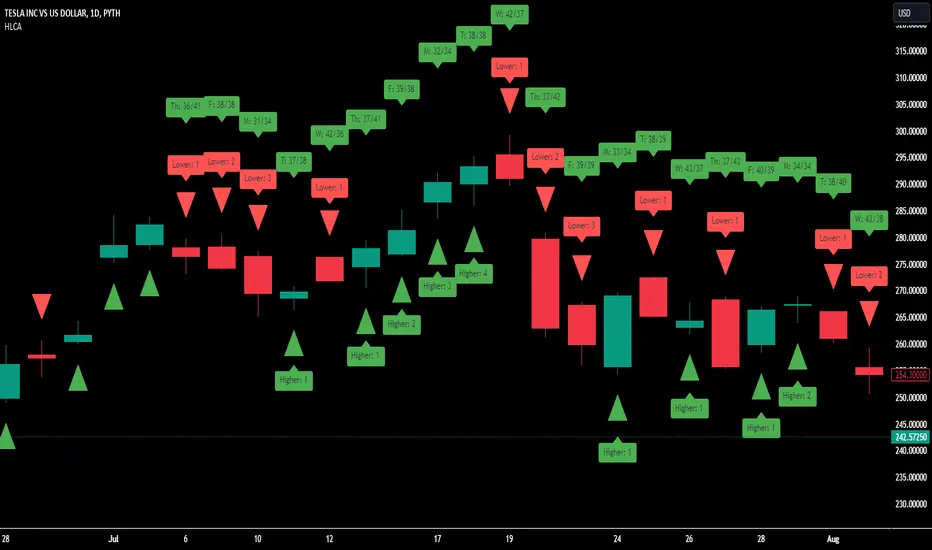
Clownpumps Higher/Lower Close Analysis (HLCA) IndicatorThe Clownpumps Higher/Lower Close Analysis" (HLCA) indicator offers a visual breakdown of the weekly behavior of a market, illustrating how often it closes higher or lower than its opening price. This comprehensive tool assists traders and analysts in pinpointing recurrent patterns that pertain to specific weekdays, forming a solid basis for a systematic trading strategy.
Features and Interpretation:
Color-Coded Analysis: The HLCA uses two intuitive colors to depict the daily trend:
Green: Indicates that, on average, the market closes higher than its opening price more frequently on that day.
Red: Highlights days when the market generally closes lower than its opening price.
Identifying Recurrent Patterns: Using the HLCA can reveal if a specific weekday consistently sees an asset closing higher or lower. For example, a consistent bullish sentiment on Mondays for a particular stock becomes easily observable.
Comparative Analysis: Deploying the HLCA across a range of assets can uncover trends that are either sector-wide or unique to individual stocks or cryptocurrencies.
Strategic Entry & Exit Points: Knowledge of which days an asset generally closes higher can guide traders in timing their market entries and exits.
Complementary to Other Tools: While the HLCA is a robust tool in itself, its true potential is unlocked when used in tandem with other market indicators. Pairing the daily closing patterns with volume data, for instance, can shed light on the strength of the observed trends.
Cautionary Notes:
Past behavior doesn't predict future performance. Always remember that correlation doesn't guarantee causation, especially when external market-shifting events come into play.
It's recommended to backtest any insights on historical data before committing to live trades.
Market Sessions and TPO (+Forecast)This indicator "Market Sessions and TPO (+Forecast)" shows various market sessions alongside a TPO profile (presented as the traditional lettering system or as bars) and price forecast for the duration of the session.
Additionally, numerous statistics for the session are shown.
Features
Session open and close times presented in boxes
Session pre market and post market shown
TPO profile generated for each session (normal market hours only)
A forecast for the remained of the session is projected forward
Forecast can be augmented by ATR
Naked POCs remain on the chart until violated
Volume delta for the session shown
OI Change for the session shown (Binance sourced)
Total volume for the session shown
Price range for the session shown
The image above shows processes of the indicator.
Volume delta, OI change, total volume and session range are calculated and presented for each session.
Additionally, a TPO profile for the most recent session is shown, and a forecast for the remainder of the active session is shown.
The image above shows an alternative display method for the session forecast and TPO profile!
Additionally, the pre-market and post-market times are denoted by dashed boxes.
The image above exemplifies additional capabilities.
That's all for now; further updates to come and thank you for checking this out!
And a special thank you to @TradingView of course, for making all of this possible!

Machine Learning Momentum Index (MLMI) [Zeiierman]█ Overview
The Machine Learning Momentum Index (MLMI) represents the next step in oscillator trading. By blending traditional momentum analysis with machine learning, MLMI delivers a potent and dynamic tool that aligns with the complexities of modern financial landscapes. Offering traders an adaptive way to understand and act on market momentum and trends, this oscillator provides real-time insights into market momentum and prevailing trends.
█ How It Works:
Momentum Analysis: MLMI employs a dual-layer analysis, utilizing quick and slow weighted moving averages (WMA) of the Relative Strength Index (RSI) to gauge the market's momentum and direction.
Machine Learning Integration: Through the k-Nearest Neighbors (k-NN) algorithm, MLMI intelligently examines historical data to make more accurate momentum predictions, adapting to the intricate patterns of the market.
MLMI's precise calculation involves:
Weighted Moving Averages: Calculations of quick (5-period) and slow (20-period) WMAs of the RSI to track short-term and long-term momentum.
k-Nearest Neighbors Algorithm: Distances between current parameters and previous data are measured, and the nearest neighbors are used for predictive modeling.
Trend Analysis: Recognition of prevailing trends through the relationship between quick and slow-moving averages.
█ How to use
The Machine Learning Momentum Index (MLMI) can be utilized in much the same way as traditional trend and momentum oscillators, providing key insights into market direction and strength. What sets MLMI apart is its integration of artificial intelligence, allowing it to adapt dynamically to market changes and offer a more nuanced and responsive analysis.
Identifying Trend Direction and Strength: The MLMI serves as a tool to recognize market trends, signaling whether the momentum is upward or downward. It also provides insights into the intensity of the momentum, helping traders understand both the direction and strength of prevailing market trends.
Identifying Consolidation Areas: When the MLMI Prediction line and the WMA of the MLMI Prediction line become flat/oscillate around the mid-level, it's a strong sign that the market is in a consolidation phase. This insight from the MLMI allows traders to recognize periods of market indecision.
Recognizing Overbought or Oversold Conditions: By identifying levels where the market may be overbought or oversold, MLMI offers insights into potential price corrections or reversals.
█ Settings
Prediction Data (k)
This parameter controls the number of neighbors to consider while making a prediction using the k-Nearest Neighbors (k-NN) algorithm. By modifying the value of k, you can change how sensitive the prediction is to local fluctuations in the data.
A smaller value of k will make the prediction more sensitive to local variations and can lead to a more erratic prediction line.
A larger value of k will consider more neighbors, thus making the prediction more stable but potentially less responsive to sudden changes.
Trend length
This parameter controls the length of the trend used in computing the momentum. This length refers to the number of periods over which the momentum is calculated, affecting how quickly the indicator reacts to changes in the underlying price movements.
A shorter trend length (smaller momentumWindow) will make the indicator more responsive to short-term price changes, potentially generating more signals but at the risk of more false alarms.
A longer trend length (larger momentumWindow) will make the indicator smoother and less responsive to short-term noise, but it may lag in reacting to significant price changes.
Please note that the Machine Learning Momentum Index (MLMI) might not be effective on higher timeframes, such as daily or above. This limitation arises because there may not be enough data at these timeframes to provide accurate momentum and trend analysis. To overcome this challenge and make the most of what MLMI has to offer, it's recommended to use the indicator on lower timeframes.
-----------------
Disclaimer
The information contained in my Scripts/Indicators/Ideas/Algos/Systems does not constitute financial advice or a solicitation to buy or sell any securities of any type. I will not accept liability for any loss or damage, including without limitation any loss of profit, which may arise directly or indirectly from the use of or reliance on such information.
All investments involve risk, and the past performance of a security, industry, sector, market, financial product, trading strategy, backtest, or individual's trading does not guarantee future results or returns. Investors are fully responsible for any investment decisions they make. Such decisions should be based solely on an evaluation of their financial circumstances, investment objectives, risk tolerance, and liquidity needs.
My Scripts/Indicators/Ideas/Algos/Systems are only for educational purposes!


Candles In Row (Expo)█ Overview
The Candles In Row (Expo) indicator is a powerful tool designed to track and visualize sequences of consecutive candlesticks in a price chart. Whether you're looking to gauge momentum or determine the prevailing trend, this indicator offers versatile functionality tailored to the needs of active traders. The Candles In Row indicator can be an integral part of a multi-timeframe trading strategy, allowing traders to understand market momentum, and set trading bias. By recognizing the patterns and likelihood of future price movements, traders can make more informed decisions and align their trades with the overall market direction.
█ How to use
The indicator enhances traders' understanding of the consecutive candle patterns, helping them to uncover trends and momentum. Consecutive candles in the same direction may indicate a strong trend. The Candles In Row indicator can be an essential tool for traders employing a multiple timeframes strategy.
Analyzing a Higher Timeframe:
Understanding Momentum: By analyzing consecutive green or red candles in a higher timeframe, traders can identify the prevailing momentum in the market. A series of green candles would suggest an upward trend, while a series of red candles would indicate a downward trend.
Predicting Next Candle: The indicator's predictive feature calculates the likelihood of the next candle being green or red based on historical patterns. This probability helps traders gauge the potential continuation of the trend.
Setting the Trading Bias: If the likelihood of the next candle being green is high, the trader may decide to focus on long (buy) opportunities. Conversely, if the likelihood of the next candle being red is high, the trader may look for short (sell) opportunities.
In this example, we are using the Heikin Ashi candles.
Moving to a Lower Timeframe:
Finding Entry Points: Once the trading bias is set based on the higher timeframe analysis, traders can switch to a lower timeframe to look for entry points in the direction of the bias. For example, if the higher timeframe suggests a high likelihood of a green candle, traders may look for buy opportunities in the lower timeframe.
Combining Timeframes for a Comprehensive Strategy:
Confirmation and Alignment: By analyzing the higher timeframe and confirming the direction in the lower timeframe, traders can ensure that they are trading in alignment with the broader trend.
Avoiding False Signals: By using a higher timeframe to set the trading bias and a lower timeframe to find entries, traders can avoid false signals and whipsaws that might be present in a single timeframe analysis.
█ Settings
Price Input Selection: Choose between regular open and close prices or Heikin Ashi candles as the basis for calculation.
Data Window Control: Decide between displaying the full data window or only the active data. You can also enable a counter that keeps track of the number of candles.
Alert Configuration: Set the desired number and color of consecutive candles that must occur in a row to trigger an alert.
Table Display Customization: Customize the location and size of the display table according to your preferences.
-----------------
Disclaimer
The information contained in my Scripts/Indicators/Ideas/Algos/Systems does not constitute financial advice or a solicitation to buy or sell any securities of any type. I will not accept liability for any loss or damage, including without limitation any loss of profit, which may arise directly or indirectly from the use of or reliance on such information.
All investments involve risk, and the past performance of a security, industry, sector, market, financial product, trading strategy, backtest, or individual's trading does not guarantee future results or returns. Investors are fully responsible for any investment decisions they make. Such decisions should be based solely on an evaluation of their financial circumstances, investment objectives, risk tolerance, and liquidity needs.
My Scripts/Indicators/Ideas/Algos/Systems are only for educational purposes!

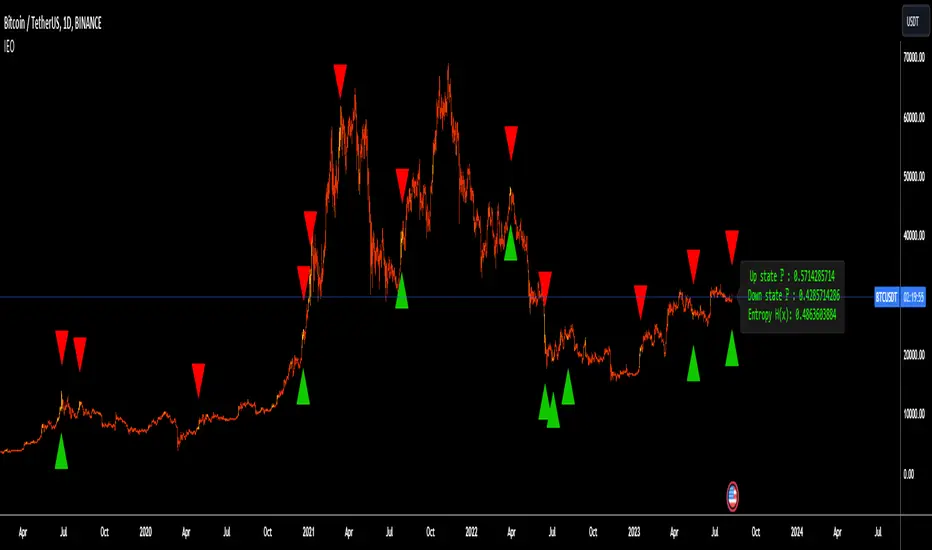
Information Entropy OscillatorHello Traders
This Trading Indicator / script is my interpritation of the use of shannons entropy in Trading, hope you find this usefull !!!
Information Entropy Oscillator :
In Physics, entropy is a concept and a measurable physical property that is most commonly associated with the state of disorder, randomness or uncertainty of a system. In the Thermodynamic field Entropy also describes how much energy is not available to do work, The more disordered a system and higher the entropy, the less of a system's energy is available to do work. This last definition is central to the idea of this trading idea, Briefly this is because the lower the information Entropy the “more predictable” is price movement which is characterized by a two states process up(h), and down(d) - (green and red candles), thus the more predictable a up or down move, Given the definition this also means more “energy” which can be thought of as the systems “predictive power” is available to do work, where work in this case to predict the likelihood of a trend continuation.
In Information Theory, the entropy of a random variable (A statistical term that describes either a discrete or continuous event with a respective (discrete or continuous) probability, where the latter is expressed via a CDF - cumulative distribution function) is the average level of "information", "surprise", or "uncertainty" inherent to the variable's possible outcomes. note : this is the definition for Entropy that this script is built upon
Formual Derivation :
Interpretations of Information Entropy Values (Polar approach)
when , …
H(x) = 0 Max-Information gain (purity of knowledge available)
H(x) = 1 No INformation gain, When both states probabilities are equal, i.e. H = T = 0.5, the function yields maximum uncertainty and therefore maximum entropy. This reflects
When Information gain is nearing 0, thus low, the script attempts to predict the proceeding trend direction, for example when entropy is low and all bars preceding the real market / time bars have all been positive and the real time bar closes as a red candle (close < yesterday's open) the script takes this as a high information gain signal, “predicting” a Bearish trend.
The Script Also comes with a Information Entropy heat map to plot entropy (inspired by Oppenheimer and Barbie lol), to see this turn off all candle plots, plots in the Chart settings, under the symbol header .
AI Trend Navigator [K-Neighbor]█ Overview
In the evolving landscape of trading and investment, the demand for sophisticated and reliable tools is ever-growing. The AI Trend Navigator is an indicator designed to meet this demand, providing valuable insights into market trends and potential future price movements. The AI Trend Navigator indicator is designed to predict market trends using the k-Nearest Neighbors (KNN) classifier.
By intelligently analyzing recent price actions and emphasizing similar values, it helps traders to navigate complex market conditions with confidence. It provides an advanced way to analyze trends, offering potentially more accurate predictions compared to simpler trend-following methods.
█ Calculations
KNN Moving Average Calculation: The core of the algorithm is a KNN Moving Average that computes the mean of the 'k' closest values to a target within a specified window size. It does this by iterating through the window, calculating the absolute differences between the target and each value, and then finding the mean of the closest values. The target and value are selected based on user preferences (e.g., using the VWAP or Volatility as a target).
KNN Classifier Function: This function applies the k-nearest neighbor algorithm to classify the price action into positive, negative, or neutral trends. It looks at the nearest 'k' bars, calculates the Euclidean distance between them, and categorizes them based on the relative movement. It then returns the prediction based on the highest count of positive, negative, or neutral categories.
█ How to use
Traders can use this indicator to identify potential trend directions in different markets.
Spotting Trends: Traders can use the KNN Moving Average to identify the underlying trend of an asset. By focusing on the k closest values, this component of the indicator offers a clearer view of the trend direction, filtering out market noise.
Trend Confirmation: The KNN Classifier component can confirm existing trends by predicting the future price direction. By aligning predictions with current trends, traders can gain more confidence in their trading decisions.
█ Settings
PriceValue: This determines the type of price input used for distance calculation in the KNN algorithm.
hl2: Uses the average of the high and low prices.
VWAP: Uses the Volume Weighted Average Price.
VWAP: Uses the Volume Weighted Average Price.
Effect: Changing this input will modify the reference values used in the KNN classification, potentially altering the predictions.
TargetValue: This sets the target variable that the KNN classification will attempt to predict.
Price Action: Uses the moving average of the closing price.
VWAP: Uses the Volume Weighted Average Price.
Volatility: Uses the Average True Range (ATR).
Effect: Selecting different targets will affect what the KNN is trying to predict, altering the nature and intent of the predictions.
Number of Closest Values: Defines how many closest values will be considered when calculating the mean for the KNN Moving Average.
Effect: Increasing this value makes the algorithm consider more nearest neighbors, smoothing the indicator and potentially making it less reactive. Decreasing this value may make the indicator more sensitive but possibly more prone to noise.
Neighbors: This sets the number of neighbors that will be considered for the KNN Classifier part of the algorithm.
Effect: Adjusting the number of neighbors affects the sensitivity and smoothness of the KNN classifier.
Smoothing Period: Defines the smoothing period for the moving average used in the KNN classifier.
Effect: Increasing this value would make the KNN Moving Average smoother, potentially reducing noise. Decreasing it would make the indicator more reactive but possibly more prone to false signals.
█ What is K-Nearest Neighbors (K-NN) algorithm?
At its core, the K-NN algorithm recognizes patterns within market data and analyzes the relationships and similarities between data points. By considering the 'K' most similar instances (or neighbors) within a dataset, it predicts future price movements based on historical trends. The K-Nearest Neighbors (K-NN) algorithm is a type of instance-based or non-generalizing learning. While K-NN is considered a relatively simple machine-learning technique, it falls under the AI umbrella.
We can classify the K-Nearest Neighbors (K-NN) algorithm as a form of artificial intelligence (AI), and here's why:
Machine Learning Component: K-NN is a type of machine learning algorithm, and machine learning is a subset of AI. Machine learning is about building algorithms that allow computers to learn from and make predictions or decisions based on data. Since K-NN falls under this category, it is aligned with the principles of AI.
Instance-Based Learning: K-NN is an instance-based learning algorithm. This means that it makes decisions based on the entire training dataset rather than deriving a discriminative function from the dataset. It looks at the 'K' most similar instances (neighbors) when making a prediction, hence adapting to new information if the dataset changes. This adaptability is a hallmark of intelligent systems.
Pattern Recognition: The core of K-NN's functionality is recognizing patterns within data. It identifies relationships and similarities between data points, something akin to human pattern recognition, a key aspect of intelligence.
Classification and Regression: K-NN can be used for both classification and regression tasks, two fundamental problems in machine learning and AI. The indicator code is used for trend classification, a predictive task that aligns with the goals of AI.
Simplicity Doesn't Exclude AI: While K-NN is often considered a simpler algorithm compared to deep learning models, simplicity does not exclude something from being AI. Many AI systems are built on simple rules and can be combined or scaled to create complex behavior.
No Explicit Model Building: Unlike traditional statistical methods, K-NN does not build an explicit model during training. Instead, it waits until a prediction is required and then looks at the 'K' nearest neighbors from the training data to make that prediction. This lazy learning approach is another aspect of machine learning, part of the broader AI field.
-----------------
Disclaimer
The information contained in my Scripts/Indicators/Ideas/Algos/Systems does not constitute financial advice or a solicitation to buy or sell any securities of any type. I will not accept liability for any loss or damage, including without limitation any loss of profit, which may arise directly or indirectly from the use of or reliance on such information.
All investments involve risk, and the past performance of a security, industry, sector, market, financial product, trading strategy, backtest, or individual's trading does not guarantee future results or returns. Investors are fully responsible for any investment decisions they make. Such decisions should be based solely on an evaluation of their financial circumstances, investment objectives, risk tolerance, and liquidity needs.
My Scripts/Indicators/Ideas/Algos/Systems are only for educational purposes!

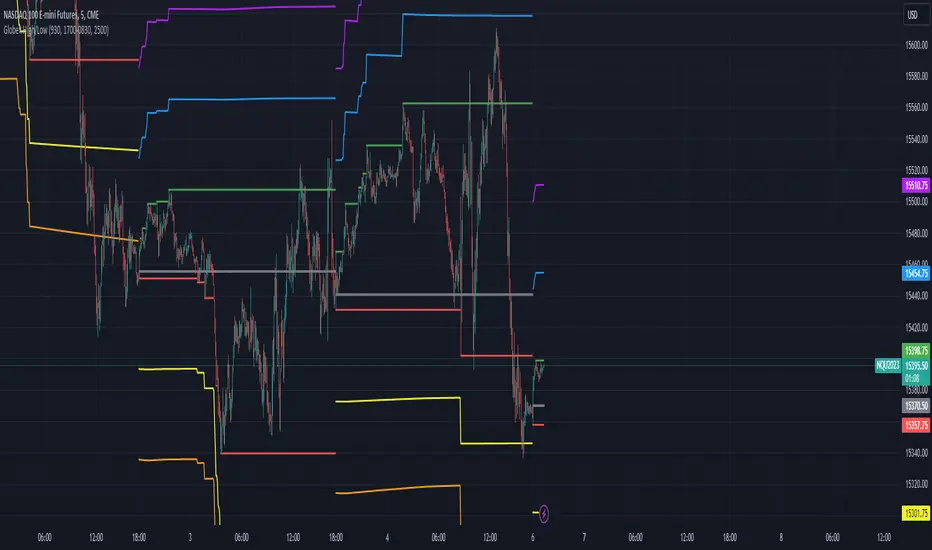
Globex High/LowThis indicator marks the opening, high, and low of the Globex range in futures (6 PM ET - 9:30 AM ET). In addition, it also will calculate and plot the 1st and 2nd standard deviations above and below the globex range. These levels can be used as support and resistance in the New York session (9:30 AM ET - 4 PM ET). Price often respects the globex range to some degree during regular trading hours. This can be modified for any time range you prefer.
Extended Moving Average (MA) LibraryThis Extended Moving Average Library is a sophisticated and comprehensive tool for traders seeking to expand their arsenal of moving averages for more nuanced and detailed technical analysis.
The library contains various types of moving averages, each with two versions - one that accepts a simple constant length parameter and another that accepts a series or changing length parameter.
This makes the library highly versatile and suitable for a wide range of strategies and trading styles.
Moving Averages Included:
Simple Moving Average (SMA): This is the most basic type of moving average. It calculates the average of a selected range of prices, typically closing prices, by the number of periods in that range.
Exponential Moving Average (EMA): This type of moving average gives more weight to the latest data and is thus more responsive to new price information. This can help traders to react faster to recent price changes.
Double Exponential Moving Average (DEMA): This is a composite of a single exponential moving average, a double exponential moving average, and an exponential moving average of a triple exponential moving average. It aims to eliminate lag, which is a key drawback of using moving averages.
Jurik Moving Average (JMA): This is a versatile and responsive moving average that can be adjusted for market speed. It is designed to stay balanced and responsive, regardless of how long or short it is.
Kaufman's Adaptive Moving Average (KAMA): This moving average is designed to account for market noise or volatility. KAMA will closely follow prices when the price swings are relatively small and the noise is low.
Smoothed Moving Average (SMMA): This type of moving average applies equal weighting to all observations and smooths out the data.
Triangular Moving Average (TMA): This is a double smoothed simple moving average, calculated by averaging the simple moving averages of a dataset.
True Strength Force (TSF): This is a moving average of the linear regression line, a statistical tool used to predict future values from past values.
Volume Moving Average (VMA): This is a simple moving average of a volume, which can help to identify trends in volume.
Volume Adjusted Moving Average (VAMA): This moving average adjusts for volume and can be more responsive to volume changes.
Zero Lag Exponential Moving Average (ZLEMA): This type of moving average aims to eliminate the lag in traditional EMAs, making it more responsive to recent price changes.
Selector: The selector function allows users to easily select and apply any of the moving averages included in the library inside their strategy.
This library provides a broad selection of moving averages to choose from, allowing you to experiment with different types and find the one that best suits your trading strategy.
By providing both simple and series versions for each moving average, this library offers great flexibility, enabling users to pass both constant and changing length parameters as needed.
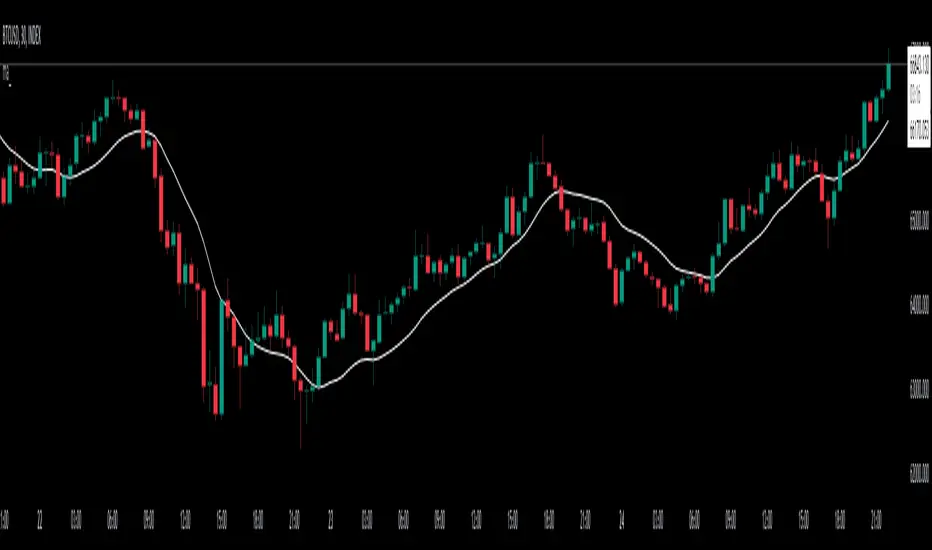
Normal Distribution CurveThis Normal Distribution Curve is designed to overlay a simple normal distribution curve on top of any TradingView indicator. This curve represents a probability distribution for a given dataset and can be used to gain insights into the likelihood of various data levels occurring within a specified range, providing traders and investors with a clear visualization of the distribution of values within a specific dataset. With the only inputs being the variable source and plot colour, I think this is by far the simplest and most intuitive iteration of any statistical analysis based indicator I've seen here!
Traders can quickly assess how data clusters around the mean in a bell curve and easily see the percentile frequency of the data; or perhaps with both and upper and lower peaks identify likely periods of upcoming volatility or mean reversion. Facilitating the identification of outliers was my main purpose when creating this tool, I believed fixed values for upper/lower bounds within most indicators are too static and do not dynamically fit the vastly different movements of all assets and timeframes - and being able to easily understand the spread of information simplifies the process of identifying key regions to take action.
The curve's tails, representing the extreme percentiles, can help identify outliers and potential areas of price reversal or trend acceleration. For example using the RSI which typically has static levels of 70 and 30, which will be breached considerably more on a less liquid or more volatile asset and therefore reduce the actionable effectiveness of the indicator, likewise for an asset with little to no directional volatility failing to ever reach this overbought/oversold areas. It makes considerably more sense to look for the top/bottom 5% or 10% levels of outlying data which are automatically calculated with this indicator, and may be a noticeable distance from the 70 and 30 values, as regions to be observing for your investing.
This normal distribution curve employs percentile linear interpolation to calculate the distribution. This interpolation technique considers the nearest data points and calculates the price values between them. This process ensures a smooth curve that accurately represents the probability distribution, even for percentiles not directly present in the original dataset; and applicable to any asset regardless of timeframe. The lookback period is set to a value of 5000 which should ensure ample data is taken into calculation and consideration without surpassing any TradingView constraints and limitations, for datasets smaller than this the indicator will adjust the length to just include all data. The labels providing the percentile and average levels can also be removed in the style tab if preferred.
Additionally, as an unplanned benefit is its applicability to the underlying price data as well as any derived indicators. Turning it into something comparable to a volume profile indicator but based on the time an assets price was within a specific range as opposed to the volume. This can therefore be used as a tool for identifying potential support and resistance zones, as well as areas that mark market inefficiencies as price rapidly accelerated through. This may then give a cleaner outlook as it eliminates the potential drawbacks of volume based profiles that maybe don't collate all exchange data or are misrepresented due to large unforeseen increases/decreases underlying capital inflows/outflows.
Thanks to @ALifeToMake, @Bjorgum, vgladkov on stackoverflow (and possibly some chatGPT!) for all the assistance in bringing this indicator to life. I really hope every user can find some use from this and help bring a unique and data driven perspective to their decision making. And make sure to please share any original implementaions of this tool too! If you've managed to apply this to the average price change once you've entered your position to better manage your trade management, or maybe overlaying on an implied volatility indicator to identify potential options arbitrage opportunities; let me know! And of course if anyone has any issues, questions, queries or requests please feel free to reach out! Thanks and enjoy.
