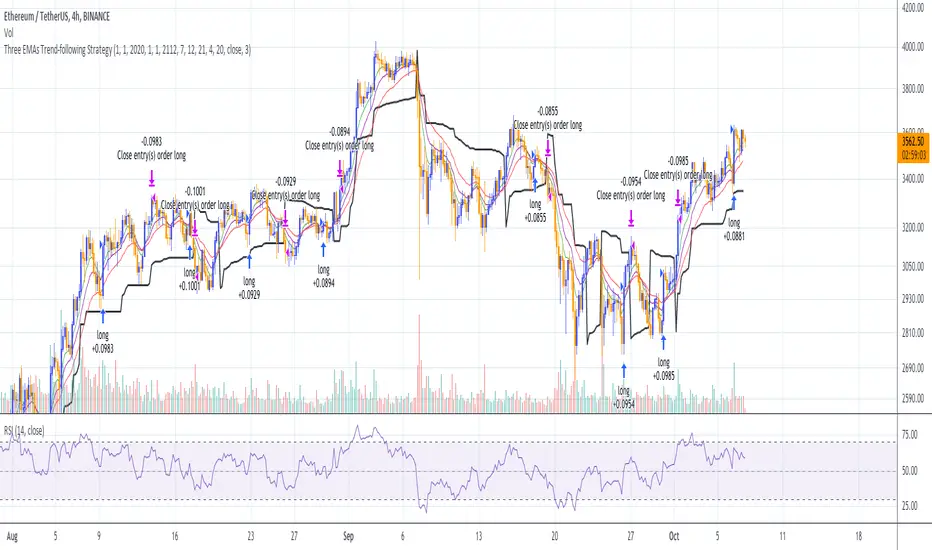
Three EMAs Trend-following Strategy (by Coinrule)Trend-following strategies are great because they give you the peace of mind that you're trading in line with the market.
However, by definition, you're always following . That means you're always a bit later than your want to be. The main challenges such strategies face are:
Confirming that there is a trend
Following the trend, hopefully, early enough to catch the majority of the move
Hopping off the trade when it seems to have run its course
This EMA Trend-following strategy attempts to address such challenges while allowing for a dynamic stop loss.
ENTRY
The trading system requires three crossovers on the same candle to confirm that a new trend is beginning:
Price crossing over EMA 7
Price crossing over EMA 14
Price crossing over EMA 21
The first benefit of using all three crossovers is to reduce false signals. The second benefit is that you know that a strong trend is likely to develop relatively soon, with the help of the fast setup of the three EMAs.
EXIT
The strategy comes with a fixed take profit and a volatility stop, which acts as a trailing stop to adapt to the trend's strength. That helps you get out of the way as soon as market conditions change. Depending on your long term confidence in the asset, you can edit the fixed take profit to be more conservative or aggressive.
The position is closed when:
The price increases by 4%
The price crosses below the volatility stop.
The best time frame for this strategy based on our backtest is the 4-hr. Shorter timeframes can also work well, although they exhibit larger volatility in their returns. In general, this approach suits medium timeframes. A trading fee of 0.1% is taken into account. The fee is aligned to the base fee applied on Binance, which is the largest cryptocurrency exchange.
You can execute this strategy on your favourite exchange at coinrule.com
Takeprofit
Take Profit On Trend (by BHD_Trade_Bot)The purpose of strategy is to detect long-term uptrend and short-term downtrend so that you can easy to take profit.
The strategy also using BHD unit to detect how big you win and lose, so that you can use this strategy for all coins without worry about it have different percentage of price change.
ENTRY
The buy order is placed on assets that have long-term uptrend and short-term downtrend:
- Long-term uptrend condition: ema200 is going up (rsi200 greater than 51)
- Short-term downtrend condition: 2 last candles are down price (use candlestick for less delay)
CLOSE
The sell order is placed when take profit or stop loss:
- Take profit: price increase 1 BHD unit
- Stop loss: price decrease 2 BHD units
The strategy use $15 and trading fee is 0.1% for each order. So that, in the real-life, if you are using trade bot, it will need $1500 for trading 100 coins at the same time.
Pro tip : The 1-hour time frame for altcoin/USDT has the best results on average.

%-[Guz] Vortex Indicator Custom// Custom Vortex Strategy (backtester)
// Custom version of the Vortex indicators that adds many features:
// -Triggers trades after a threshold is reached instead of the normal vortex lines cross (once the difference between the 2 lines is important enough)
// -Smooths the Vortex lines with an EMA
// -Adds Take Profit and Stop Loss selection
// -Adds the possibility to go Long only, Short only or both of them
// ! notice that it uses 10% position size and 0.04% trade fee, found on some crypto exchanges futures contracts
// Allows testing leverage with position size modification (values above 100% position size, to be done with caution)
// Not an investment advice

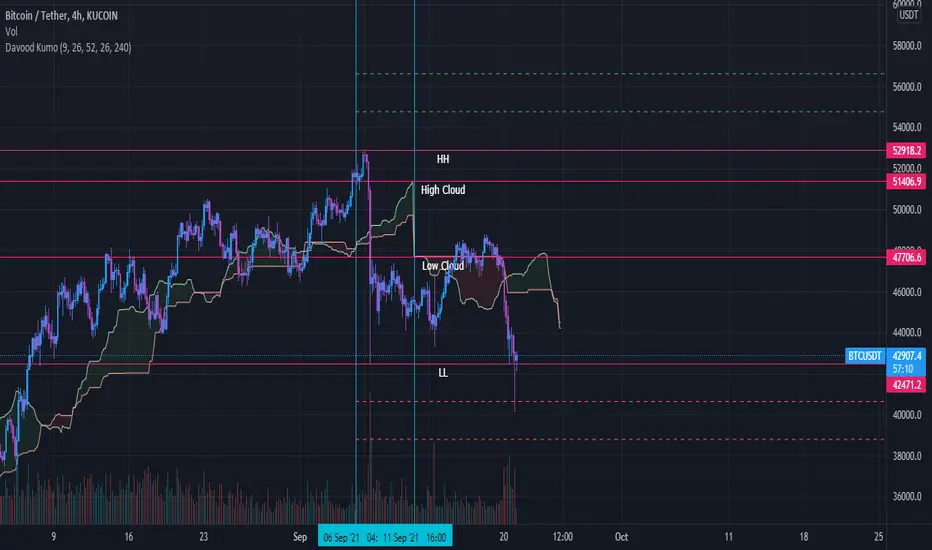
Davood Kumothis andicator is build in base of ichimoku cloud.
Select the interval at which the kumo clouds change phase and depending on what time frame we are in, we give the time inputs to the indicator.
then, the indicator calculates the area of the cloud and set the ascending and descending targets when price break the highest or lowest candle in that time range.
So entry point is the highest and lowest candle and first and second targets are determined by the indicator.
note : i used this andicator only in crypto market not forex and it works well
MACD + DMI Scalping with Volatility Stop by (Coinrule)Trend-following strategies are cool because they allow you to catch potential high returns.
The main limit of such strategies are:
False signals > the asset is not experiencing a strong trend. The strategy gets stuck with a sideways move or, worst, with the beginning of a downtrend.
The sell signal may come later than the actual top, leading in some cases to turn a trade in profit into a loss.
This strategy tries to address these limitations to develop a trading system that optimises the entry and closes trade once the profit achieves a pre-set level.
ENTRY
The trading system uses the MACD and the DMI to confirm when is the best time for buying. Combining these two indicators prevents trading during downtrends and reduces the likelihood of getting stuck in a market with low volatility.
The system confirms the entry when:
The MACD histogram turns bullish.
When the positive DMI is greater than the negative DMI, there are more chances that the asset is trading in a sustained uptrend.
EXIT
The strategy comes with a fixed take profit combined with a volatility stop, which acts as a trailing stop to adapt to the trend's strength. Depending on your long term confidence in the asset, you can edit the fixed take profit to be more conservative or aggressive.
The position is closed when:
The price increases by 3%
The price crosses below the volatility stop.
The best time frame for this strategy based on our backtest is the 3-hr . The 4-hr can work well. In general, this approach suits medium to long term strategies
The strategy assumes each order to trade 30% of the available capital to make the results more realistic. A trading fee of 0.1% is taken into account. The fee is aligned to the base fee applied on Binance, which is the largest cryptocurrency exchange.

Strategy TemplateThis is the fastest way to create a Trading View strategy. The template I have created includes stoploss and take profit enabling and plotting, date range, and strategy buy and sell conditions. I believe this will benefit the people in the Trading View community by creating a strategy faster and more efficiently than just repeating pine script code. All that needs to be done by the person using this script is to add their own indicators, and create their own buy and sell signals. Then they can immediately start back testing their new strategy!
money managementthis indicator has been designed to make your calculations easier and faster.
you can use this indicator to set tp and sl prices based on your entry price, balance,risk and leverage.
it has been designed only for cryptocurrency market and it is not recommended to use it in other markets!
1- enter your balance in the setting of the indicator.
2- enter risk percentage of your balance.
3- enter your sl percentage.
4- enter your tp percentage.
5- set your leverage if you are trading in futures market.
6- and at last set your entry price.
your position size both in spot market and futures market and the exact price of tp and sl , will be shown top right of the screen.
caution: before using this indicator in real market, please make sure that you understand this indicator's behavior and test it.
--------------------------------------------------------------------
این اندیکاتور برای تسریع محاسبات مدیریت سرمایه و سهولت رعایت آن طراحی شده است.
شما میتوانید با وارد کردن پارامترهاقیمت ورودی، سرمایه کل، ریسک و اهرم، قیمت حد سود و ضرر خود را محاسبه کنید.
همچنین اندازه حجم معاملات شما توسط این اندیکاتور محاسبه خواهد شد.
این اندیکاتور برای بازار کریپتوکارنسی طراحی شده است و استفاده از آن در سایر بازارها پیشنهاد نمیشود.
از بخش تنظیمات اندیکاتورمراحل زیر را انجام دهید:
1- میزان سرمایه خود را در قسمت بالانس وارد کنید
2- میزان ریسک سرمایه در هر معامله را مشخص کنید (به درصد)
3- میزان حد ضرر خود را مشخص کنید (به درصد)
4- میزان حد سود خود را مشخص کنید (به درصد)
5- عدد اهرم خود را وارد کنید
6- قیمت ورود به معامله را وارد کنید
توجه: قبل از استفاده این اندیکاتور در بازار لایو لطفا آن را تست کنید و از کارکرد صحیح آن با مدیریت سرمایه خود اطمینان حاصل فرمایید.

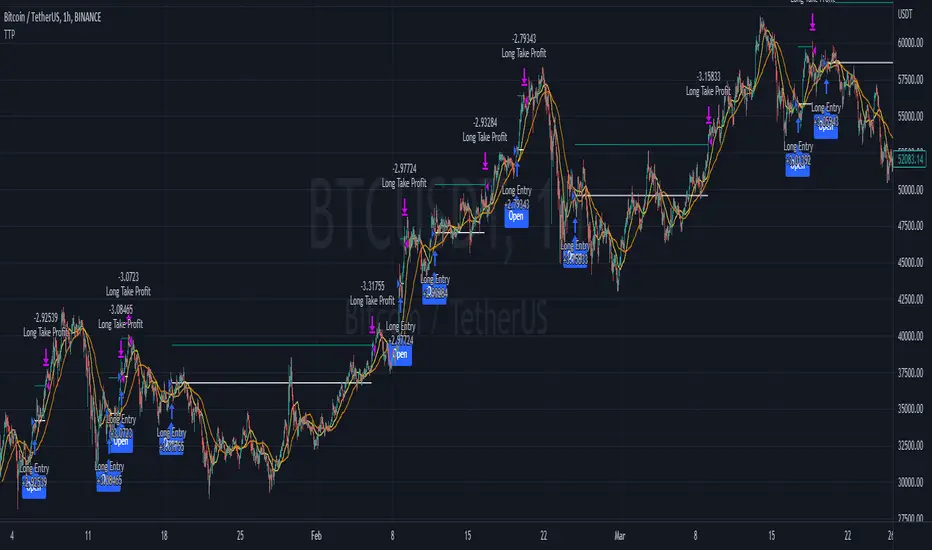
EMA+RSI Pump & Drop Swing Sniper (SL+TP) - StrategyThis is the strategy version of the 'EMA-RSI-Pump-Drop-Swing-Sniper-With-Alerts':
Some additions with this strategy:
~Added Stop loss & Take profit control. In Settings > Inputs if the Stop Loss is at .051 that means it's 5.1% and the Take Profit at .096 is 9.6%. If you wish to remove the TP and SL just change the value to 1.00 and it would be the same as it being 100% TP and SL which is likely to never be hit.
~Added Backtesting by changing the month/date/year in Settings > Inputs
~Added a 2nd EMA line to assist with the long entry signals. I only use this for long entry & exits, though you could use the long exits as Short entries too. I just personally don't do short trading on Bitcoin.
This is using an EMA and RSI with slightly modified settings to give good entry and exit points while looking at Bitcoin. I use this on a 1-hour and 4-hour chart and with other indicators to find good positions to enter a trade or exit if things are turning red.
It's important to know this strategy was made as a request by another user that was using the indicator version. I don't use this as a trading strategy by itself, I use the visuals it gives as a confirmation with other indicators to find the best possible entry and exit positions.
If you click on the EMA line it will color the bars of the chart based on if they are above or below the EMA - This is just visually helpful for me to see the active trend.
Make sure you hover over or click on the EMA line to see the colors of the candles change - it's not visible by default or without doing this.

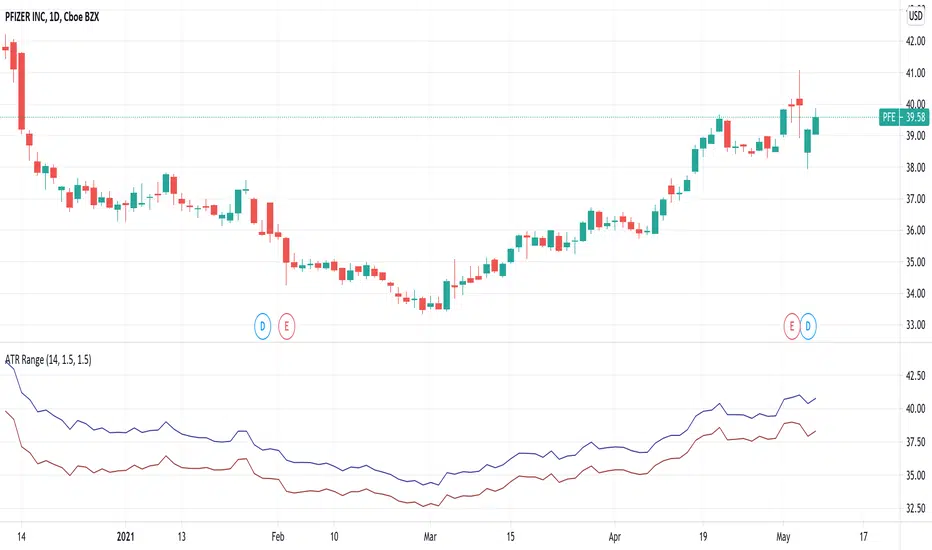
ATR RangeUseful in case you use Average True Range to determine Shows Stop Loss and Take Profit price levels.
For example, if you want to put Stop Loss with a distance of 1.5xATR and Take Profit 2xATR for a long trade, put 1.5 as Lower Factor and 2 as Upper Factor. Lower and Upper prices will show price levels for SL and TP respectively.
CRYPTO 3EMA Strategy with Take Profit & Stop Loss based on ATRSimple 3 EMA Strategy with plotted Take Profit and Stop Loss
Entry condition:
- Middle EMA cross above the Slow EMA
- Set take profit and stop loss exit conditions based on ATR Indicator
Exit condition:
- Fast EMA cross below the Middle EMA

Trailing Take ProfitThis script demonstrates how to do trailing take profit. With this approach instead of setting a limit order, when you hit the target you just follow the price upwards (for long positions) and you sell when the price drops by a small percentage. This approach will increase the profits (slightly) in every strategy! Be aware that the simulated data may produce unrealistic results.
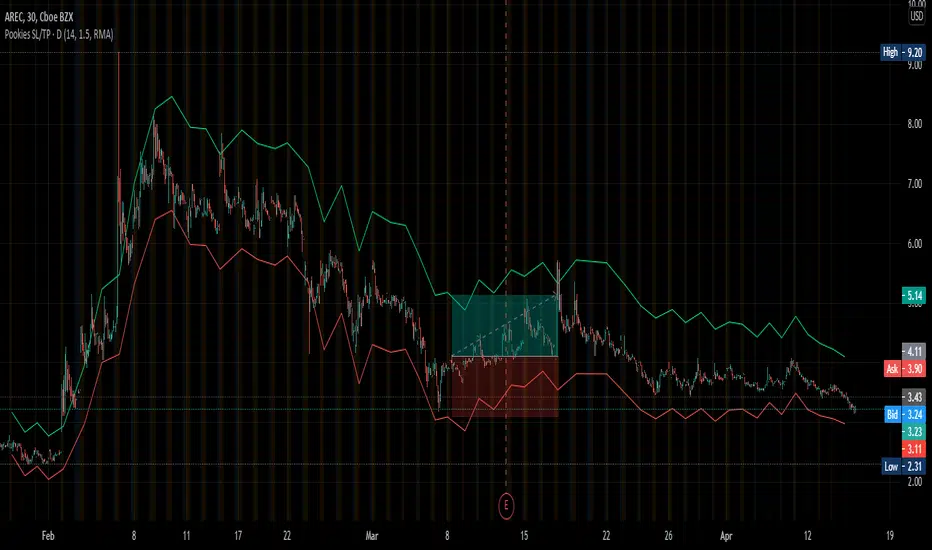
Pookies SL/TP LinesThis indicator calculates Stop-loss and Take-profit limits and plots them on the chart based on the daily ATR value for a given instrument.
The Stop-loss is calculated at the current close price minus 1x ATR and is plotted as a red line by default.
The Take-profit is calculated at the current close price plus 1.5x ATR and is plotted as a green line by default.
The colors for each line can be changed, as well as the default ATR values (length, smoothing).
To use:
When you see a long or short signal (your own preference), enter your position and set your take-profit and stop-loss limits at the current red/green lines, based on whatever Risk-Reward you've set it to.
This is also helpful in determining whether or not a trade offers enough potential to risk prior to entering the trade.
When the lines are far apart, the ATR is high. When the lines are close together, the ATR is low. This can be used to determine volatility and allow traders to buy during consolidation and sell into strength.
Thank you.
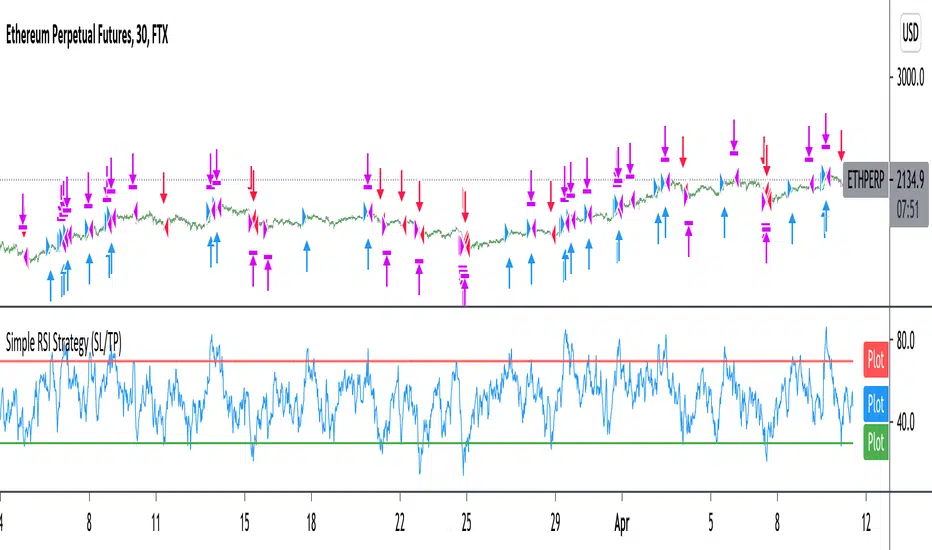
Improved simple RSI Buy/Sell at a level (SL/TP)Improved Simple Strategy based on RSI, using overbought or oversold levels.
Backtest: ETHPERP (FTX) - 30m
Set STOP LOSS and GET PROFIT as a percentage (2% and 10% by default).
If strategy.position_size != 0 algorithm convert percentages into points and set stop loss and take profit limit orders.

Scalping using RSI 2 indicator with TP and TSLThis study implements a simply scalping using the RSI (calculated on two periods), the slopes of two MAs (EMA or SMA) having different lengths (by default, I use 50 and 200).
A take profit (%) and a trailing stop loss (%) are used.
Entry conditions:
.) Fast MA > Slow MA and Price > Slow MA and RSI < Oversold Threshold ------> go Long
.) Fast MA < Slow MA and Price < Slow MA and RSI > Overbought Threshold ------> go Short
Exit conditions:
.) Long entry condition is true and (close >= TP or close <= TSL) ----> close short position
.) Short entry condition is true and (close <= TP or close >= TSL) ----> close long position
The strategy performed best on Bitcoin and the most liquid and capitalized Altcoins but works excellent on volatile assets, mainly if they often go trending.
Works best on 3h - 4h time frame.
There's also an optional Volatility filter, which opens the position only if the difference between the two slopes is more than a specific value, which can be set in the study inputs. The purpose is not opening positions if the price goes sideways and the noise is way > than the signal.
Note:
.) the RSI length is 2;
.) the oversold Threshold is 90%;
.) the overbought Threshold is 10%;
.) by default, the take profit per cent is 0.5%;
.) by default, the trailing stop loss per cent is 0.5%;
.) by default, the fast MA length is 50;
.) by default, the slow MA length is 200;
.) by default, the MA used is EMA.
Cheers.


Indicator - ATR Profit Loss - DGHi Traders,
This is an on chart indicator that can be used for setting take profit and stop losses very easily using the Average True Range Indicator (ATR). Using a volatility adjusted TP and SL will allow you to set your targets and losses based on market conditions. In the settings, you are able to adjust how much of a multiplier you require depending on your risk tolerance and strategy. For those that follow the NNFX method, the defult settings are preset to 1xATR TP and 1.5xATR SL.
How to use:
- For longs, 'isLong' box must be ticked, for shorts, this box is unticked
- For longs, green line is TP, red line is SL
- For shorts, red line is TP, green line is SL
Regards,
Dillon Grech

ATR BandsIt has happened to everybody. You enter the market, the position gets a stop loss, then later the market goes in the direction you originally planned. Worse yet - you enter a position, the market goes in your favor, gets near the target, and then it reverses and you get stopped.
We brazilians call this a "violinado", or getting violinated. It happens either because:
1. You put the stop loss too close, or the target too far
2. You entered in the right direction, but at a wrong time
While the second point cannot be programmly adressed, the first can. One popular way of setting a stop loss is by using the average of the true range, it even has a built-in indicator in TV. The problem with it is that you can still get violinated, since as the trend develops, the stop loss only goes up, never down. So if you enter at the wrong time, one slip can still take you out of the market.
Since I got sick of losing money using a conventional stop loss, I made these ATR bands. When you add this indicator to your graph, 6 lines are going to show up, 3 above the price, 3 below it. These lines are calculated from the ATR of the last 20 periods (can be configurated). The upper lines are the high of the last candle + the ATR * the multiplicator factor, the lower lines are the low - ATR * multiplicator factor. There are three multiplicator factors: 1.0, 1.618 and 2.0, and you change them to be whatever you want.
The logic behind it is that theses bands represents the region in which the market is more likely to stay. So if you enter the market at 50.00, you can't expect it to reach 500.00 in the next hour if the ATR is 5.00. And if you set the stop loss at 49.99, it is very likely that the market is going to stop you. By using the ATR bands, you can get a more reasonable price range, so you would set the stop loss at 45.00 and the take profit level at 60.00.
There are two types os ATR you can use: the regular, calculated with RMA, and another using a custom WMA, which puts greater emphasis on large amplitudes. By default, the average uses the past 20 true ranges. You can also choose to use either the closing price or the extremes of the candle as a basis.
Another thing I've added is the violation statistics, which shows the percentages of the times that a band was violated in the next 5 candles (can be configurated). With this, you can get a broader view on the probability of the bands actually being reached.
You may have notice that the bands are lagged by 1 period. I did this so that there is no way you can use future data. You can disable it or increase it, but I recommend just letting it be 1. These bands are the range in which the price is most likely to stay in, if you change the lag you are essentially breaking it's whole purpose.

Buy the Dips (by Coinrule)Taking your first steps into automated trading may be challenging. Coinrule's mission is to make it as easy as possible, also for beginners.
Here follows the best trading strategy to get started with Coinrule. This strategy doesn't involve complex indicators, yet was proved to be effective in the long term for many coins. Results seem to be improved when trading a coin vs Bitcoin.
The strategy buys the dips of a coin to sell with a profit. A stop-loss protects every trade.
Crypto markets offer high volatility and, thus, excellent opportunities for trading. Excluding times of severe downtrend, buying the dip is a simple and effective long-term trading strategy. The buy-signal is set to a 2% drop in a 30-minutes time frame.
Each trade comes with a take profit and a stop loss. Both set at 2%.
You can adjust these percentages to the market volatility as an advanced setup. You can backtest the outcomes using the backtesting tool from Tradingview
The strategy assumes each order to trade 30% of the available capital. A trading fee of 0.1% is taken into account. The fee is aligned to the base fee applied on Binance, which is the largest cryptocurrency exchange.

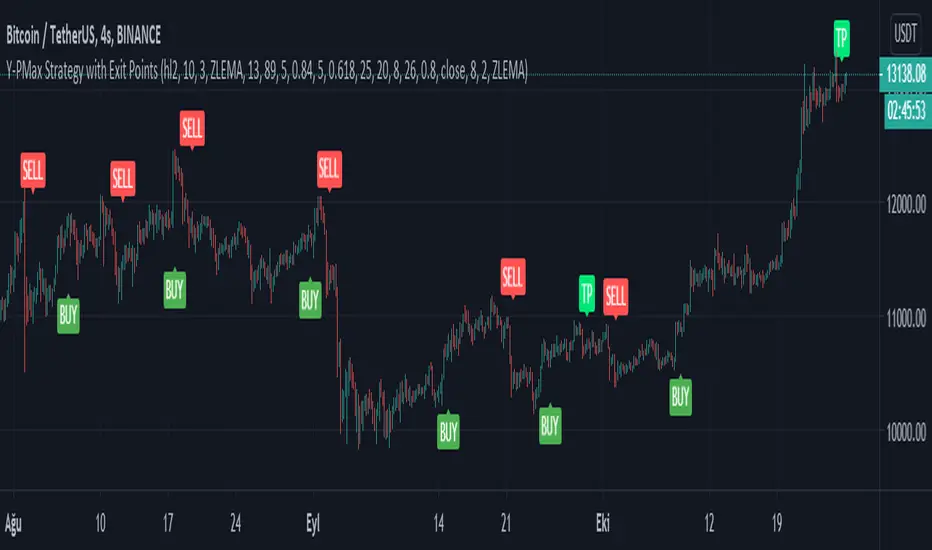
Y-Profit Maximizer Strategy with Exit PointsThis script based on KivancOzbilgic 's PMax indicator. I modified a bit. Added Filters, Exit (TP) Levels and few indicator in it. This script opening only Long Positions.
I have used this indicators in this strategy:
-Moving Stop Loss (Most) by ceyhun
-PMax Explorer STRATEGY & SCREENER
-Bollinger Bands on Macd
-Tillson T3 Moving Average by KIVANÇ fr3762
I am open to suggestions for improve this script.
PS: Script is in Turkish Language.
Triple ATR multiplier - 3 ATR Values in OneHere you can choose to plot 3 different ATR values in 1 window. I use this indicator to get the values of my stop loss and take profits.
You can change the multiplier value for each ATR Line and the length of the base ATR.
Ty

Trend trader StrategyFirst I would like to thank to @JustUncleL since this strategy started from one of his scalper strategies
This strategy can be adapted to all time charts .
First it has the session where we want to trade, for this example I choosed the EURUSD so I only take in consideration london/neywork session.
Its made from 3 EMA :
normal
slow
ultra slow
It has has the capacity to use HA candles into consideration if its needed.
At the same time we have a price channel made from faster MAs, that act like a bollinger band .
Together with all of them, we establish which trend we have if its uptrend or downtrend
Then we check the candles if they are below or above the MA , and based on the condition if they crossed recently we can suggest if its a buy or a long condition
At the same time we have 2 options of stop conditions:
Through a trailing stop made from ATR or % based
And second, a SL/TP made from pip points or % based.
For this example I used % based.
Let me know what you think about it, and if you found some nice settings for it. So far I only adapted to EURUSD 1 min time.

MACD VWAP IndicatorThis indicator uses a combination of the VWAP, EMA 9 and parts of the MACD in order to detect a bullish or bearish trend.
How to trade it:
Set SL either below or above the VWAP line (orange) and TP to 1:1.5 ratio (depending on last few candles, of course).
If EMA200 is close by then place SL either below or above EMA200 (blue) and TP to 1:1.5 ratio
Important:
Best traded in 15M, 30M => Intraday.
Have fun! :)
