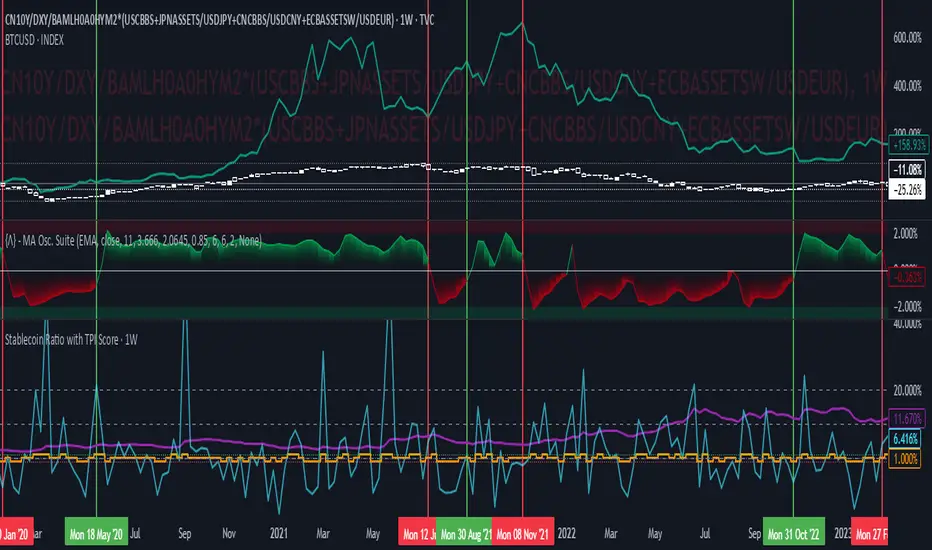
Stablecoin Ratio with TPI ScoreThe script measures the stablecoin ratio (total stablecoin market cap divided by total crypto market cap, times 100) and its weekly change. Stablecoins (e.g., USDT, USDC) are a key gateway for capital entering or exiting the crypto ecosystem.
A rising ratio suggests more capital is parked in stablecoins (potential buying power), while a falling ratio indicates capital leaving (selling or withdrawal).
In a macro analysis, this is critical—it reflects the availability of liquid funds that could fuel price movements.
In macroeconomics, liquidity is a driver of asset prices.
In crypto, stablecoins represent sidelined capital ready to deploy.
How does it work?
Stablecoin Ratio:
Formula: (total_stablecoin_mcap / total_crypto_mcap) * 100.
Example: If stablecoins = $235B and total market cap = $2.5T, ratio = 9.4%.
Plotted as a red line in the oscillator pane, showing the percentage of the market held in stablecoins.
Weekly Change:
Calculates the percentage change in the ratio from the previous week:
(current_ratio - previous_ratio) / previous_ratio * 100.
Example: Ratio goes from 9% to 10% = +11.11% change.
TPI Score Assignment:
+1 (Bullish): If the ratio increases by more than 5% week-over-week.
-1 (Bearish): If the ratio decreases by more than 5% week-over-week.
0 (Neutral): If the change is between -5% and +5%.
Plotted as orange step line bars in the oscillator pane, snapping to +1, 0, or -1.
Tpi
Volatility FilterThe "Volatility Filter" script is designed to measure market volatility across two different timeframes and determine whether the market is flat or trending.
It uses custom-tuned versions of four different indicators to measure volatility and distinguish between trending and ranging conditions.
The selected indicators are:
1 - Average Directional Index (ADX) Volatility
2 - Damiani Volameter
3 - Trader Pressure Index (TPI)
4 - Williams Alligator Indicator
The script calculates a filter score for both the current timeframe and a user-specified higher timeframe. It offers two types of filter scores, controlled by the 'FilterType' parameter. The filter score is then visualized on the chart as the main oscillator for the current timeframe and a filled bar for the higher timeframe.
The script utilizes a custom moving average function that provides 17 different ways to calculate a moving average, giving the user extensive flexibility in tailoring the script to their needs.
By using custom indicators and unique score calculation methods across two timeframes, this script provides a comprehensive measure of market volatility, aiding traders in identifying trending and ranging market conditions.
This script also provides two additional parameters for tuning its calculations and output, allowing to adjust the script to any trading style and the characteristics of the market being traded.
1 - Threshold: This parameter sets a threshold that the oscillator needs to surpass for the current market move to be considered as a trend. By adjusting the threshold, traders can control how much volatility is required to register a move as trending. A higher threshold will require more volatility for a trend to be recognized, meaning that the market needs to be moving more strongly for a trend to be identified.
2 - Length: This parameter is used to smooth the oscillator. It determines the number of periods used in the calculation of the moving average of the volatility filter score. A longer length will consider more data points and therefore provide a smoother line, which can be useful in accounting for the fading of trends. When trends start to lose their strength but are still present, a longer length can help in maintaining the recognition of the trend, aiding in making accurate trading decisions.
By adjusting these parameters, traders can fine-tune the script's sensitivity to market volatility and its recognition of trends, providing valuable flexibility in adapting to different market conditions and trading strategies.

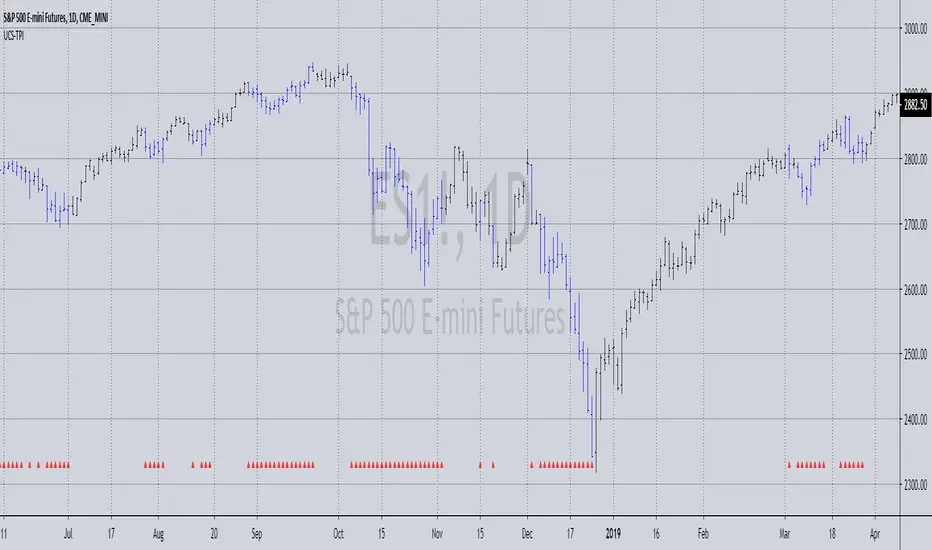
UCS_Trader Pressure Indicator -V1Welcoming everyone to a simple Indicator. I have used the volume of a stock to establish how commited the market for that particular ticker is when it comes to a direction.
The idea behind the indicator is how much of commitment there is towards a move.
*** This indicator is non directional*** ie., It just measures the commitment behind a move.
Why is it important.
Let's say we have a uptrending stock with low commitment (pressure), the bounce on any pullback will not be able carry that any further. So the pressure on the Pullback could drop the stock below and add additional risk. Only for us to wish and think, we checked that previously.
Essentially, If a Trend is being established with a strong pressure (VOLUME BASED). It is more likely to continue.
How you would use this is upto you. But general ideas in Some of these snapshots.
Concluding -
The trend in combination with TPI - Stronger Trend.
In such stronger trends - A pullback (oppsing the trend) have higher probability to bounce.
NOTE - Experiement with the indicator and Trade at your own risk This is a tool, not a system.
Feedbacks are welcome and will be considered for improvement.
Best Wishes