Dynamic Momentum BandsDynamic Momentum Bands
Introduction
The Dynamic Momentum Bands indicator is a powerful analytical tool designed to help traders identify the strength and direction of market momentum with greater precision. By combining key technical methodologies such as Relative Strength Index (RSI), adaptive volatility analysis, and customizable moving averages this indicator offers a multi-dimensional perspective on evolving market conditions. Whether in trending or ranging environments, Dynamic Momentum Bands aim to deliver actionable insights that enhance decision-making and risk management.
Key Features
Adaptive Band Calculation: The bands adjust dynamically in response to market conditions, allowing them to expand during volatile periods and contract during consolidation phases.
RSI-Driven Volatility Scaling: Integrates RSI analysis to scale the width of the bands based on momentum strength, creating a responsive and context-aware framework for trend evaluation.
Multiple Moving Average Options: Offers flexibility with various smoothing techniques, enabling users to tailor the indicator to their preferred strategies (e.g., EMA, SMA, WMA).
Smooth Gradient-Based Visualization: Enhances visual clarity with color gradients that reflect momentum intensity and directional bias, supporting intuitive interpretation of the market state.
How It Works
The Dynamic Momentum Bands indicator operates by combining three core components:
Adaptive Moving Averages: A central baseline is calculated using a selected moving average type. This baseline reflects the general price trend over a user-defined lookback period.
Volatility-Scaled Band Widths: Band distances from the central average are determined using an RSI-based volatility model. Higher RSI values and volatility readings cause the bands to widen, signaling stronger price momentum or potential breakouts.
Gradient Visualization: The bands are color-coded with gradient fills to reflect changes in momentum strength, providing real-time visual cues about potential trend shifts or exhaustion points.
This integration of methodologies allows the indicator to remain responsive to price action while maintaining a smooth, noise-filtered representation of market dynamics.
Conclusion
The Dynamic Momentum Bands indicator offers a versatile and insightful approach to tracking market momentum and volatility. Its adaptive design and multifactor methodology make it suitable for traders who seek a deeper understanding of price behavior beyond conventional moving average envelopes. By delivering a visually rich and responsive analysis tool, it empowers users to make more informed trading decisions across various market environments.
Disclaimer
This indicator is intended for educational and informational purposes only. It does not constitute financial advice or a recommendation to buy or sell any financial instrument. Users are advised to conduct their own analysis and consult with a licensed financial advisor before making any trading decisions.
Trader

MA Smoothed RSI For LoopMA Smoothed RSI For Loop
Introduction
The MA Smoothed RSI For Loop is a refined momentum indicator that enhances the classic Relative Strength Index (RSI) through advanced smoothing techniques and intelligent visual cues. By applying a moving average smoothing process within a for loop structure and integrating upper and lower threshold logic, this tool enables traders to detect trends with greater clarity and robustness. It is specifically built for traders who seek high-confidence signals through smoothed momentum analysis and contextual visual feedback.
Key Features
For Loop RSI Smoothing: Applies iterative moving average smoothing to the RSI using a for loop, reducing false signals and improving overall trend accuracy.
Threshold-Based Trend Detection: Incorporates upper and lower RSI thresholds to filter out weak signals and confirm strong momentum-driven trends.
Customizable Moving Averages: Supports a variety of moving average types (such as SMA, EMA, WMA) and lengths for tailored responsiveness.
Dynamic Color Feedback: Colors adapt based on RSI position and momentum, making it easy to interpret strength, reversal zones, or trend continuations.
Real-Time Trend Table: Trend Direction (uptrend/downtrend), Strength of Trend (based on RSI slope and threshold behavior) and Duration (number of bars in the current trend phase).
Weighted Loop Control: Allows users to apply weights during the smoothing loop, fine-tuning the indicator’s sensitivity.
How It Works
The indicator begins by computing the RSI from price data. It then enters a for loop where the RSI is repeatedly smoothed with a chosen moving average. This recursive process stabilizes the signal, minimizing the effects of short-term noise.
Upper and lower RSI thresholds are applied to define meaningful zones of momentum. Only when the smoothed RSI crosses and sustains beyond these thresholds is a trend considered significant. The direction and persistence of these movements are visually encoded using dynamic color schemes and captured numerically in the trend table.
This dual-layered method smoothing and threshold filtering provides a robust structure for identifying and monitoring meaningful price momentum.
Use Case
In the example described above we have one long and short positions early triggered once the momentum signal crossed its related threshold up in the case of bullish trend and down for the bearish one.
Conclusion
The MA Smoothed RSI For Loop offers a sophisticated approach to trend analysis by blending smoothed RSI logic with threshold-based confirmation and rich visual interpretation.
Disclaimer
This indicator is designed for educational and informational use only. It should not be construed as financial advice or a recommendation to trade. Always perform your own analysis and consult a qualified financial advisor before making investment decisions. Use at your own risk.

Dynamic Volume Profile OscillatorDynamic Volume Profile Oscillator
Introduction
The Dynamic Volume Profile Oscillator (DVPO) is an advanced technical analysis tool that merges volume profiling with price action dynamics to enhance trend identification and improve trade entry precision. Unlike conventional oscillators that rely solely on price-based metrics, DVPO incorporates adaptive volume-weighted mean deviations to present a more responsive and insightful perspective on market behavior. This makes it a powerful instrument for traders seeking refined momentum insights and context-aware overbought/oversold detection.
Key Features
Adaptive Volume Profiling: Utilizes real-time volume data to adjust the oscillator’s sensitivity to prevailing market activity, enabling more accurate trend and exhaustion zone identification.
Mean Reversion Mode: Highlights potential reversion points when price deviates significantly from volume-weighted norms, ideal for contrarian and range-bound strategies.
Oscillator Smoothing: Integrates optional smoothing filters to reduce noise and provide clearer directional signals without sacrificing responsiveness.
Dynamic Midline & Zones: Features an evolving midline calibrated to the current volume-weighted context, along with dynamically adjusting overbought and oversold zones.
Signal Crossovers: Generates actionable momentum signals when the oscillator crosses key thresholds or the midline, aiding in timing entries and exits.
Gradient Zone Visualization: Visually represents intensity and directional bias through gradient color zones, helping users quickly assess momentum strength and market condition shifts.
How It Works
The DVPO calculates deviations from a volume-weighted average price baseline across a defined lookback period. These deviations are then transformed into an oscillator that fluctuates above and below a dynamic midline, which represents the fair value zone based on recent volume distribution.
To enhance interpretability, the indicator introduces:
Dynamic Zones that expand or contract based on current volatility and volume skewness.
Smoothing algorithms (optional) that can be applied to reduce erratic movements caused by sudden spikes in volume.
Gradient coloring to reflect the strength and direction of the momentum — darker tones indicate stronger trends, while lighter ones suggest potential reversals or weakening trends.
Crossover logic that detects when the oscillator line crosses above or below the midline or critical thresholds, often coinciding with trend initiations or reversals.
Conclusion
The Dynamic Volume Profile Oscillator offers a significant enhancement to traditional momentum indicators by intelligently adapting to both price and volume shifts. Whether used for trend following, mean reversion, or breakout confirmation, its comprehensive design provides traders with an intuitive yet powerful edge in identifying actionable market signals across varying conditions.
Disclaimer
This indicator is intended for educational and informational purposes only. It does not constitute financial advice or a recommendation to buy or sell any financial instrument. Users should perform their own due diligence and consult a qualified financial advisor before making any trading decisions.

Multi-Oscillator Adaptive KernelMulti-Oscillator Adaptive Kernel
Introduction
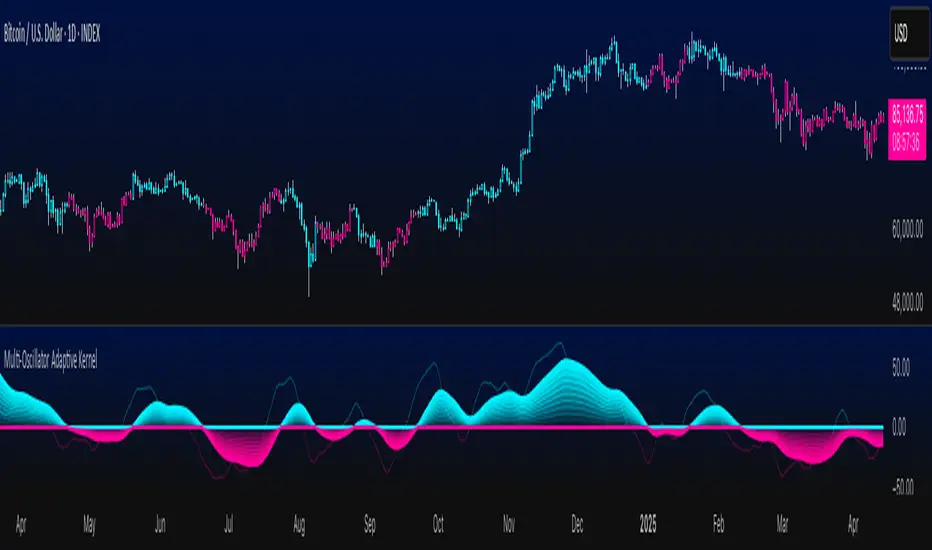
The Multi-Oscillator Adaptive Kernel (MOAK) is a powerful momentum-based indicator that fuses multiple popular oscillators RSI, Stochastic, MFI, and CCI into a single, adaptive tool. Through advanced kernel smoothing techniques, MOAK is engineered to filter out market noise and deliver clearer, more consistent trend signals. Whether in trending or ranging markets, MOAK equips traders with a holistic perspective on momentum across multiple timeframes.
Key Features
Oscillator Fusion: Combines normalized values from RSI, Stochastic, Money Flow Index, and Commodity Channel Index to capture broader momentum shifts.
Advanced Kernel Smoothing: Utilizes three kernel smoothing algorithms—Exponential, Linear, and Gaussian—to refine raw oscillator data and minimize false signals.
Customizable Sensitivity: Traders can tailor the indicator's responsiveness by adjusting lookback periods, kernel lengths, and smoothing sensitivity.
Clear Visual Signals: Features a color-coded signal line—cyan for bullish, magenta for bearish—with gradient fills to reflect trend intensity and direction.
Overbought/Oversold Zones: A central zero line helps identify momentum extremes, with layered gradients to indicate the strength of potential reversals or continuations.
Adaptive Signal Design: Dynamically adjusts its output to align with changing market conditions, offering reliable performance across diverse market environments.
How It Works
MOAK starts by calculating and normalizing input from four widely used momentum oscillators: Relative Strength Index (RSI), Stochastic Oscillator, Money Flow Index (MFI), and Commodity Channel Index (CCI). These values are then aggregated to form a composite momentum reading.
To reduce market noise and enhance signal clarity, the composite reading is passed through one of three user-selectable kernel smoothing filters—Exponential, Linear, or Gaussian. These algorithms shape the data curve, softening abrupt fluctuations while preserving meaningful trends.
The resulting smoothed output is rendered visually as a central signal line, colored cyan for upward momentum and magenta for downward momentum. A series of gradient fills around this line illustrates the intensity of the underlying momentum, with the zero line acting as a visual boundary between overbought and oversold regions. Users can customize key parameters such as lookback window, kernel length, and sensitivity level, ensuring the indicator can be optimized for different assets and trading styles.
Examples
MOAK is able to provide clear trend detection on large cap token such as Bitcoin in the example shown below and resistant to noise during consolidation period.
Downside positions are also handled by the indicator, this time on Solana which is more volatile than Bitcoin but even with more volatility MOAK was able to catch an early entry in the downside move.
Below an example on a lower timeframe with a low cap token Fartcoin where MOAK triggered an early entry on a positive uptrend.
Conclusion
MOAK is a sophisticated yet intuitive momentum indicator, merging the strengths of multiple oscillators into a cohesive and adaptive signal. Its kernel-based smoothing and customizable parameters make it a valuable tool for traders seeking to identify trend direction, assess momentum strength, and filter out short-term noise with precision. Ideal for both trend-following and range-trading strategies, MOAK offers a versatile edge in dynamic market conditions.
Disclaimer
This indicator is provided for informational and educational purposes only. It does not constitute financial advice, nor does it guarantee specific results. Always perform your own analysis and consult a licensed financial advisor before making any trading decisions. Use at your own risk.
DEMA SuperTrendDEMA SuperTrend
Introduction
The DEMA SuperTrend is a sophisticated trend-following indicator that integrates the speed and smoothness of the Double Exponential Moving Average (DEMA) with the classic SuperTrend methodology. Designed for traders seeking a more responsive alternative to standard trend indicators, the DEMA SuperTrend helps identify the prevailing market direction with minimal lag. It plots directly on the price chart, making it intuitive and accessible for real-time analysis across various timeframes and trading instruments.
Key Features
DEMA-Based Smoothing: Enhances traditional SuperTrend signals by applying DEMA, reducing signal lag and improving responsiveness to market changes.
Dynamic Trend Visualization: Clearly marks uptrend and downtrend phases with adaptive bands that follow price action.
Customizable Inputs: Users can tailor the ATR period, multiplier, and DEMA length to suit their strategy and trading style.
Visual Themes: Custom color schemes and line styles offer a personalized charting experience, supporting better clarity and decision-making.
How It Works
The DEMA SuperTrend calculates the Average True Range (ATR) to measure market volatility and applies a multiplier to determine the band offset. Instead of using a standard moving average, it employs the Double Exponential Moving Average to smooth the price series. The result is a responsive overlay that adjusts more quickly to market shifts compared to the traditional SuperTrend.
Uptrend: Triggered when the price closes above the DEMA-adjusted upper band.
Downtrend: Triggered when the price closes below the DEMA-adjusted lower band.
Band Switching: When a crossover occurs, the indicator switches the band to the opposite side of the price, signaling a potential change in trend direction.
Visual cues and color-coded zones on the chart enhance interpretability, making it easier for traders to react promptly to shifts in momentum.
Conclusion
The DEMA SuperTrend indicator combines the best of both worlds—robust trend-following logic and advanced smoothing—offering traders a powerful tool for identifying and tracking market trends with enhanced accuracy. Its versatility, responsiveness, and customization features make it suitable for both intraday and swing trading strategies.
Disclaimer
This indicator is intended for educational and informational purposes only. It does not constitute financial advice or a recommendation to buy or sell any financial instrument. Users should conduct their own research and risk assessment before making trading decisions.

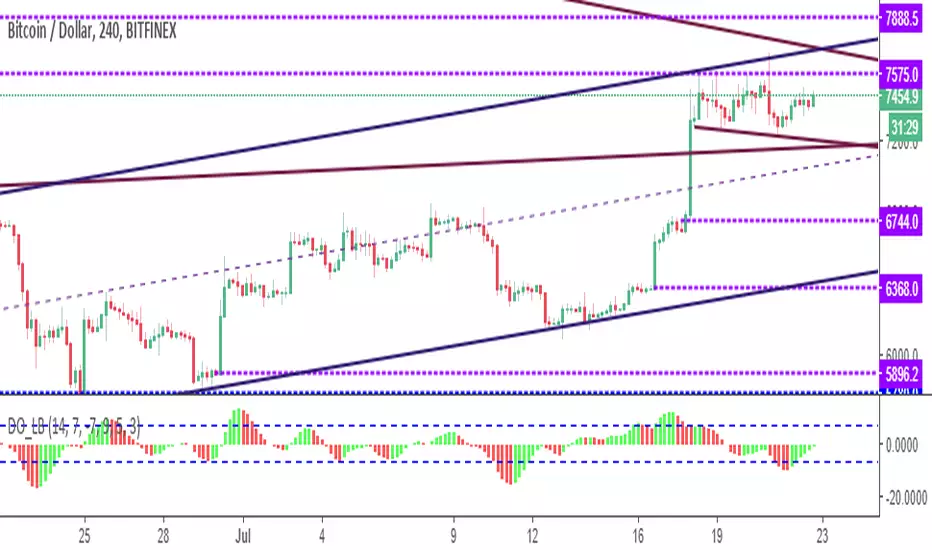
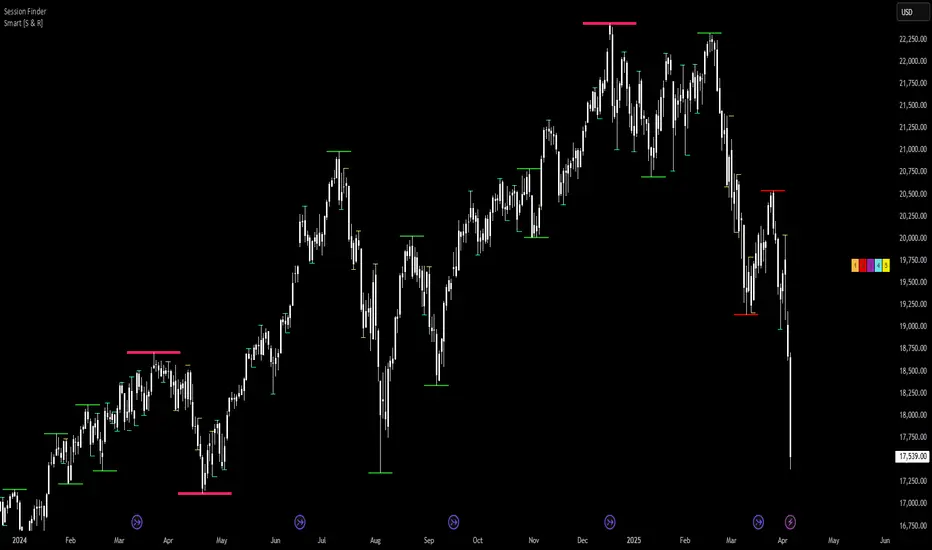
TQ's Support & Resistance(My goal creating this indicator): Provide a way to categorize and label key structures on multiple different levels so I can create a plan based on those observable facts.
The Underlying Concept / What is Momentum?
Momentum indicates transaction pressure. If the algorithm detects price is going up, that would be considered positive momentum. If the algorithm detects price is going down negative momentum would be detected.
The Momentum shown is derived from a price action pattern. Unlike my previous Support & Resistance indicator that used Super Trend, this indicator uses a unique pattern I created. On the first bar bearish momentum is detected a resistance Level is made at the highest point of the previous bullish condition. On the first bar bullish momentum is detected a support Level is made at the lowest point of the previous bearish condition. This happens on 5 different Momentum Levels, (short-term to long-term). I currently use this pattern to trade so the source code is protected.
What is Severity?
Severity is How we differentiate the importance of different Highs and Lows. If Momentum is detected on a higher level the Supply or Demand Level is updated. The Color and Size representing that Level will be shown. Demand and Supply Levels made by higher levels are more SEVERE than a demand level made by a lower level.
Technical Inputs
- to ensure the correct calculation of Support and Resistance levels change BAR_INDEX. BAR_INDEX creates a buffer at the start of the chart. For example: If you set BAR_INDEX to 300. The script will wait for 300 bars to elapse on the current chart before running. This allows the script more time to gather data. Which is needed in order for our dynamic lookback length to never return an error (Dynamic lookback length can't be negative or zero). The lower the timeframe the greater the number of bars need. For Example, if I open up a 1min chart I would enter 5000 as my BAR_INDEX since that will provide enough data to ensure the correct calculation of Support and Resistance levels. If I was on a daily chart, I would enter a lower number such as 800. Don't be afraid to play around with this.
- Toggle options (Close) or (High & Low) creates Support and Resistance Levels using the Lowest close and Highest close or using the Lowest low and Highest high.
Level Inputs
- The indicator has 5 Different Levels indicating SEVEREITY of a Supply and Demand Levels. The higher the Level the more SEVERE the Level.
Display Inputs
- You have the option to customize the Length, Width, Line Style, and Colors of all 5 different
- This indicator includes a Trend Chart. To Easily verify the current trend of any displayed by this indicator toggle on Chart On/Off. You also get the option to change the Chart Position and the size of the Trend Chart
How Trend Is being Determined?
(Close > Current Supply Level) if this statement is true technically price made a HH, so the trend is bullish.
(Close < Current Demand Level) if this statement is true technically price made a LL, so the trend is bearish.
- Fully customize how you display Market Structure on different levels. Line Length, Line Width, Line Style, and Line color can all be customized.
How it can be used?
(Examples of Different ways you can use this indicator): Easily categorize the severity of each and every Supply or Demand Level in the market (The higher Level the stronger the level)
: Quickly Determine the trend of any Level.
: Get a consistent view of a market and how different Levels are behaving but just use one chart.
: Take the discretion from hand drawing support and resistance lines out of your trading.
: Find and categorize strong levels for potential breakouts.
: Trend Analysis, use Levels to create a narrative based on observable facts from these Levels.
: Different Targets to take money off the table.
: Use Severity to differentiate between different trend line setups.
: Find Great places to move your stop loss too.
BeSight Mega SpotBeSight Mega Spot – Zone Based Price Grid Indicator
สคริปต์นี้ถูกออกแบบมาเพื่อช่วยเทรดเดอร์มองเห็นโซนราคาสำคัญที่ราคาอาจเกิดปฏิกิริยา โดยอ้างอิงจากระดับราคาที่ลงท้ายด้วย 0 และ 5 (เช่น 1350, 1355, 1360 เป็นต้น) ซึ่งมักเป็นระดับที่มีการตั้งคำสั่งซื้อขายจำนวนมากในตลาด
BeSight Mega Spot – Zone-Based Price Grid Indicator
This indicator is designed to help traders visualize key price zones where the market often reacts, based on price levels ending with 0 or 5 (e.g., 1350, 1355, 1360). These levels are commonly used for pending orders, liquidity, or price clustering zones.
It displays horizontal grid lines at fixed step intervals (default: every 5 points), covering the entire visible price range of the chart. Each price level is labeled for better clarity and planning.
🟦 Blue lines: Price levels ending in 0
⬜ Gray lines: Price levels ending in 5
This tool is useful for identifying potential institutional behavior zones, price consolidation, accumulation/distribution areas, or psychological support/resistance levels.
🧠 Notes:
- This indicator is not a buy/sell signal tool or predictive system.
- It works best when used in conjunction with other technical tools such as Supply/Demand zones or Smart Money Concepts (SMC) analysis.
- Compatible with all instruments: stocks, futures, forex, crypto, etc.
✅ How to use:
1. Add the indicator to your chart
2. Observe how price interacts with the 0/5 grid zones
3. Use the lines to assist with breakout, retest, or reversal planning
4. Combine with price action or other indicators for higher precision
✨ Developed by BeSight – A Community Of Traders
---------------------------------------------------------------------------------------
อินดิเคเตอร์นี้จะแสดงเส้นแนวนอนแบบตาราง (Grid) ที่แบ่งช่วงราคาออกเป็นระยะ ๆ ตามค่าที่ผู้ใช้กำหนด เช่น ทุก ๆ 5 จุด และครอบคลุมช่วงราคาทั้งหมดของกราฟ โดยแสดงเป็นเส้นแบบ dotted พร้อมป้ายราคาเพื่อให้มองเห็นได้ชัดเจน
🟦 เส้นสีน้ำเงิน: แสดงระดับราคาที่ลงท้ายด้วย 0
⬜ เส้นสีเทา: แสดงระดับราคาที่ลงท้ายด้วย 5
เหมาะสำหรับผู้ที่ต้องการดูโซนราคา "หยุดพัก / เก็บของ / เปิดโพซิชัน" ซึ่งอาจสะท้อนพฤติกรรมของผู้เล่นรายใหญ่หรือสถาบันในตลาด
🧠 ข้อควรรู้:
- อินดิเคเตอร์นี้ไม่ได้บอกจุดเข้าเทรดหรือการคาดการณ์ แต่ช่วยในการวางแผนแนวรับ-แนวต้านร่วมกับเครื่องมือวิเคราะห์อื่น ๆ
- รองรับทุกสินทรัพย์ที่มีหน่วยราคาคงที่ (หุ้น, ฟิวเจอร์ส, ฟอเร็กซ์, คริปโต ฯลฯ)
✅ วิธีใช้งาน:
1. เพิ่มอินดิเคเตอร์นี้ลงบนกราฟ
2. ใช้เส้น Grid เป็นแนวประกอบในการดูพฤติกรรมราคา เช่น การหยุดลง, การเบรกแนว, การกลับตัว
3. ผสมผสานกับโซน Demand/Supply หรือโซน SMC เพื่อความแม่นยำ
✨ พัฒนาโดย BeSight – คอมมูนิตี้ของเทรดเดอร์ตัวจริง

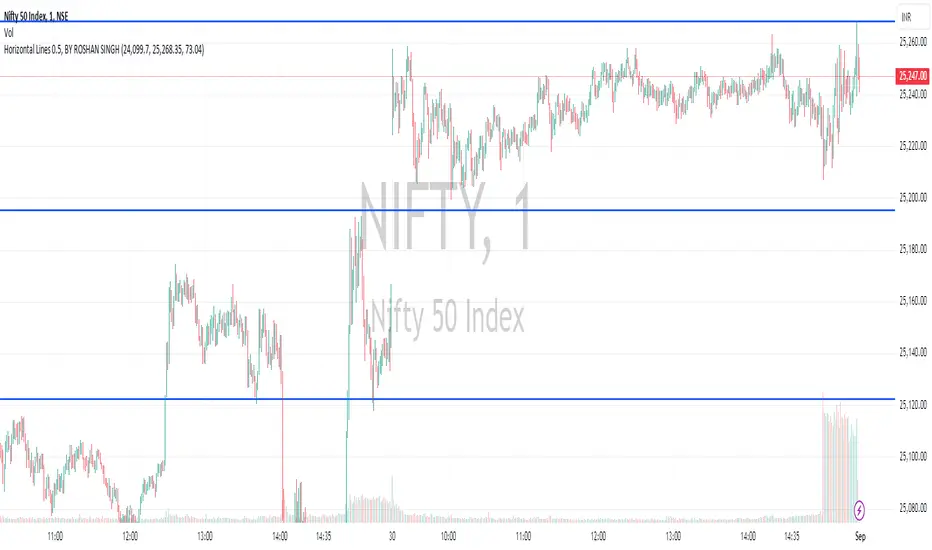
Horizontal Lines 0.5, BY ROSHAN SINGHThis indicator identify support and resistance to trade in 1min time frame, based of fib 0.5 level, on 15 min time frame find major high and low means major swing, low will be our start level and high will be our end level input in setting, substract high and end level and now divide answer with 2 till the daily volatility of a index or stock, if saying about nifty suppose nifty daily travel minimum for 65 pts then interval will be 65 input in settings, now all horizontals lines means support and level will be plotted on chart, buy on support, sell on resistance
K's Reversal Indicator IIK’s Reversal Indicator II uses a moving average timing technique to deliver its signals. The method of calculation is as follows:
* Calculate a moving average (by default, a 13-period moving average).
* Calculate the number of times where the market is above its moving average. Whenever that number hits 21, a bearish signal is generated, and whenever that number if zero, a bullish signal is generated.
The indicator signals short-term to mid-term reversals as a mean-reversion move.

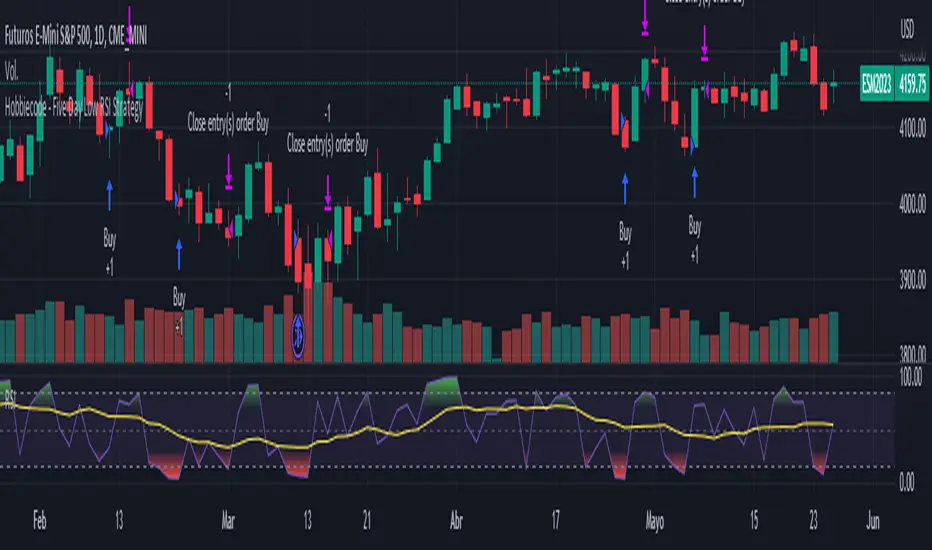
Hobbiecode - Five Day Low RSI StrategyThis is a simple strategy that is working well on SPY but also well performing on Mini Futures SP500. The strategy is composed by the followin rules:
1. If today’s close is below yesterday’s five-day low, go long at the close.
2. Sell at the close when the two-day RSI closes above 50.
3. There is a time stop of five days if the sell criterium is not triggered.
If you backtest it on Mini Futures SP500 you will be able to track data from 1993. It is important to select D1 as timeframe.
Please share any comment or idea below.
Have a good trading,
Ramón.
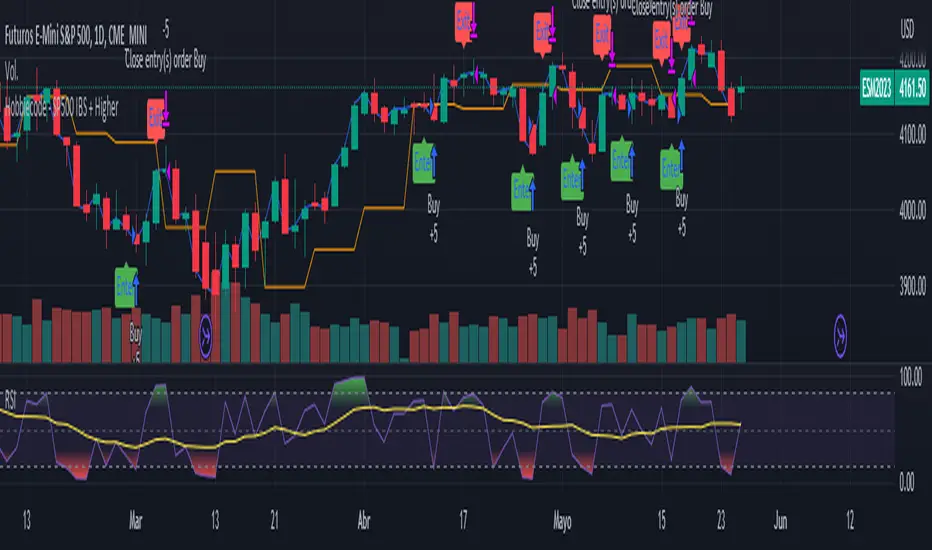
Hobbiecode - SP500 IBS + HigherThis is a simple strategy that is working well on SPY but also well performing on Mini Futures SP500. The strategy is composed by the followin rules:
1. Today is Monday.
2. The close must be lower than the close on Friday.
3. The IBS must be below 0.5.
4. If 1-3 are true, then enter at the close.
5. Sell 5 trading days later (at the close).
If you backtest it on Mini Futures SP500 you will be able to track data from 1993. It is important to select D1 as timeframe.
Please share any comment or idea below.
Have a good trading,
Ramón.
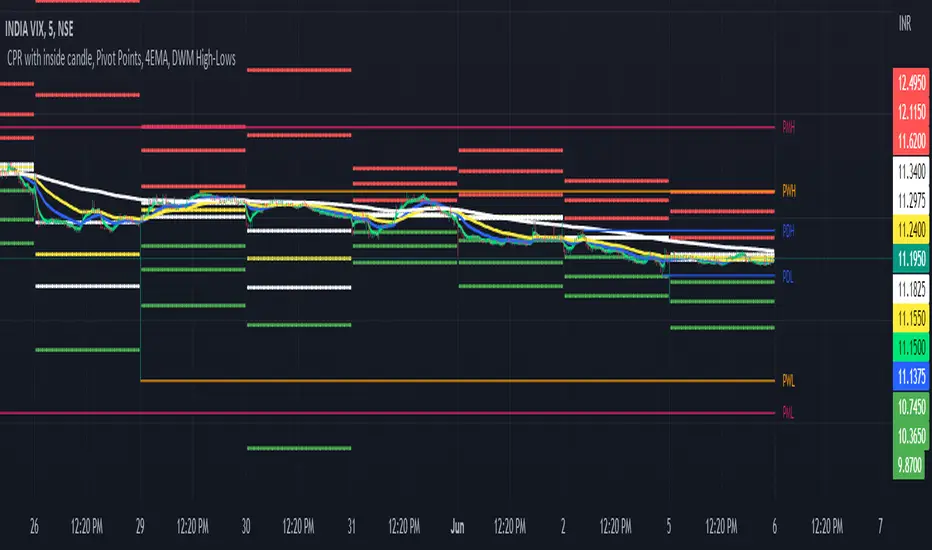
CPR with inside candle, Pivot Points and 4EMA The CPR trading strategy is a technical analysis approach that combines multiple indicators to determine potential price levels and trading opportunities. The strategy uses three main components: Inside Candles, Pivot Points, and the 4EMA.
Inside Candles: The Inside Candle pattern is a candlestick pattern where the current candle has a lower high and a higher low than the previous candle. This pattern can indicate a period of consolidation or indecision in the market and can signal a potential reversal or continuation of the trend.
Pivot Points: Pivot Points are technical indicators that use the previous day's price data to calculate key levels of support and resistance for the current trading day. These levels can act as potential areas of buying or selling pressure and can help traders identify potential entry and exit points.
4EMA: The 4EMA is a short-term Exponential Moving Average that tracks the average price of an asset over the previous four periods. This indicator is used to help identify short-term trends in the market and can signal potential buying or selling opportunities.
To apply the CPR strategy, traders first look for Inside Candles on their chart, indicating a period of consolidation or indecision in the market. Next, they identify the Pivot Points for the current trading day, which can act as potential areas of support or resistance. Finally, traders use the 4EMA to confirm the direction of the trend and potential entry or exit points.
For example, if an Inside Candle forms at a Pivot Point level and the 4EMA is indicating an uptrend, this could be a potential buying opportunity. Conversely, if an Inside Candle forms at a Pivot Point level and the 4EMA is indicating a downtrend, this could be a potential selling opportunity.
Setup Max e Min Larry WilliansLarry Williams used this system to win the trading championship
Hello friends, I bring a script with a trading strategy to be used in futures such as Index, Forex and Commodities. Developed by famous trader Larry Williams.
In them we use two 3-period Simple Moving Averages (Arithmetic) (one with the high price, the other with the low price), and a 21-period Moving Average (Arithmetic) to determine the trend. This will form an average channel with the prices of the maximums and minimums of the last three candles.
Best time charts use the strategy: from 5 minutes to 60 minutes.
This strategy is quite simple. The 21 Moving Average will color according to the trend (Green for bullish, Red for bearish and Gray for transitions). The Script will signal the entry according to the trend by the colors of the candles and also by the signal:
When green, the buy will be on the crossing of the lower Moving Average crossing the candlestick, and the exit will be on the crossing of the candlestick on the next Upper Moving Average.
When red, the sell will be at the crossing of the Upper Moving Average crossing the candlestick, and the exit will be at the crossing of the candlestick on the next Lower Moving Average.
When the Script signals the candle with a purple X, it means that the trend is changing and the entire open operation must be closed.
This system has no Stop, so be careful when using it.
Na linguagem do autor:
Larry Williams usou esse sistema ganhar campeonato de trade
Olá amigos, trago um script com uma estratégia de trade pra ser usada em futuros como Índice, Forex e Commodities. Desenvolvido pelo famoso trader Larry Willians.
Neles usamos duas Médias Móveis Simples (Aritmética) de 3 períodos (uma com o preço da máxima, outra com o preço da mínima), e uma Média Móvel (Aritmética) de 21 períodos para determinar a tendência. Nisso vai formar uma canal de médias com os preços das máximas e mínimas dos últimos três candles.
Melhores tempos gráficos usar a estratégia: de 5 minutos até 60 minutos.
Essa estratégia é bem simples. A Média Móvel de 21 irá colorir de acordo com a tendência (Green pra alta, Red para baixa e Gray para transições). O Script irá sinalizar a entrada de acordo com a tendência pela cores dos candles e também pela sinalização:
Quando green, a compra será no cruzamento da Média Móvel inferior cruzando o candle, e a saida será no cruzamento do candle na Média Móvel Superior seguinte.
Quando red, a venda será no cruzamento da Média Móvel Superior cruzando o candle, e a saida será no cruzamento do candle na Média Móvel Inferior seguinte.
Quando o Script sinaliza o candle com X purple, significa que a tendência está em mudança e deve ser fechada toda a operação em aberto.
Este sistema não possui Stop, portando cuidado quanto a seu uso.

Auto Order Block by D. BrigagliaThis indicator finds trend following engulfings, and draws order blocks based on the 1st candle's range (the first candle of the engulfing pattern).
It does filter the trend with simple moving averages of 21 and 55 periods, but it doesn't filter for retracements in the trend (you should consider only the order blocks that are coming from engulfings after a retracement)

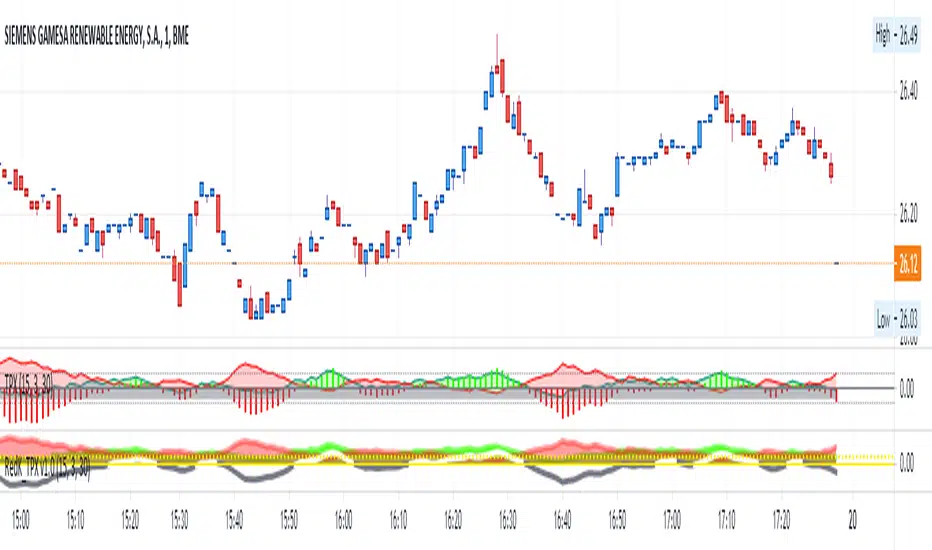
Trader Pressure Index (TPX)This is my take on the script by RedK
I kept the algorithm exactly the same, but changed the layout and the default look back period. Most important is that the resulting line, the TPX, is now a histogram with green and red staves.
To put the histogram on a logical place in the graph, I changed the way the control/dominance level is implemented, it now lowers or highers the whole graph, this way the zero level becomes the ‘no interest’ level.
I added two horizontal lines at a distance of 40 because I feel that this is sort of an oversold / overbought indication. In practice not very convincing, but provides a visual comparison.
In this layout I explain that grass is growing on bull hills peaking up behind the foreground and blood is dripping from the bear hills.
Enjoy.
VT R Cloudsettings for the VT R Indicator
VT R TIme (Minues) = 10
Session Time = 09:25 - 09:35
Show VT R Ticked
Show VWMA Ticked
VWMA Period = 10
Long Trade Rules
1. Close ABove buy above
2. trade above ma
3. volume > ma (volume Settings Given Below)
4. sl below sell below
Short Trade Rules
1. close below sell below
2. trade below ma
3. volume > ma (volume Settings Given Below)
4. sl above buy above
Volume Indicator has to be added manually i suggest to use the default Volume Indicator
Settings for the Volume Indicator
Lookback = 10
ShowMA Ticked
LengthMA = 10

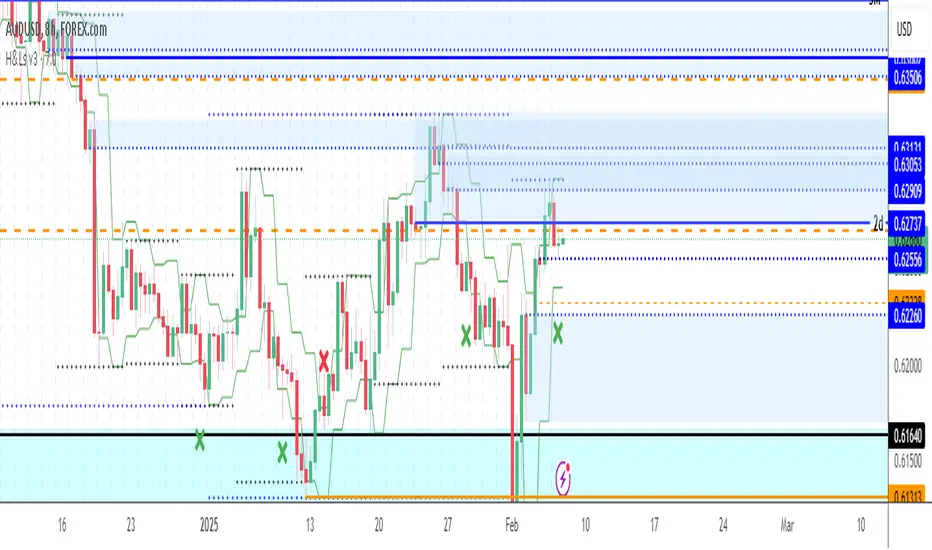
FibBand, Perfect Trendline Trader and Target SystemSo, Dear Friends, I am open-sourcing one of my scripts which I created as a thesis project,
The Auto Trader System is a Scalping Tool , to be used mostly in intraday Setups!!
and is designed using,
1. Fibonacci Bands
Fibo Bands are Calculated by defining dynamic Fibonacci Pivots Lines over a history of Lookup values (Default is 89 periods lookback),
The bands help in identifying the Target Points for the setup
2. Perfect TrendLine Setup
The script uses PTS, as a filter to define the optimum entry and exit points
Which timeframe it works for ?
Works for Any Time Frame, but Intraday setups are good!
Who is this System for ?
Beginner and Intermediate Traders
Provision For Alerts
The Script has provision for both long and short alerts!!
Enjoy!

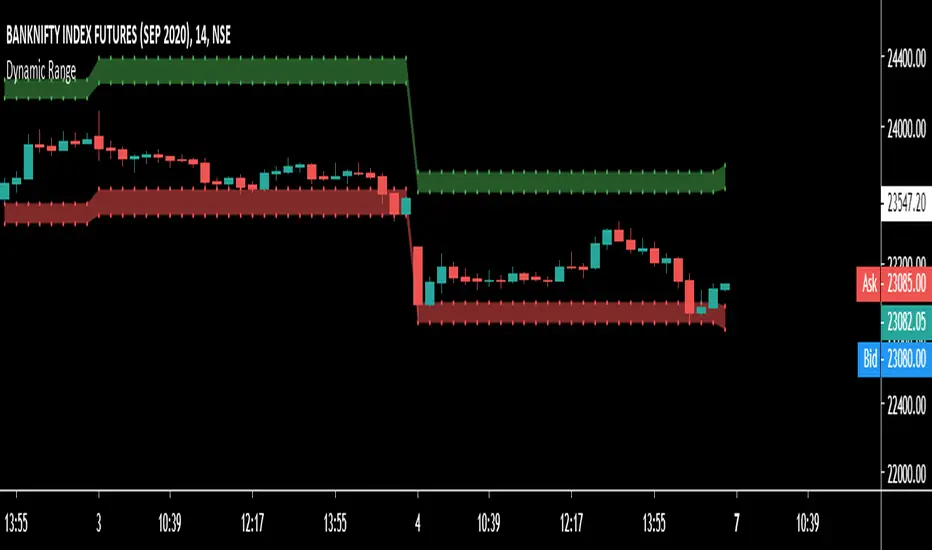
Dynamic Range here comes open source version of notorious JFT Indicator ( the indicator access you can get in some bucks ) on various telegram channels however they will not give code.
Now how it works
1. 2 ranges derived from indicator are supposed to be a consolidation zone and any close above or below is supposed to give a good move.
2. I personally consider it as may be addition to price analysis. ( i don't believe much in indicators,even simple MA gives fruitful results when there is good move in market )
3. Range can be drawn on chart with various resolution ( Daily/Monthly/Weekly )
PS: I coded myself based on data analysis shown by access only indicator. In case you use it for your publication don't forget to give credits.
Thanks,
daytraderph
Weekend Trader Smoothed Rate of Change
Rate of change indicator based on Nick Radge's Weekend Trend Trader Strategy, with an added extra of EMA smoothing if you want it.
This indicator simply turns green when the rate of change is above a certain level (value is set in threshold)
Threshold is defaulted to 30 as outlined in the strategy rules

Index Trend Filter - Weekend Trend TraderThis little script simply gives you a quick visual cue of where price is compared to a particular EMA of another security or underlying index.
It is based on Nick Radge's broader market filter weekend trend trader system, but can be applied to other timeframes if you want to confirm if the index is in an up trend or down trend.
• Green means the underlying index price is above the EMA
• Red means the underlying index price is below the EMA

UCS_Trader Pressure Indicator -V1Welcoming everyone to a simple Indicator. I have used the volume of a stock to establish how commited the market for that particular ticker is when it comes to a direction.
The idea behind the indicator is how much of commitment there is towards a move.
*** This indicator is non directional*** ie., It just measures the commitment behind a move.
Why is it important.
Let's say we have a uptrending stock with low commitment (pressure), the bounce on any pullback will not be able carry that any further. So the pressure on the Pullback could drop the stock below and add additional risk. Only for us to wish and think, we checked that previously.
Essentially, If a Trend is being established with a strong pressure (VOLUME BASED). It is more likely to continue.
How you would use this is upto you. But general ideas in Some of these snapshots.
Concluding -
The trend in combination with TPI - Stronger Trend.
In such stronger trends - A pullback (oppsing the trend) have higher probability to bounce.
NOTE - Experiement with the indicator and Trade at your own risk This is a tool, not a system.
Feedbacks are welcome and will be considered for improvement.
Best Wishes

Highs and Lows (Previous Days Projected + Current Week & Month)Credit to Lachlan Smith created original on 31/03/15 - Edited by Elisa 30/3/19
Historical highs and lows
Includes three previous days projected onto today, plus current week and month.
Settings allow for data to be hidden after weekends for use in traditional markets. (i.e. prior 2 days not useful on a Monday)
Derivative OscillatorCredit to Lazy Bear for the original script and Constance Brown for the indicator.
Added horizontals to better compare heights of peaks and minor format changes.