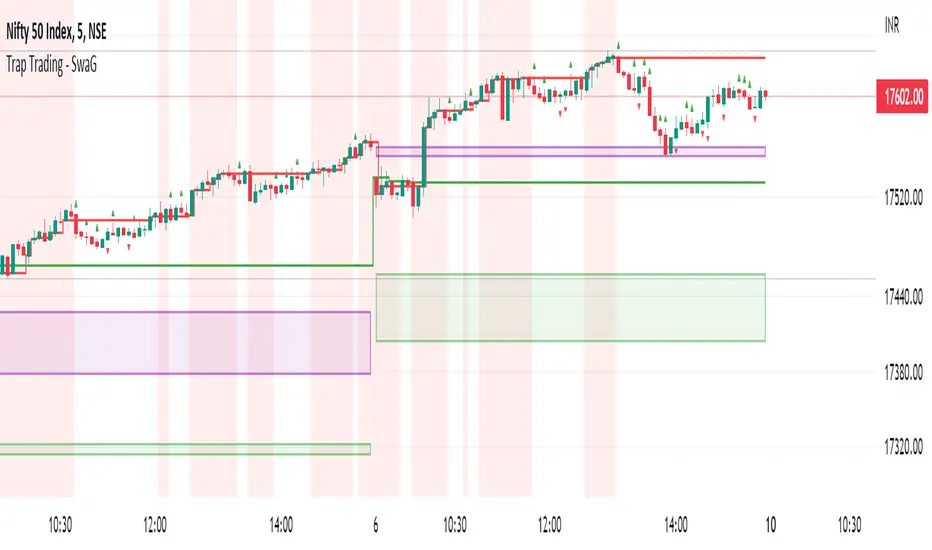
Trap Trading - SwaGThis is an intraday indicator
Set timeframe to 5 min
Take long entry on the high brakes of selling traps
Take short entry on the low brakes of buying traps
ignore traps left to red zones
Use the nearest trap
take profit/loss on a 1:2 risk-to-reward basis.
Trap Trading
Trap trading is a trading strategy that seeks to profit from false breakouts in financial markets. This strategy is based on the idea that when the market breaks through a key level of support or resistance, many traders will take that as a signal to enter or exit trades, causing the price to move further in the breakout direction.
However, in some cases, the market will quickly reverse course and move in the opposite direction, trapping those traders who entered the trade based on the breakout. This can create a trading opportunity for those who are able to identify the false breakout and trade in the opposite direction.
The trap trading strategy typically involves identifying a key level of support or resistance on a price chart and then waiting for the market to break through that level. If the price continues to move in the breakout direction, the trader may enter a trade in that direction with a stop loss set just below the breakout level.
However, if the market quickly reverses and moves back below the breakout level, the trader may enter a trade in the opposite direction with a stop loss set just above the breakout level. The idea is to take advantage of the trapped traders who entered the trade based on the false breakout, and profit from the market's reversal.
As with any trading strategy, there are risks and potential drawbacks to trap trading. False breakouts can be difficult to identify, and there is always the risk that the market will continue to move in the breakout direction, resulting in losses for the trader. Additionally, trap trading requires a solid understanding of technical analysis and market trends, which may take time and experience to develop.
Tradingsignals
Davin's 10/200MA Pullback on SPY Strategy v2.0Strategy:
Using 10 and 200 Simple moving averages, we capitalize on price pullbacks on a general uptrend to scalp 1 - 5% rebounds. 200 MA is used as a general indicator for bullish sentiment, 10 MA is used to identify pullbacks in the short term for buy entries.
An optional bonus: market crash of 20% from 52 days high is regarded as a buy the dip signal.
An optional bonus: can choose to exit on MA crossovers using 200 MA as reference MA (etc. Hard stop on 50 cross 200)
Recommended Ticker: SPY 1D (I have so far tested on SPY and other big indexes only, other stocks appear to be too volatile to use the same short period SMA parameters effectively) + AAPL 4H
How it works:
Buy condition is when:
- Price closes above 200 SMA
- Price closes below 10 SMA
- Price dumps at least 20% (additional bonus contrarian buy the dip option)
Entry is on the next opening market day the day after the buy condition candle was fulfilled.
Sell Condition is when:
- Prices closes below 10 SMA
- Hard stop at 15% drawdown from entry price (adjustable parameter)
- Hard stop at medium term and long term MA crossovers (adjustable parameters)
So far this strategy has been pretty effective for me, feel free to try it out and let me know in the comments how you found :)
Feel free to suggest new strategy ideas for discussion and indicator building

Ichimoku Cloud with ADX (By Coinrule)The Ichimoku Cloud is a collection of technical indicators that show support and resistance levels, as well as momentum and trend direction. It does this by taking multiple averages and plotting them on a chart. It also uses these figures to compute a “cloud” that attempts to forecast where the price may find support or resistance in the future.
The Ichimoku Cloud was developed by Goichi Hosoda, a Japanese journalist, and published in the late 1960s. It provides more data points than the standard candlestick chart. While it seems complicated at first glance, those familiar with how to read the charts often find it easy to understand with well-defined trading signals.
The Ichimoku Cloud is composed of five lines or calculations, two of which comprise a cloud where the difference between the two lines is shaded in.
The lines include a nine-period average, a 26-period average, an average of those two averages, a 52-period average, and a lagging closing price line.
The cloud is a key part of the indicator. When the price is below the cloud, the trend is down. When the price is above the cloud, the trend is up.
The above trend signals are strengthened if the cloud is moving in the same direction as the price. For example, during an uptrend, the top of the cloud is moving up, or during a downtrend, the bottom of the cloud is moving down.
DMI is simple to interpret. When +DI > - DI, it means the price is trending up. On the other hand, when -DI > +DI , the trend is weak or moving on the downside. The ADX does not give an indication about the direction but about the strength of the trend.
Typically values of ADX above 25 mean that the trend is steeply moving up or down, based on the -DI and +D positioning. This script aims to capture swings in the DMI, and thus, in the trend of the asset, using a contrarian approach.
Trading on high values of ADX , the strategy tries to spot extremely oversold and overbought conditions. Values of ADX above 45 may suggest that the trend has overextended and is may be about to reverse.
This strategy combines the Ichimoku Cloud with the ADX indicator to better enter trades.
Long/Short orders are placed when these basic signals are triggered.
Long Position:
Tenkan-Sen is above the Kijun-Sen
Chikou-Span is above the close of 26 bars ago
Close is above the Kumo Cloud
MACD line crosses over the signal line
-DI is greater than +DI
ADX is greater than 45
Short Position:
Tenkan-Sen is below the Kijun-Sen
Chikou-Span is below the close of 26 bars ago
Close is below the Kumo Cloud
MACD line crosses under the signal line
+DI is greater than -DI
ADX is less than 45
The script is backtested from 1 January 2022 and provides good returns.
The strategy assumes each order is using 30% of the available coins to make the results more realistic and to simulate you only ran this strategy on 30% of your holdings. A trading fee of 0.1% is also taken into account and is aligned to the base fee applied on Binance.
This script also works well on MATIC (15m timeframe), ETH (5m timeframe), and SOL (15m timeframe).

Ichimoku Cloud with MACD (By Coinrule)The Ichimoku Cloud is a collection of technical indicators that show support and resistance levels, as well as momentum and trend direction. It does this by taking multiple averages and plotting them on a chart. It also uses these figures to compute a “cloud” that attempts to forecast where the price may find support or resistance in the future.
The Ichimoku Cloud was developed by Goichi Hosoda, a Japanese journalist, and published in the late 1960s. It provides more data points than the standard candlestick chart. While it seems complicated at first glance, those familiar with how to read the charts often find it easy to understand with well-defined trading signals.
The Ichimoku Cloud is composed of five lines or calculations, two of which comprise a cloud where the difference between the two lines is shaded in.
The lines include a nine-period average, a 26-period average, an average of those two averages, a 52-period average, and a lagging closing price line.
The cloud is a key part of the indicator. When the price is below the cloud, the trend is down. When the price is above the cloud, the trend is up.
The above trend signals are strengthened if the cloud is moving in the same direction as the price. For example, during an uptrend, the top of the cloud is moving up, or during a downtrend, the bottom of the cloud is moving down.
The MACD is a trend following momentum indicator and provides identification of short-term trend direction. In this variation it utilises the 12-period as the fast and 26-period as the slow length EMAs, with signal smoothing set at 9.
This strategy combines the Ichimoku Cloud with the MACD indicator to better enter trades.
Long/Short orders are placed when three basic signals are triggered.
Long Position:
Tenkan-Sen is above the Kijun-Sen
Chikou-Span is above the close of 26 bars ago
Close is above the Kumo Cloud
MACD line crosses over the signal line
Short Position:
Tenkan-Sen is below the Kijun-Sen
Chikou-Span is below the close of 26 bars ago
Close is below the Kumo Cloud
MACD line crosses under the signal line
The script is backtested from 1 June 2022 and provides good returns.
The strategy assumes each order is using 30% of the available coins to make the results more realistic and to simulate you only ran this strategy on 30% of your holdings. A trading fee of 0.1% is also taken into account and is aligned to the base fee applied on Binance.
This script also works well on MATIC (1h timeframe), AVA (45m timeframe), and BTC (30m timeframe).

Inverse MACD + DMI Scalping with Volatility Stop (By Coinrule)This script is focused on shorting during downtrends and utilises two strength based indicators to provide confluence that the start of a short-term downtrend has occurred - catching the opportunity as soon as possible.
This script can work well on coins you are planning to hodl for long-term and works especially well whilst using an automated bot that can execute your trades for you. It allows you to hedge your investment by allocating a % of your coins to trade with, whilst not risking your entire holding. This mitigates unrealised losses from hodling as it provides additional cash from the profits made. You can then choose to hodl this cash, or use it to reinvest when the market reaches attractive buying levels.
Alternatively, you can use this when trading contracts on futures markets where there is no need to already own the underlying asset prior to shorting it.
ENTRY
The trading system uses the Momentum Average Convergence Divergence (MACD) indicator and the Directional Movement Index (DMI) indicator to confirm when the best time is for selling. Combining these two indicators prevents trading during uptrends and reduces the likelihood of getting stuck in a market with low volatility.
The MACD is a trend following momentum indicator and provides identification of short-term trend direction. In this variation it utilises the 12-period as the fast and 26-period as the slow length EMAs, with signal smoothing set at 9.
The DMI indicates what way price is trending and compares prior lows and highs with two lines drawn between each - the positive directional movement line (+DI) and the negative directional movement line (-DI). The trend can be interpreted by comparing the two lines and what line is greater. When the negative DMI is greater than the positive DMI, there are more chances that the asset is trading in a sustained downtrend, and vice versa.
The system will enter trades when two conditions are met:
1) The MACD histogram turns bearish.
2) When the negative DMI is greater than the positive DMI.
EXIT
The strategy comes with a fixed take profit combined with a volatility stop, which acts as a trailing stop to adapt to the trend's strength. Depending on your long-term confidence in the asset, you can edit the fixed take profit to be more conservative or aggressive.
The position is closed when:
Take-Profit Exit: +8% price decrease from entry price.
OR
Stop-Loss Exit: Price crosses above the volatility stop.
In general, this approach suits medium to long term strategies. The backtesting for this strategy begins on 1 April 2022 to 18 July 2022 in order to demonstrate its results in a bear market. Back testing it further from the beginning of 2022 onwards further also produces good returns.
Pairs that produce very strong results include SOLUSDT on the 45m timeframe, MATICUSDT on the 2h timeframe, and AVAUSDT on the 1h timeframe. Generally, the back testing suggests that it works best on the 45m/1h timeframe across most pairs.
A trading fee of 0.1% is also taken into account and is aligned to the base fee applied on Binance.

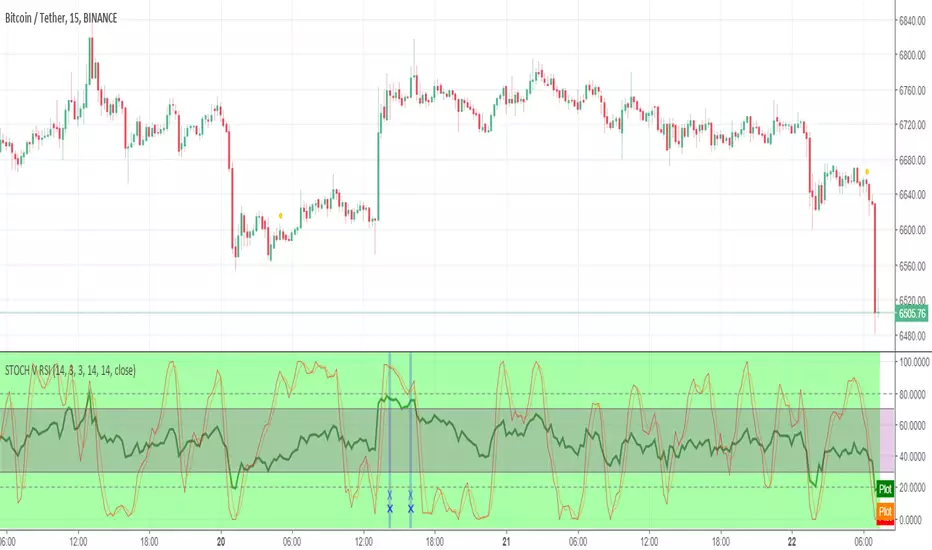
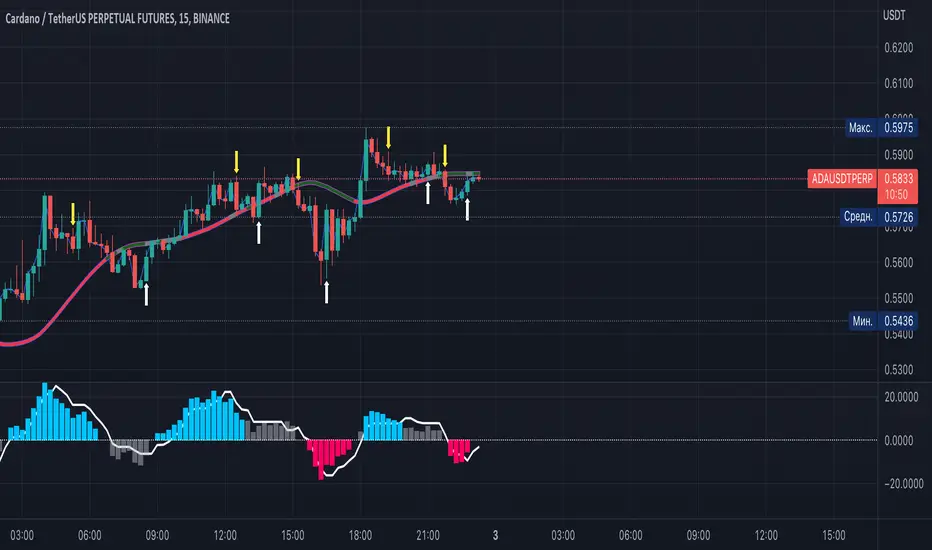
SP IndicatorSP Indicator - One of the best indicators for scalping trading on any timeframes. The best readings are given on 5, 15 and 30 minute frames.
For readings, several indicators are combined into one, which allows you to get a more accurate forecast, which is more than 90%.
Instruction.
The indicator is easy to use. Just install it and follow the arrows to go long or short. Stop loss set small, about 1-2%. In most cases, this is sufficient.
Good luck in bidding!
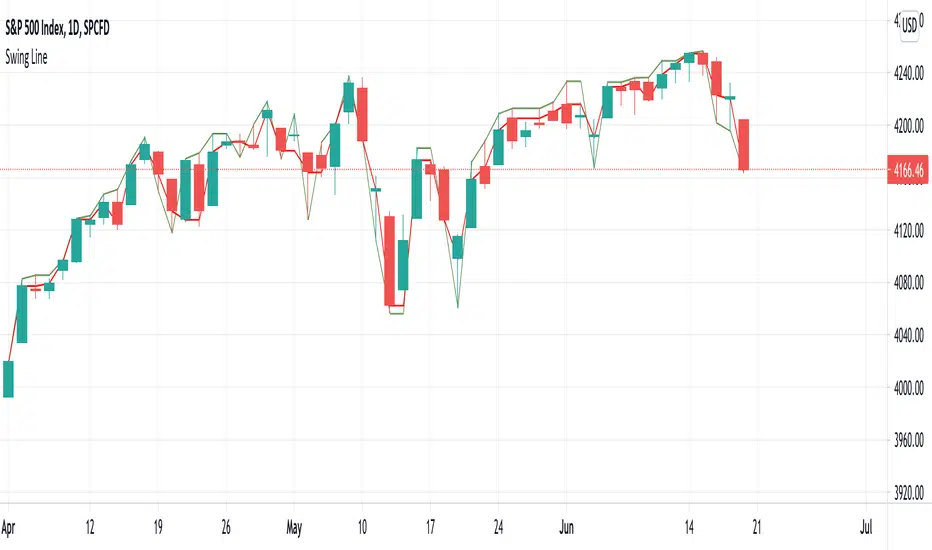
Swing LineThe author was inspired by Charles Dow's concept on trend and Gann's concept on swing trade.
Swing line can help identify resistance and support. Breaking resistance indicate an uptrend. Breaking support indicates a downtrend. This is a simple and intuitive method in trend determination.
However, many chart readers nowadays set Candlestick as preferred pattern. The shared indicator provides another choice for constructing swing lines.
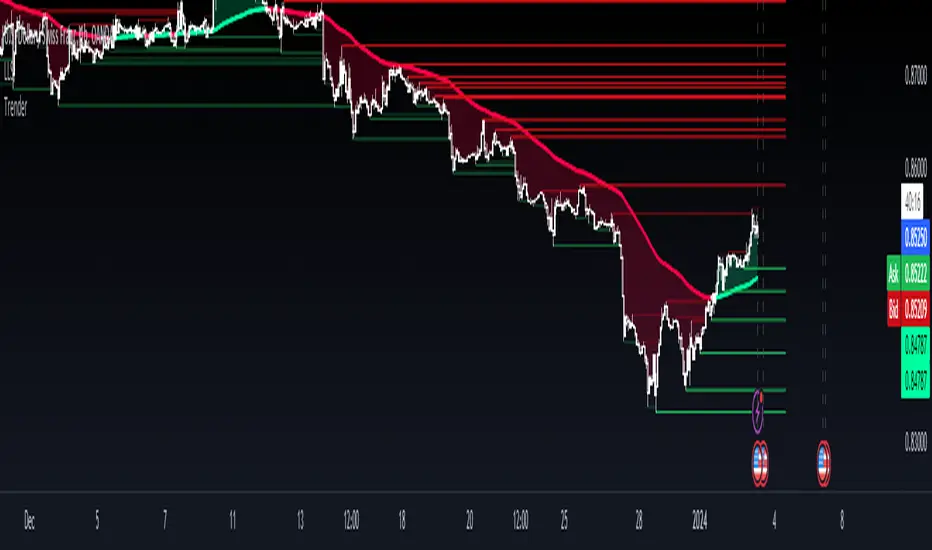
TrenderTrender is an indicator that compiles trend-following ideas in a complete friendly-custom indicator. Based on classic arithmetic moving averages, exponential moving averages, volume and a little bit of Fibonacci. Indicator built and usable in TradingView, focused only for easy visualization of the trend.