連騰カウントCount arbitrary winning streaks and calculate their occurrence probability over a specified period.
For example, if a 5-day winning streak occurs only 0.3% of the time, it indicates that the price movement is not random, but rather a clear sign of capital inflows — making it a useful metric for analysis.
Trend Analysis

DTLLC Time & PriceDTLLC Time and Price with Signals
This indicator is built for traders who understand ICT concepts and want a structured, visual way to align time-based price action with key market levels. By combining customizable trading windows, breakout logic, and daily reference points, it helps you identify high-probability trade opportunities while filtering out market noise.
Key Features
1. Dual Custom Time Ranges (Kill Zones)
Set two independent time ranges per day (start/end hour and minute).
Each range identifies the highest high and lowest low within its window.
Built-in breakout detection generates buy/sell signals when price moves beyond these levels.
2. Volatility Filtering
Adjustable volatility threshold based on True Range relative to ATR.
Filters out low-quality signals during choppy, low-volatility conditions.
3. ATR-Based Stop Loss
Custom ATR length and stop-loss multiplier settings.
Automatically plots ATR-based stop levels for triggered trades.
4. Daily Key Levels
Plots Previous Day High, Previous Day Low, and Midnight Open continuously on the chart.
Useful for spotting breakout and reversal opportunities in line with ICT market structure concepts.
5. Liquidity & Engulfing Candle Highlights
Highlights potential liquidity grab zones (yellow candles) when significant highs/lows are set within your lookback period.
Detects bullish (green) and bearish (red) engulfing patterns for added confluence.
6. Visual & Signal Tools
Buy/Sell signals plotted directly on chart (separate colors for Range 1 and Range 2). Continuous plotting of reference levels to maintain market context throughout the session.
Example Use Case:
A common ICT-inspired reversal setup:
Wait for price to sweep the Previous Day’s High or Low during your chosen time range.
Look for a buy or sell signal with volatility confirmation.
Manage risk using the ATR-based stop-loss plot.
Disclaimer: This script is for educational purposes only and is not financial advice. Trade responsibly and always test strategies before applying them in live markets.


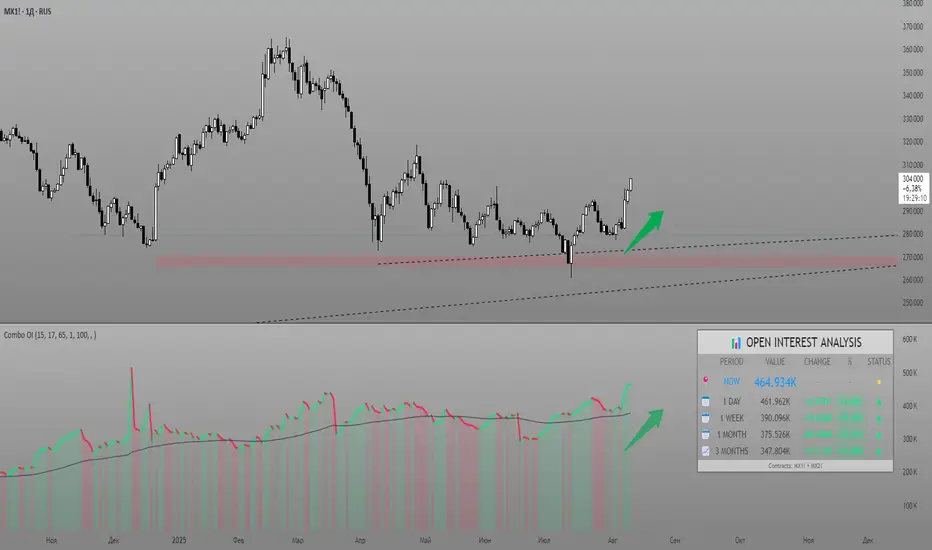
Combined Futures Open Interest [Sam SDF-Solutions]The Combined Futures Open Interest indicator is designed to provide comprehensive analysis of market positioning by aggregating open interest data from the two nearest futures contracts. This dual-contract approach captures the complete picture of market participation, including rollover dynamics between front and back month contracts, offering traders crucial insights into institutional positioning and market sentiment.
Key Features:
Dual-Contract Aggregation: Automatically identifies and combines open interest from the first and second nearest futures contracts (e.g., ES1! + ES2!), providing a complete view of market positioning that single-contract analysis might miss.
Multi-Period Analysis: Tracks open interest changes across multiple timeframes:
1 Day: Immediate market sentiment shifts
1 Week: Short-term positioning trends
1 Month: Medium-term institutional flows
3 Months: Quarterly positioning aligned with contract expiration cycles
Smart Data Handling: Utilizes last known values when data is temporarily unavailable, preventing false signals from data gaps while clearly indicating when stale data is being used.
EMA Smoothing: Incorporates a customizable Exponential Moving Average (default 65 periods) to identify the underlying trend in open interest, filtering out daily noise and highlighting significant deviations.
Dynamic Visualization:
Color-coded main line showing directional changes (green for increases, red for decreases)
Optional fill areas between OI and EMA to visualize momentum
Separate contract lines for detailed rollover analysis
Customizable labels for significant percentage changes
Comprehensive Information Table: Displays real-time statistics including:
Current total open interest across both contracts
Period-over-period changes in absolute and percentage terms
EMA deviation metrics
Visual status indicators for quick assessment
Contract symbols and data quality warnings
Alert System: Configurable alerts for:
Significant daily changes (customizable threshold)
EMA crossovers indicating trend changes
Large percentage movements suggesting institutional activity
How It Works:
Contract Detection: The indicator automatically identifies the base futures symbol and constructs the appropriate contract codes for the two nearest expirations, or accepts manual symbol input for non-standard contracts.
Data Aggregation: Open interest data from both contracts is retrieved and summed, providing a complete picture that accounts for positions rolling between contracts.
Historical Comparison: The indicator calculates changes from multiple lookback periods (1/5/22/66 days) to show how positioning has evolved across different time horizons.
Trend Analysis: The EMA overlay helps identify whether current open interest is above or below its smoothed average, indicating momentum in position building or reduction.
Visual Feedback: The main line changes color based on daily changes, while the optional table provides detailed numerical analysis for traders requiring precise data.
___________________
This indicator is essential for futures traders, particularly those focused on index futures, commodities, or currency futures where understanding the aggregate positioning across nearby contracts is crucial. It's especially valuable during rollover periods when positions shift between contracts, and for identifying institutional accumulation or distribution patterns that single-contract analysis might miss. By combining multiple timeframe analysis with intelligent data handling and clear visualization, it simplifies the complex task of monitoring open interest dynamics across the futures curve.
Prev D/W/M + Asia & London Levels [Oeditrades]Prev D/W/M + Asia & London Levels
Author: Oeditrades
Platform: Pine Script® v6
What it does
Plots only the most recent, fully completed:
Previous Day / Week / Month highs & lows
Asia and London session highs & lows
Levels are drawn as true horizontal lines from the period/session start and extended to the right for easy confluence reading. The script is non-repainting.
How it works
Prev Day/Week/Month: Uses completed HTF candles (high / low ) so values are fixed for the entire next period.
Sessions (NY time): Asia (default 20:00–03:00) and London (default 03:00–08:00) are tracked in America/New_York time. High/low are locked when the session ends, and the line is anchored at that session’s start.
Inputs & customization
Visibility: toggle Previous Day/Week/Month, Asia, London, and labels.
Colors: highs default red; lows default green (user-configurable). Session highs default pink, lows aqua (also editable).
Style: line style (solid/dotted/dashed) and width.
Sessions: editable time windows for Asia and London (still interpreted in New York time).
Disclaimer: optional on-chart disclaimer panel with editable text.
Notes
Works on any timeframe. For intraday charts, the HTF values remain constant until the next HTF bar completes.
If your market’s overnight hours differ, simply adjust the session windows in Inputs.
Lines intentionally show only the latest completed period/session to keep charts clean.
Use cases
Quick view of PDH/PDL, PWH/PWL, PMH/PML for bias and liquidity.
Intraday planning around Asia/London range breaks, retests, and overlaps with prior levels.
Disclaimer
This tool is for educational purposes only and is not financial advice. Markets involve risk; past performance does not guarantee future results.

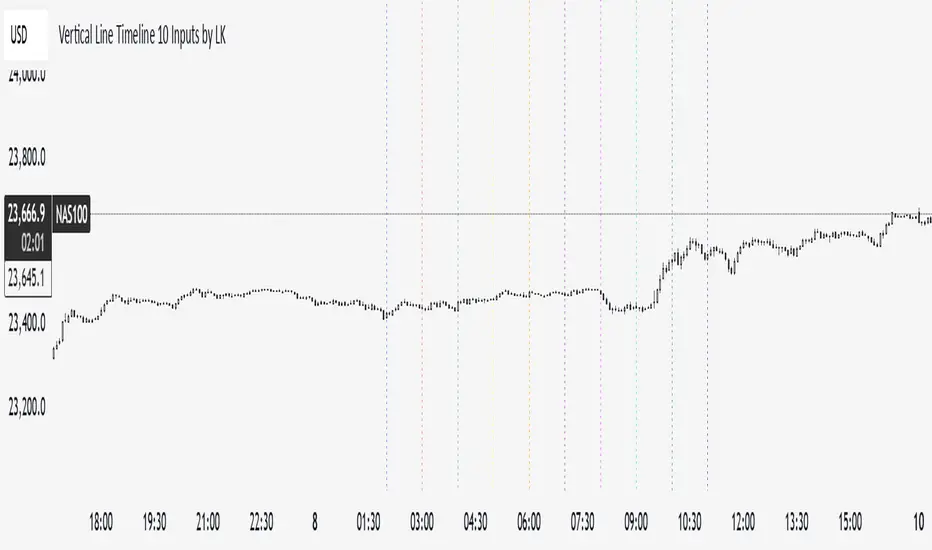
Vertical Line Timeline 10 Inputs by LK**Vertical Line Timeline (10 Inputs)**
This TradingView indicator plots vertical lines on your chart at up to **10 specific times of day**. You can define each time in **HH.MM format** (e.g., `9.30` for 9:30 AM). When the current bar’s time matches any of the defined times (based on the chart’s timezone), the indicator automatically draws a **full-height vertical line** at that bar.
**Features:**
* **Up to 10 custom time inputs** (HH.MM format)
* **Custom color** for each time marker
* **Adjustable line width** (1–6 px)
* **Solid or dotted style** toggle
* **Full-height vertical lines** (extend through the entire chart height)
* Works on any intraday timeframe where bar start times can match the defined times
* No labels or extra elements — clean and minimal display
**Use cases:**
* Marking important market sessions (e.g., London Open, New York Open, Asian Close)
* Highlighting personal trade execution windows
* Visual cues for strategy backtesting or time-based setups
ICT SMC Custom — BOS/MSS + OB + FVGWant me to fill that box? Here’s a ready‑to‑paste description for your publish screen:
⸻
ICT SMC Custom — BOS/MSS + OB + FVG (Crypto‑friendly)
A clean Smart Money Concepts tool that marks Break of Structure (BOS), Market Structure Shift (MSS), Order Blocks (OB), and Fair Value Gaps (FVG) with bold, easy‑to‑see visuals. Built for crypto but works on any market and timeframe.
What it does
• BOS & MSS detection with optional body/wick logic
• Order Blocks: auto‑draws the last opposite candle before a BOS, keeps only the most recent N, and fades when mitigated
• FVGs: 3‑candle gaps with a minimum size filter and a cap on how many to keep
• HTF Swings (optional): plots higher‑timeframe pivot highs/lows for top‑down context
• Alerts for BOS/MSS and FVG formation
Inputs
• Swing pivot length (default 3): sensitivity for structure pivots
• Use candle bodies for breaks: close vs level (on) or wicks (off)
• Show BOS/MSS labels, Show FVG, Show Order Blocks
• Min FVG size (ticks) and Max boxes to keep for FVG/OB
• OB uses candle body: body range vs full wick range
• Show higher timeframe swings + HTF timeframe
• Bullish/Bearish colors
How it works
• BOS triggers when price breaks the last opposite swing.
• MSS flags when the break flips the prior bias.
• OB is the most recent opposite candle prior to BOS; it’s marked and later greyed out once price closes through it (mitigation).
• FVG is detected when candle 1’s high < candle 3’s low (bear) or candle 1’s low > candle 3’s high (bull).
Alerts included
• BOS Up / BOS Down
• MSS Up / MSS Down
• FVG Up / FVG Down
Tips
• Start on 15m/1h for crypto, pivot length 3–5.
• Turn Use candle bodies ON for stricter confirmations, OFF for more signals.
• If boxes look cluttered, lower “Max boxes to keep.”
Note: This is a visual/educational tool, not financial advice. Always confirm with your own plan and risk management.

Linh Index Trend & Exhaustion SuitePurpose: One overlay to judge trend, reversal risk, overextension, and volatility squeezes on indexes (built for VNINDEX/VN30, works on any symbol & timeframe).
What it shows
Trend state: Bull / Bear / Transition via 20/50/200 EMAs + slope check.
Overextension heatmap: Background paints when price is stretched vs the 20-EMA by ATR or % (you set the thresholds).
Squeeze detection:
Squeeze ON (yellow dot): Bollinger Bands (20,2) inside Keltner Channels (20,1.5).
Squeeze OFF + Release: White dot; script confirms direction only when close > BB upper (up) or close < BB lower (down).
52-week context: Distance to 52-week high/low (%).
Higher-TF alignment: Optional weekly trend reading shown on the label while you’re on the daily.
Anchored VWAP(s): Two optional AVWAPs from dates you choose (e.g., YTD open, last big gap/earnings).
Plots & labels
EMAs 20/50/200 (toggle on/off).
Optional BB & KC bands for diagnostics.
AVWAP #1 / #2 (optional).
Status label with: Trend, EMAs, Dist to 20-EMA (%, ATR), 52-week distances, HTF state.
Built-in alerts (set “Once per bar close”)
EMA10 ↔ EMA20 cross (early momentum shift)
EMA20 ↔ EMA50 cross (trend confirmation/negation)
Price ↔ EMA200 cross (long-term regime)
Squeeze Release UP / DOWN (BB breakout after squeeze)
Overextension Cool-off UP / DN (stretched vs 20-EMA + momentum rolling)
Near 52-week High (within your % threshold)
How to use (playbook)
Map regime: Prefer trades when Daily = Bull and HTF (Weekly) = Bull (shown on label).
Hunt expansion: Yellow → White dot and close beyond BB = fresh move.
Avoid chasing stretch: If background is painted (overextended vs 20-EMA), wait for a pullback or intraday base.
Locations matter: 52-week proximity + HTF Bull improves breakout quality.
Anchors: Add AVWAP from YTD open or last major gap to frame support/resistance.
Suggested settings
Overextension: ATR = 2.0, % = 4.0 to start; tune per index volatility.
Squeeze bands: BB(20,2) & KC(20,1.5) default are balanced; tighten KC (1.3) for more signals, widen (1.8) for fewer/higher quality.
Timeframes: Daily for signals, Weekly for bias. Optional 65-min for entries.

Price / SMA RatioThis indicator will develop a Line chart which will be calculated by Dividing the Current Price with the value of Simple Moving Average as feeded in the indicator with 1 as Base Line

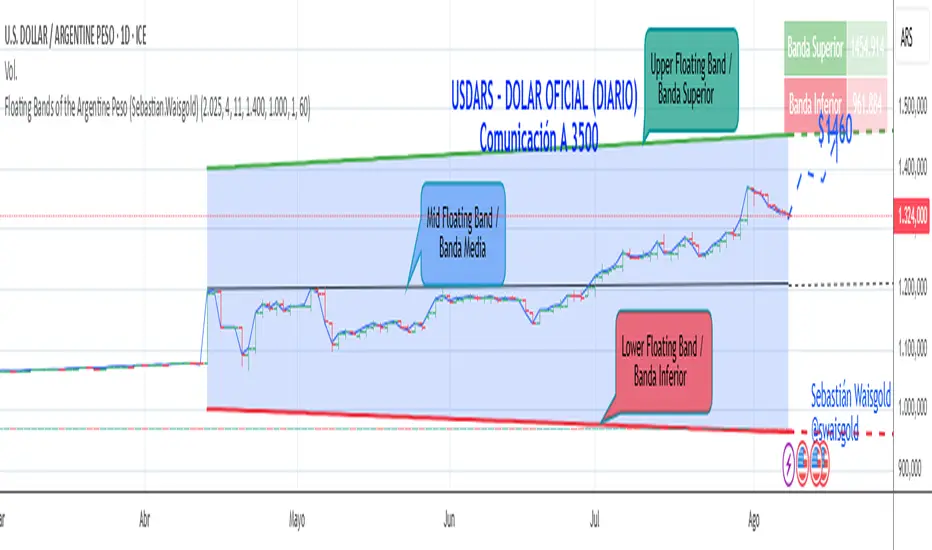
Floating Bands of the Argentine Peso (Sebastian.Waisgold)
The BCRA ( Central Bank of the Argentine Republic ) announced that as of Monday, April 15, 2025, the Argentine Peso (USDARS) will float within a system of divergent exchange rate bands.
The upper band was set at ARS 1400 per USD on 15/04/2025, with a +1% monthly adjustment distributed daily, rising by a fraction each day.
The lower band was set at ARS 1000 per USD on 15/04/2025, with a –1% monthly adjustment distributed daily, falling by a fraction each day.
This indicator is crucial for anyone trading USDARS, since the BCRA will only intervene in these situations:
- Selling : if the Peso depreciates against the USD above the upper band .
- Buying : if the Peso appreciates against the USD below the lower band .
Therefore, this indicator can be used as follows:
- If USDARS is above the upper band , it is “expensive” and you may sell .
- If USDARS is below the lower band , it is “cheap” and you may buy .
It can also be applied to other assets such as:
- USDTARS
- Dollar Cable / CCL (Contado con Liquidación) , derived from the BCBA:YPFD / NYSE:YPF ratio.
A mid band —exactly halfway between the upper and lower bands—has also been added.
Once added, the indicator should look like this:
In the following image you can see:
- Upper Floating Band
- Lower Floating Band
- Mid Floating Band
User Configuration
By double-clicking any line you can adjust:
- Start day (Dia de incio), month (Mes de inicio), and year (Año de inicio)
- Initial upper band value (Valor inicial banda superior)
- Initial lower band value (Valor inicial banda inferior)
- Monthly rate Tasa mensual %)
It is recommended not to modify these settings for the Argentine Peso, as they reflect the BCRA’s official framework. However, you may customize them—and the line colors—for other assets or currencies implementing a similar band scheme.
RSI (14) with Auto Zone Colors — Overbought/Oversold HighlighterThis indicator plots the Relative Strength Index (RSI 14) with dynamic color changes for instant visual clarity:
✅ Green line in overbought zone (≥70)
✅ Red line in oversold zone (≤30)
✅ White line in neutral range (30–70)
Includes reference lines at 70, 50, and 30 for quick decision-making. Perfect for spotting momentum extremes, divergences, and potential reversal points without squinting at numbers. Works on any timeframe.

Full Session ATR Range (Live) - with Position ToggleBelow is a publication-ready text for the "Full Session ATR Range (Live) - with Position Toggle" indicator, written in a professional yet accessible style suitable for a trading community (e.g., TradingView or a blog). The text highlights the indicator's features, usage, and benefits, while avoiding overly technical jargon for a broad audience.
---
### Introducing the Full Session ATR Range (Live) Indicator with Position Toggle
Enhance your trading strategy with the **Full Session ATR Range (Live) Indicator**, a powerful tool designed to provide real-time insights into market volatility and session dynamics. This customizable indicator, now available with a position toggle feature, compares the current session's range to a 10-day Average True Range (ATR), helping traders gauge market activity and anticipate potential movements.
#### Key Features
- **Live Range Tracking**: Displays the current session's range (high minus low) alongside a 10-day ATR, updated in real-time during market hours.
- **Session Mode Flexibility**: Includes an auto-toggle option to switch between Electronic Trading Hours (ETH) and Regular Trading Hours (RTH), adapting to your preferred trading session. Manually select ETH or RTH, or let the indicator auto-detect based on market hours.
- **Comprehensive Metrics**: Offers a detailed breakdown including:
- Range/Avg %: Percentage of the current range relative to the 10-day ATR.
- Points Left: Remaining points to reach the average range.
- 100% Range Up/Dn: Potential upper and lower targets based on the ATR difference.
- **Position Customization**: Adjust the table's location on your chart with options like top-left, top-right, middle-center, or bottom-right for optimal visibility.
- **Visual Appeal**: Features a customizable background and text color to match your chart theme.
#### How It Works
The indicator calculates the 10-day ATR using daily data and tracks the current session's range, resetting at the start of each day or session change. During market hours (e.g., 6 AM - 8 PM CDT, adjustable), it updates live, providing actionable insights. When the market is closed, it displays historical ATR while marking live metrics as "n/a" to avoid confusion. The ETH/RTH toggle ensures the range reflects either the full extended session or the core trading hours, tailored to your strategy.
#### Why Use It?
Whether you're a day trader monitoring intraday volatility or a swing trader assessing longer-term trends, this indicator helps you:
- Identify overextended or underactive sessions compared to historical norms.
- Plan entries and exits with targets based on the 100% Range Up/Dn levels.
- Stay informed with a clean, adjustable display that fits your workflow.
#### Installation & Customization
1. Add the indicator to your TradingView chart.
2. Adjust the ATR length (default: 10 days) and table position via the input settings.
3. Choose your session mode (Auto, ETH, or RTH) and customize colors to suit your style.
4. Test during market hours for live updates—note that static values may appear outside trading sessions.
#### Feedback & Support
This indicator is designed for flexibility and ease of use. Share your feedback or request enhancements by commenting below or contacting the developer. Happy trading!

RSI 20/80 Arrows + AlertsRSI 20/80 Arrows + Alerts
This indicator is a modified Relative Strength Index (RSI) tool designed to help traders spot potential overbought and oversold conditions using customizable threshold levels (default 80 for overbought, 20 for oversold).
Features:
Custom RSI Levels – Default to 80/20 instead of the standard 70/30, but fully adjustable by the user.
Visual Signals –
Blue Arrow Up appears below the bar when RSI crosses up from below the oversold level (potential buy zone).
Red Arrow Down appears above the bar when RSI crosses down from above the overbought level (potential sell zone).
Alerts Built In – Receive notifications when either signal occurs, with the option to confirm signals only on bar close for reduced noise.
Guide Levels – Optionally display overbought/oversold reference lines on the chart for quick visual reference.
Overlay Mode – Signals are plotted directly on the price chart, so you don’t need to switch between chart windows.
Use Case:
Ideal for traders who want quick, visual confirmation of potential turning points based on RSI, especially in strategies where more extreme levels (like 20/80) help filter out weaker signals. Works well across all markets and timeframes.

RSI Z-score | Lemniscuss🧠 Introducing RSI Z-Score (RSI-Z) by Lemniscuss
🛠️ Overview
RSI Z-Score (RSI-Z) is a momentum-based market condition detector that transforms the classic Relative Strength Index (RSI) into a standardized volatility framework.
By applying Z-Score normalization to the RSI, this tool allows traders to identify statistically significant deviations in momentum — cutting through noise and highlighting high-probability turning points.
RSI-Z is optimized for trend inflection detection and overextension spotting, providing both visual clarity and actionable trade signals with dynamic labeling and optional bar coloring.
🔍 How It Works
1️⃣ RSI Foundation
The system starts with a standard RSI calculation on a user-defined source and length (default: 45).
2️⃣ Z-Score Normalization
The RSI values are standardized by subtracting their mean and dividing by the standard deviation over the same lookback.
This converts RSI into a statistical measure — revealing how many standard deviations current momentum is from its mean.
3️⃣ Threshold Logic
Two customizable thresholds define actionable zones:
• Long Threshold → Signals bullish momentum shifts when crossed upward
• Short Threshold → Signals bearish momentum shifts when crossed downward
4️⃣ Signal State Tracking
A state variable locks in a bias (Long / Short / Neutral) until an opposing trigger appears, ensuring clear and consistent market bias mapping.
✨ Key Features
🔹 Statistically Driven Momentum Detection — Moves beyond fixed RSI overbought/oversold levels by using standard deviations for adaptive accuracy.
🔹 Customizable Thresholds — Fine-tune long/short triggers for different volatility environments.
🔹 Clear Visual Feedback — Candle coloring and signal labels make trade setups instantly recognizable.
🔹 Overlay-Friendly — Works directly on your main chart or in a separate pane.
⚙️ Custom Settings
• Source: Price stream for RSI calculation (default: close)
• RSI Length: Lookback period for RSI & Z-Score (default: 45)
• Long Threshold: Z-score value for bullish signal (default: 1)
• Short Threshold: Z-score value for bearish signal (default: -1.9)
• Long/Cash Signal Labels: Toggle for "Long"/"Short" markers
• Bar Coloring: Toggle for trend-based candle coloring
📌 Trading Applications
✅ Trend Reversals → Spot statistically significant shifts in momentum before traditional RSI signals trigger
✅ Overextension Monitoring → Identify when momentum has deviated too far from the mean
✅ Mean Reversion Setups → Use extreme Z-score values as potential reversion points
✅ Bias Confirmation → Combine with trend tools for higher conviction entries/exits
📌 Conclusion
RSI-Z by Lemniscuss offers a clean, statistics-backed upgrade to the classic RSI.
By framing momentum in standard deviation terms, it empowers traders to separate normal fluctuations from truly significant market moves — making it a valuable tool for both trend traders and mean reversion specialists.
🔹 Summary Highlights
1️⃣ Statistical upgrade to RSI for higher-quality signals
2️⃣ Threshold-based, customizable long/short triggers
3️⃣ Visual candle coloring & signal labels for clarity
4️⃣ Adaptable to trend, swing, or intraday strategies
📌 Disclaimer: Past performance is not indicative of future results. No indicator guarantees profitability — always test and manage risk appropriately.

MA Cross Trend CandlesSummary
Repaints a candle based on MA cross. For example, if EMA 3 is above EMA 5 - all candles will be blue. If EMA 3 is under EMA 5 - all candles will be yellow. In the unlikely event when EMA 3 equals EMA 5 - that particular candle will be gray.
Works best with candle bars and hollow candles
Limitations
The only function to repaint candles is `barcolor()` and it only accepts ONE color. So sometimes it repaints candle's body and sometimes - candle's border. YOU go figure out the particulars :). No way to repaint wicks.
There is a way to draw an entire new candle but I haven't found a way to remove the current one. Or draw over it. Let me know if you find it.
Can only be used on the main pane of the graph. I can think of one ugly way of fixing it (using 4 separate inputs for open, high, low, close). If you know of a more elegant way - do let me know.

Previous Day High/Low Levels [OWI]📘 How to Use the “Previous Day High/Low Levels ” Indicator
This TradingView indicator automatically tracks and displays the previous day's high and low during the Regular Trading Hours (RTH) session. It’s perfect for traders who want to visualize key support/resistance levels from the prior day in futures like CME_MINI:NQ1! and COMEX:GC1! .
🛠 Setup Instructions
1. Customize RTH Session Times
- In the Settings panel, adjust the following under the Levels group:
- RTH Start Hour and RTH Start Minute: Default is 9:30 AM (New York time).
- RTH End Hour and RTH End Minute: Default is 4:15 PM.
- These define the active trading session used to calculate the day’s high and low.
2. Toggle Labels
- Use the Show PDH/PDL Labels checkbox to display or hide the “PDH” and “PDL” labels on the chart.
- Labels appear after the session ends and follow price dynamically.
📊 What the Indicator Does
- During the RTH session:
- Tracks the highest and lowest price of the day.
- After the session ends:
- Draws horizontal lines at the previous day’s high (green) and low (red).
- Optionally displays labels ("PDH" and "PDL") at those levels.
- Lines extend into the current day to help identify potential support/resistance zones.
✅ Best Practices
- Use this indicator on intraday timeframes (e.g., 5m, 15m, 1h) for best results.
- Combine with volume or price action analysis to confirm reactions at PDH/PDL levels.
- Adjust session times if trading non-US markets or custom hours.

JJ Thursday Expiry Highlighter - NiftyThursday Expiry Highlighter
This indicator shades the background of all Thursday trading sessions on your chart — ideal for Nifty, Bank Nifty, and other Indian markets where the weekly options expiry typically occurs on Thursdays.
Features:
Highlights entire Thursday columns on any timeframe (intraday or daily).
Adjustable highlight color and transparency for maximum visibility without obscuring candles.
Makes expiry days stand out for quick recognition in both live trading and historical analysis.
Use Cases:
Quickly identify weekly option expiry days for planning.
Visually backtest expiry-day patterns or volatility setups.
Combine with other indicators for expiry-specific strategies.
Disclaimer:
This tool is for educational and informational purposes only. It does not provide financial advice and should not be relied upon as a sole basis for making investment decisions. Market conditions can change, and there is no guarantee of accuracy. Always do your own research and consult a licensed financial professional before trading or investing.

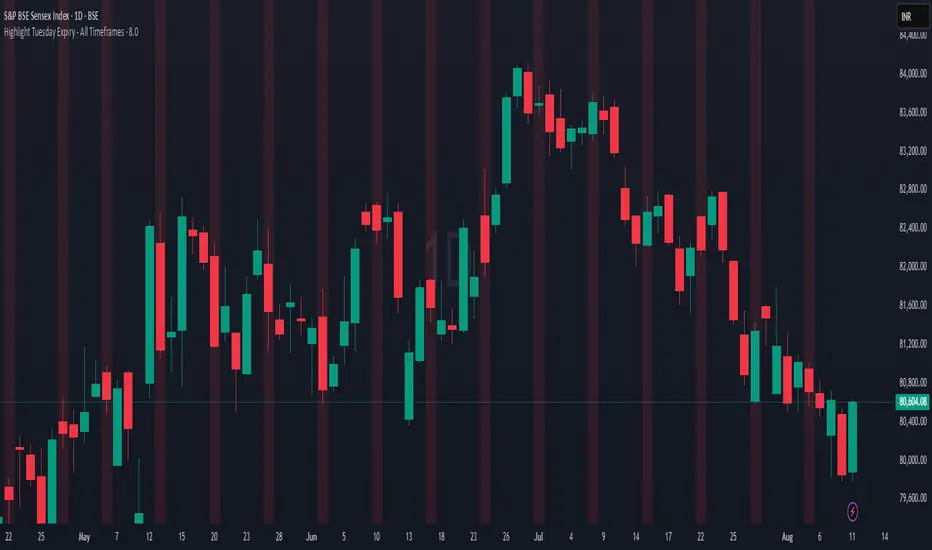
JJ Tuesday Expiry Highlighter – SensexHighlights every Tuesday across your chart for quick identification of Indian market weekly expiry days (Sensex expiry = Tuesday).
Features:
• Works on all timeframes
• Customizable highlight color
• Optional "Expiry" label on daily charts
• Useful for options traders tracking weekly expiry trends
Disclaimer:
This script is for informational and educational purposes only.
It does not constitute financial advice or a recommendation to trade.
Please do your own research and consult a licensed financial advisor.
Pro Tip:
Duplicate this script and change `dayofweek.tuesday` to `dayofweek.thursday` to mark Nifty expiry days as well.
Multi-Pip Grid This indicator draws multiple sets of horizontal grid lines on your chart at user-defined pip intervals. It’s designed for traders who want to quickly visualize key price levels spaced evenly apart in pips, with full control over pip size, grid spacing, and appearance.
Features:
Adjustable pip size — works for Forex, gold, crypto, and indices (e.g., 0.0001 for EURUSD, 0.10 for XAUUSD, 1 for NAS100).
Six grid spacings — 1000 pips, 500 pips, 250 pips, 125 pips, 62.5 pips, and 31.25 pips. Each grid can be toggled on or off.
Customizable base price — center the grid at the current market price or any manually entered price.
Optional snap-to-grid — automatically aligns the base price to the nearest multiple of the smallest step for perfect alignment.
Flexible range — choose how many grid lines are drawn above and below the base price.
Distinct colors per grid level for easy identification.
Automatic cleanup — removes old lines before redrawing to avoid clutter.
Use cases:
Identify large and small pip-based support/resistance zones.
Plan entries/exits using fixed pip distances.
Visualize scaled take-profit and stop-loss zones.
Overlay multiple timeframes with consistent pip spacing.
Multi-Pip Grid (Adjustable) — FixedThis indicator draws multiple sets of horizontal grid lines on your chart at user-defined pip intervals. It’s designed for traders who want to quickly visualize key price levels spaced evenly apart in pips, with full control over pip size, grid spacing, and appearance.
Features:
Adjustable pip size — works for Forex, gold, crypto, and indices (e.g., 0.0001 for EURUSD, 0.10 for XAUUSD, 1 for NAS100).
Six grid spacings — 1000 pips, 500 pips, 250 pips, 125 pips, 62.5 pips, and 31.25 pips. Each grid can be toggled on or off.
Customizable base price — center the grid at the current market price or any manually entered price.
Optional snap-to-grid — automatically aligns the base price to the nearest multiple of the smallest step for perfect alignment.
Flexible range — choose how many grid lines are drawn above and below the base price.
Distinct colors per grid level for easy identification.
Automatic cleanup — removes old lines before redrawing to avoid clutter.
Use cases:
Identify large and small pip-based support/resistance zones.
Plan entries/exits using fixed pip distances.
Visualize scaled take-profit and stop-loss zones.
Overlay multiple timeframes with consistent pip spacing.
Average NY Session Volatility (Last 10 Days)// @version=5
indicator("Average NY Session Volatility (Last 10 Days)", overlay=true)
// Inputs
session_input = input.session("0930-1600", "Session Time")
timezone_input = input.string("America/New_York", "Session Timezone")
lookback = 10
measure_mode = input.string("Points", "Measure", options= )
// Session detection (New York)
inSession = not na(time(timeframe.period, session_input, timezone_input))
var float sHigh = na
var float sLow = na
var float ranges = array.new_float()
sessionStart = inSession and not inSession
sessionEnd = not inSession and inSession
if sessionStart
sHigh := high
sLow := low
else if inSession
sHigh := na(sHigh) ? high : math.max(sHigh, high)
sLow := na(sLow) ? low : math.min(sLow, low)
if sessionEnd and not na(sHigh) and not na(sLow)
r = sHigh - sLow
if measure_mode == "Percent" and sLow != 0
r := (r / sLow) * 100
array.unshift(ranges, r)
if array.size(ranges) > lookback
array.pop(ranges)
sHigh := na
sLow := na
// Compute average
size = array.size(ranges)
avg = size > 0 ? array.sum(ranges) / size : na
// Show as floating table in top-left
var table t = table.new(position.top_right, 10, +10)
if not na(avg)
txt = measure_mode == "Percent" ? str.tostring(avg, "#.##") + "%" : str.tostring(avg, "#.#####")
table.cell(t, 0, 0, "Avg NY Vol (" + str.tostring(lookback) + "): " + txt, text_color=color.white, bgcolor=color.blue)

ADR/ATR Session No Probability Table by LKHere you go—clear, English docs you can drop into your script’s description or share with teammates.
ADR/ATR Session by LK — Overview
This indicator summarizes Average Daily Range (ADR) and Average True Range (ATR) for two horizons:
• Session H4 (e.g., 06:00–13:00 on a 4‑hour chart)
• Daily (D)
It shows:
• Current ADR/ATR values (using your chosen smoothing method)
• How much of ADR/ATR today/this bar has already been consumed (% of ADR/ATR)
• ADR/ATR as a percent of price
• Optional probability blocks: likelihood that %ADR will exceed user‑defined thresholds over a lookback window
• Optional on‑chart lines for the current H4 and Daily candles: Open, ADR High, ADR Low
⸻
What the metrics mean
• ADR (H4 / D): Moving average of the bar range (high - low).
• ATR (H4 / D): Moving average of True Range (max(hi-lo, |hi-close |, |lo-close |)).
• % of ADR (curr H4): (H4 range of the current H4 bar) / ADR(H4) × 100. Updates live even if the current time is outside the session.
• % of ADR (Daily): (today’s intra‑day range) / ADR(D) × 100.
• % of ATR (curr H4 / Daily): TR / ATR × 100 for that horizon.
• ADR % of Price / ATR % of Price: ADR or ATR divided by current price × 100 (a quick “volatility vs. price” gauge).
Session logic (H4): ADR/ATR(H4) only update on bars that fall inside the configured session window; outside the window the values hold steady (no recalculation “bleed”).
Daily range tracking: The indicator tracks today’s high/low in real‑time and resets at the day change.
⸻
Inputs (quick reference)
Core
• Length (ADR/ATR): smoothing length for ADR/ATR (default 21).
• Wait for Higher TF Bar Close: if true, updates ADR/ATR only after the higher‑TF bar closes when using request.security.
Timeframes
• Session Timeframe (H4): default 240.
• Daily Timeframe: default D.
Session time
• Session Timezone: “Chart” (default) or a fixed timezone.
• Session Start Hour, End Hour (minutes are fixed to 0 in this version).
Smoothing methods
• H4 ADR Method / H4 ATR Method: SMA/EMA/RMA/WMA.
• Daily ADR Method / Daily ATR Method: SMA/EMA/RMA/WMA.
Table appearance
• Table BG, Table Text, Table Font Size.
Lines (optional)
• Show current H4 segments, Show current Daily segments
• Line colors for Open / ADR High / ADR Low
• Line width
Probability
• H4 Probability Lookback (bars): number of H4 bars to examine (e.g., 300).
• Daily Probability Lookback (days): number of D bars (e.g., 180).
• ADR thresholds (%): CSV list of thresholds (e.g., 25,50,55,60,65,70,75,80,85,90,95,100,125,150).
The table will show the % of lookback bars where %ADR ≥ threshold.
Tip: If you want probabilities only for session H4 bars (not every H4 bar), ask and I can add a toggle to filter by inSess.
⸻
How to read the table
H4 block
• ADR (method) / ATR (method): the session‑aware averages.
• % of ADR (curr H4): live progress of this H4 bar toward the session ADR.
• ADR % of Price: ADR(H4) relative to price.
• % of ATR (curr H4) and ATR % of Price: same idea for ATR.
H4 Probability (lookback N bars)
• Rows like “≥ 80% ADR” show the fraction (in %) of the last N H4 bars that reached at least 80% of ADR(H4).
Daily block
• Mirrors the H4 block, but for Daily.
Daily Probability (lookback M days)
• Rows like “≥ 100% ADR” show the fraction of the last M daily bars whose daily range reached at least 100% of ADR(D).
⸻
Practical usage
• Use % of ADR (curr H4 / Daily) to judge exhaustion or room left in the day/session.
E.g., if Daily %ADR is already 95%, be cautious with momentum continuation trades.
• The probability tables give a quick historical context:
If “≥ 125% ADR” is ~18%, the market rarely stretches that far; your trade sizing/targets can reflect that.
• ADR/ATR % of Price helps normalize volatility between instruments.
⸻
Troubleshooting
• If probability rows are blank: ensure lookback windows are large enough (and that the chart has enough history).
• If ADR/ATR show … (NA): usually you don’t have enough bars for the chosen length/TF yet.
• If line segments are missing: verify you’re on a chart with visible current H4/D bars and the toggles are enabled.
⸻
Notes & customization ideas
• Add a toggle to count only session bars in H4 probability.
• Add separate thresholds for H4 vs Daily.
• Let users pick minutes for session start/end if needed.
• Add alerts when %ADR crosses specified thresholds.
If you want me to bundle any of the “ideas” above into the code, say the word and I’ll ship a clean patch.
