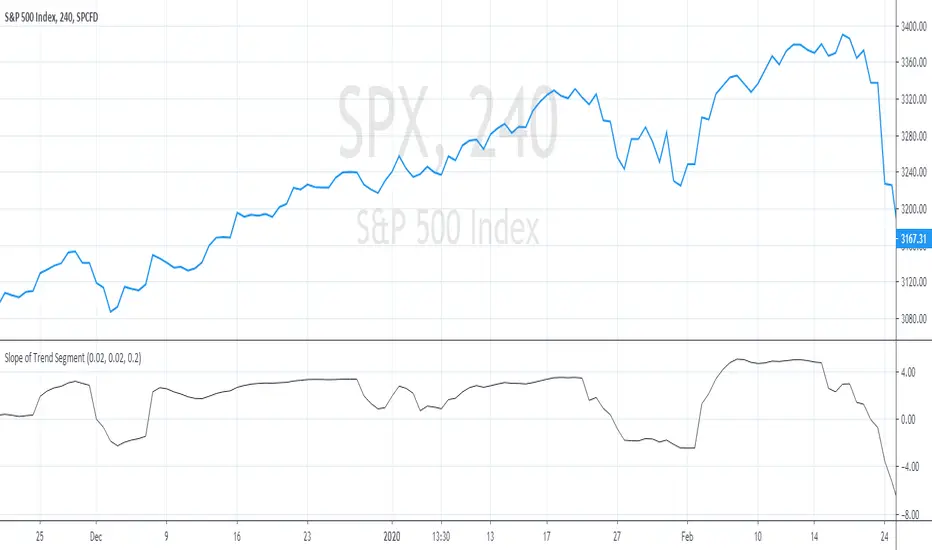
Monthly, Quaterly, Yearly SMA trendsIt highlights on the chart when the SMA20 crosses the SMA60 etc. for the Monthly, Quaterly, Yearly SMA trends.
Trends

Triple SMA Strategy with entries based on sma price closesHi! :)
This strategy is made for intraday trades, especially on 5 sec - 5 min charts to follow the trend.
I have not tested on higher timeframes, but feel free to play with the values.
I have set a basic value for the 3 SMA at
-200
-400
-600
We will use an oscillator for entries which is not mine. Link ->
The oscillator mentioned above is just for visualization purposes, You do not need to get the signals, but You can see how scripts are generated with different values.
When the price above/below all the 3 SMA and oscillator crosses above/below "value you set" - You will get the buy or sell signal.
Your stop will be where the slowest SMA is.
Pyramiding is set for 10.
You can manually set 3 take profit and quantity levels.
Basic values are 1 %, 2 %, and 6 % for taking profits - You can change it based on how volatile the asset is.
Basic quantity values are 30 % at each level.
Hope You find it useful :)

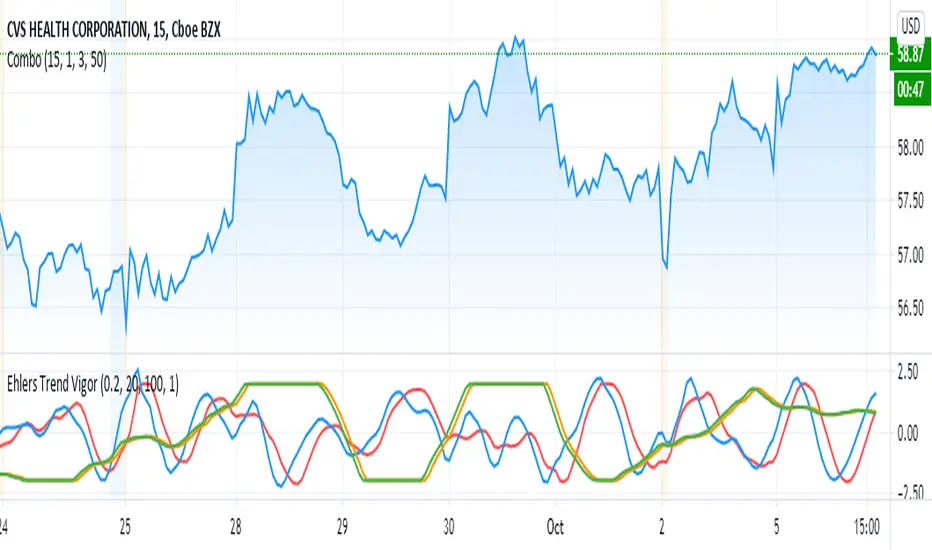
Ehlers Trend Vigor NormalizedThanks to MasBart, I updated the earlier version to normalize signal and lead according to vigor and trigger. Vigor and trigger are limited to +-2. Now signal and lead are also in that range.
The code of interest is lines 39-43:
tmpdif = (BP - nz(BP ))/close
a = array.new_float(0)
for i = 0 to win-1
array.push(a, tmpdif )
den = array.max(a)
den is then used to normalize the BP values (bandpass filter).
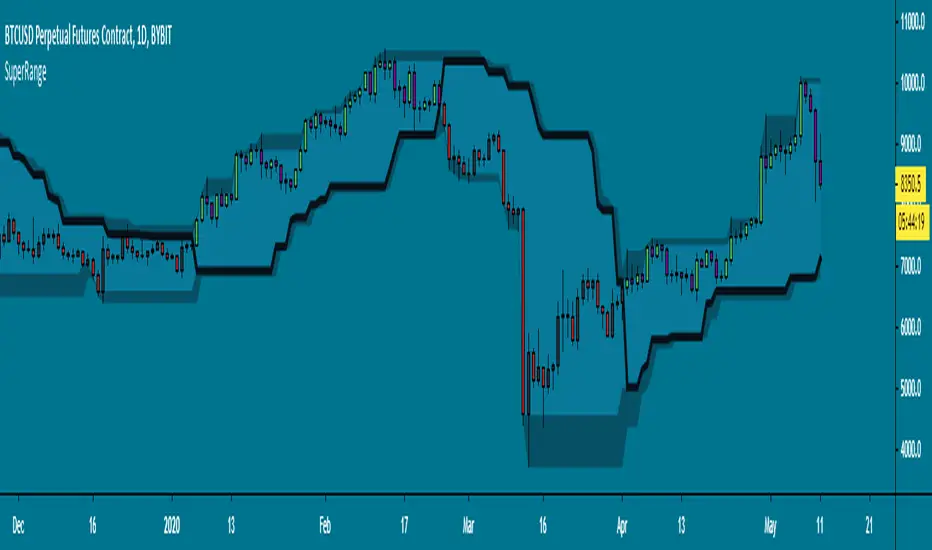
SuperRange - evoA SuperTrend like indicator based on highest and lowest candle close from a few bars back. It looks almost the same as Donchian Channels but with a dominant trend direction inside (Black line).
Uptrend: Candle closed higher than highest close
Downtrend: Candle closed lower than lowest close
This works best on higher time frames since a daily close is more powerful than a 15 minute close.
A few examples how you could use this:
Use support & resistance
Apply a moving average
Buy and sell the break-out
All perfect world examples, this does not happen all the time off course.. Its just for the idea. There are many ways to trade this so feel free to share in the comments, good luck and follow the trend! :)
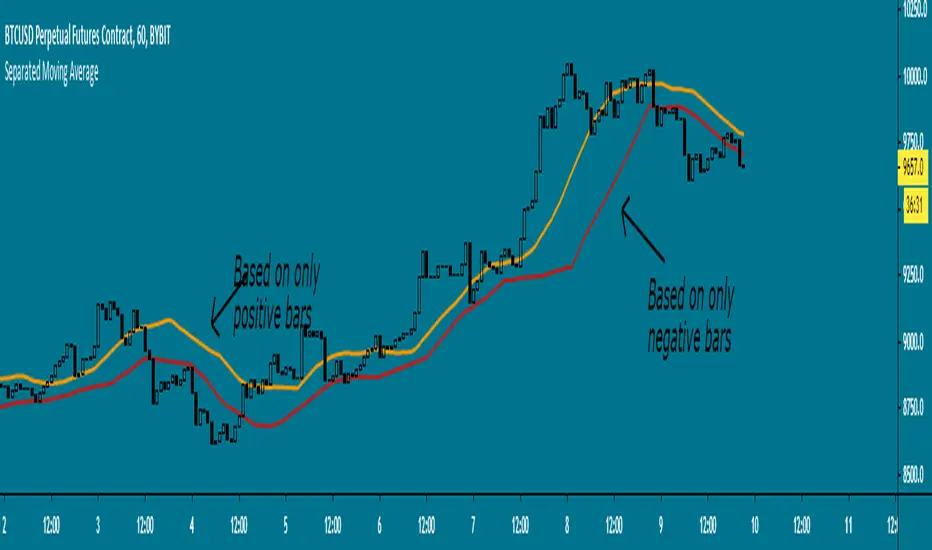
Separated Moving Average - evoHere are two moving averages, one based on positive candles and the other based on negative candles. If the current bar is positive, the negative MA will use its last known negative bar for the calculation. The default setting uses Heikin Ashi to smooth the candles with the trend, you can turn this off if you want in inputs.
Let me know if you find it useful :)
Automatic TrendlinesIntroduction
For a full free tutorial explaining this code in more detail, visit the backtest-rookies (.com) website.
This indicator will plot two trend lines at any given time. A resistance trend line and a support trend line. The resistance trend is shown with red circles and is created by joining swing highs together. The second is a support trend which is created by joining swing lows.
Since we need swings to make the trend, the trend line code contains code for the swing detection. You can play around with the swing detection to alter how frequently new trend lines are detected. Relying on swings also means that there will be some delay in trend detection depending on how you configure the swing detection. The higher you set rightbars, the more lag you will have before a trend is detected. However, at the same time the quality of the pivots found will increase. So it is a trade-off you need to come to terms with and decide what the best settings are for you.
Lines
A single trend line is made up of several components.
Pivot Points: Marked as blue or orange circles. There will be two pivots per trend.
Orange/Purple Lines: Connecting all pivot points. You will see these lines change direction slightly each time a new pivot is detected (new circles appear).
Green/Red Circle lines: Showing the trend line from the earliest moment a new trend is detected.
Blue Dashed lines: Joining the purple and green/red circle lines so the full trend line can be seen.
Note: The blue dashed lines use pine-scripts drawing functions. As such, there is a limit to how many of these can be placed on a chart. When the limit is reached, the oldest line will be removed so the newest can be drawn. This means that if you detect enough trends and scroll back in time, the blue dashed lines will disappear at some point!

Gann Trend OscillatorDeveloped by Robert Krausz, the Gann Trend Oscillator is a trend-following indicator used to determine the financial instruments long-term price direction.

QuantNomad - SuperTrend - TSLA - 1mInteresting performance for Super Trend strategy for Tesla ( TSLA ) 1m chart.
Params: ST Mult: 3, ST Period 120.
Performance:61% profit, 637 trades, only 33% prof, 4.84% dd , 0.4 Sharpe.
On its own, it might be not a very good strategy, but the big amount of trades allows you to add more filters and improve it.
The strategy is not bad both with "when" params when strategy executed on open of next bar and with stop orders when strategy enters on exact Super Trend level.
You can comment/uncomment lines in the code and switch from one approach to another.
And remember:
Past performance does not guarantee future results.


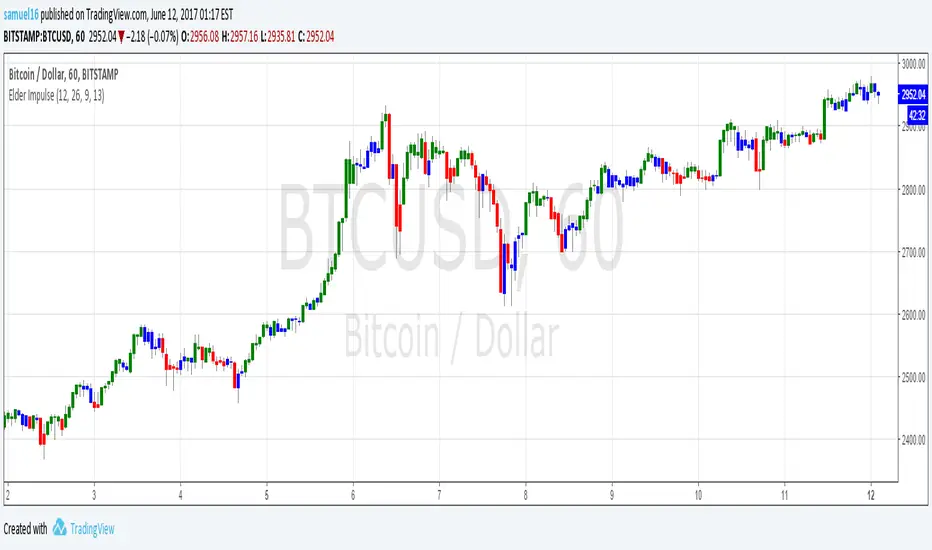
Elder Impulse SystemQuickly Identify Trends with the Elder Impulse Indicator.
Pretty much the same as , but written from scratch to be simpler to use and the source code easier to read (no offense, LazyBear)
For more info, see stockcharts.com