Trend Lines for RSI, CCI, Momentum, OBVHello Traders!
After publishing Trend Lines for RSI yesterday, I realized that Trend Lines for more indicators needed by the traders. so I decided to make it for four different indicators: RSI, CCI, OBV, Momentum
In the indicator options you can choose the indicator from pull-down menu.
How it works?
- On each bar it finds last 10 higher and lower Pivot Points (PP) for the indicator.
- from first bar to 10. Pivot Point it searchs if a trend line is possible
- for each PP it starts searching from the last PP .
- it checks if drawing a trend line possible or not and also it's broken or not
- if it's broken then optionally it shows broken trend lines as dotted (or you can option not to see broken lines)
- if it finds a continues trend line then it stops searhing more and draw trend line, this is done by checking angles (I did this to make the script faster, otherwise you may get error because of it needs time more than .2sec)
- the script makes this process for each PP
- then shows the trend lines
P.S. it may need 3-10 seconds when you added the script to the chart at first (because of calculations)
Trend lines for CCI:
Trend Lines for OBV
Trend Lines for Momentum:
You may want to watch how Trend Lines script works (that was made for RSI)
s3.tradingview.com
If you still didn't see Trend Lines v2 then visit:
All Comments are welcome..
Enjoy!
Trendtrading

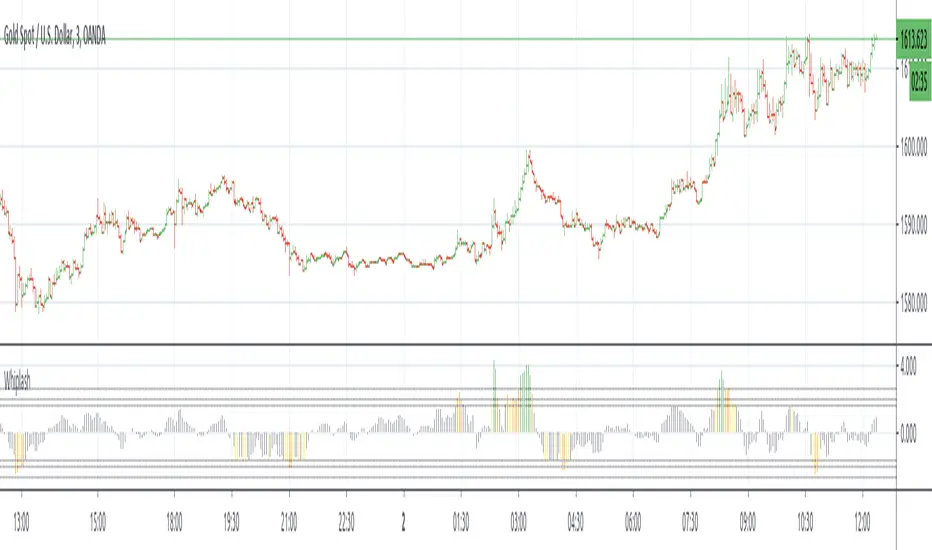
WhipLashThis is a study to determine if small candle bodies (little difference between open and close), regardless of overall candle length (high/low), can be used to filter choppy markets.
The indicator will calculate the selected average "MA Mode" of (close-open). To standardize this result and ensure any filters/thresholds do not need to be recalculated for each instrument the result will be used to calculate the Z Score.
The idea is that when candle bodies are small there is very little actual price movement, and therefore price is choppy. When considering the Z Score of that result, any outliers ie larger candle bodies, could show a potential trend forming. This indicator is similar to QStick but allows more customization by the user.
MA Mode determines which MA is used to smooth the results of (close-open)
Price Smoothing is the number of running periods the MA Mode is calculated for.
The three Thresholds are preset to the 90%, 95%, and 99% levels for Z Score. If these thresholds are altered you may wish to also alter the horizontal lines programmed for each level on the positive and negative sides.
The Z Length is the period for which the Z Score is calculated
Multiple MA Options Credits to @Fractured
Bits and Pieces from @AlexGrover, @Montyjus, and @Jiehonglim
As always, trade at your own risk.
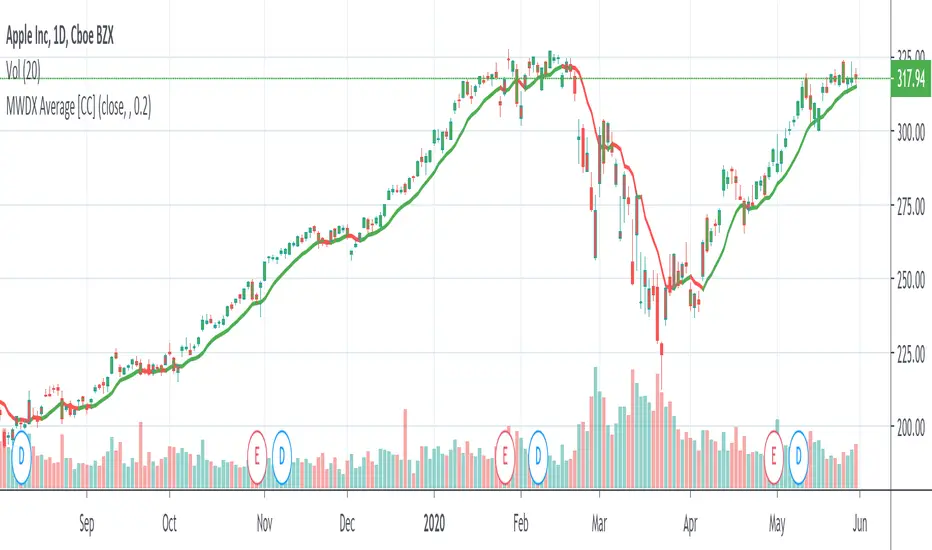
MWDX AverageThis is a variation of an exponential moving average which follows the price pretty smoothly. Feel free to change the factor to adjust how closely it follows the price. I set the default to 0.2
Let me know if you want me to write code for any other indicators!
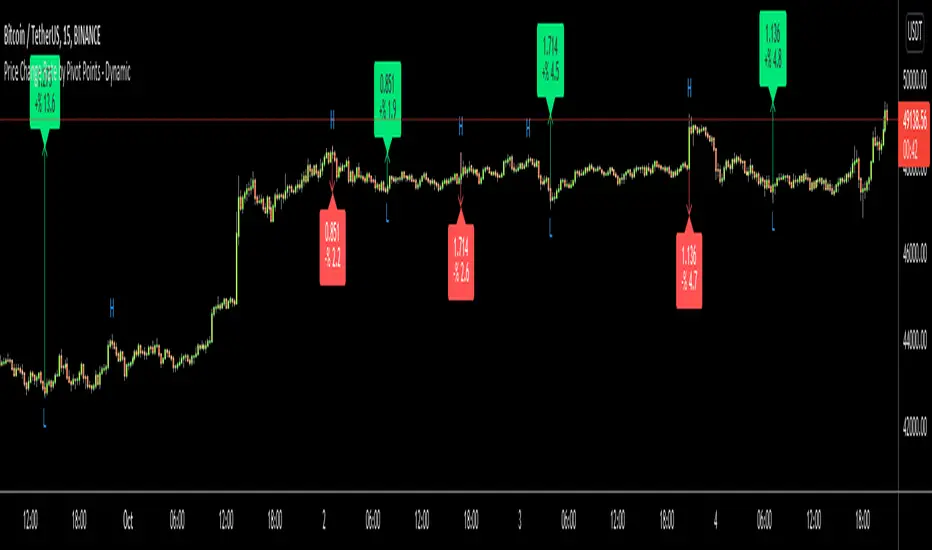
Price Change Rate by Pivot Points - DynamicHi Everyone
Usually I need Price Change info and I believe most of you need this info too. I want to see how it increased/decreased. I automate this by using Pivot Points.
it works dynamically and it uses Pivot Highs and Pivot Lows accordingly. That means it calculates which one to use.
Please watch following video:
Enjoy!
Trend Following Moving AveragesWhile analysing a chart, one of the biggest problem is to see if there is trend or not. While thinking about it, I found the idea to analyse moving averages in channel and their momentum according to channel width. I already published it as Trend Following Bar as you see at bottom of the chart.
How it Works?
On each bar it creates a channel by highest/lowest point of a MA. highest point is upper line and lowest point is lower line of the MA channel,
It gets highest and lowest point of last 300 bars, (say Price Channel )
If the width of MA channel is greater than certain rate of price channel then it decides there is trend
After it decided there is trend, it calculates the rate between channel and MA. Bigger result means stronger trend.
According to rate of MA channel and the price channel , MA Line becomes lighter/darker. so when you look at the MA Line's color you can see the trend strength.
Some details about my idea:
Options:
You can choose following MA types as source: EMA, SMA , RMA, WMA , VWMA
"Period to Check Trend" is the period to create MA channel. Bigger period cause more sensitivity.
"Trend Channel Rate %" is rate of price channel . Price channel created by using highest/lowest of last 300 bars. I did this to make the script works on all time frames correctly.
"Use Linear Regression" is used to get rid of noise. it may cause 1-2 bars latency.
Trend Following Bar script:
All comments are welcome!.
Enjoy!

Trend Lines v2Hello Everyone. After working on new and better trend lines script for couple of weeks, finally I am proud to publish Trend Lines v2.
How it works?
- On each bar it finds last 10 higher and lower Pivot Points (PP).
- from first bar to 10. PP it search if a trend line is possible
- for each it starts searching from the last PP.
- it check if drawing a trend line possible or not and also it's broken or not
- if it's broken then optionally it shows broken trend lines as dotted
- if it finds a continues trend line and stop searhing more and draw trend line (I did this to make the script faster, otherwise you may get error because of it needs time more than .2sec)
- the script makes this process for each PP
optionally trend lines may be Solid or Dashed
optionally you may get rid of broken trend lines if you think it's crowded
and sometimes you may not see any trend line on the chart. this means you need to adjust the period for Pivot Points accordingly
also I made a video. if you watch this video you can see how the script works.
Important! after you add this tool to the chart you may need zoom-in and zoom-out to see all lines!
I thought a lot to make it free or not then I decided make it free and open source. you should know there is a lot of effort for this script, so if you think this is usefull please consider a donation ;)
Enjoy!

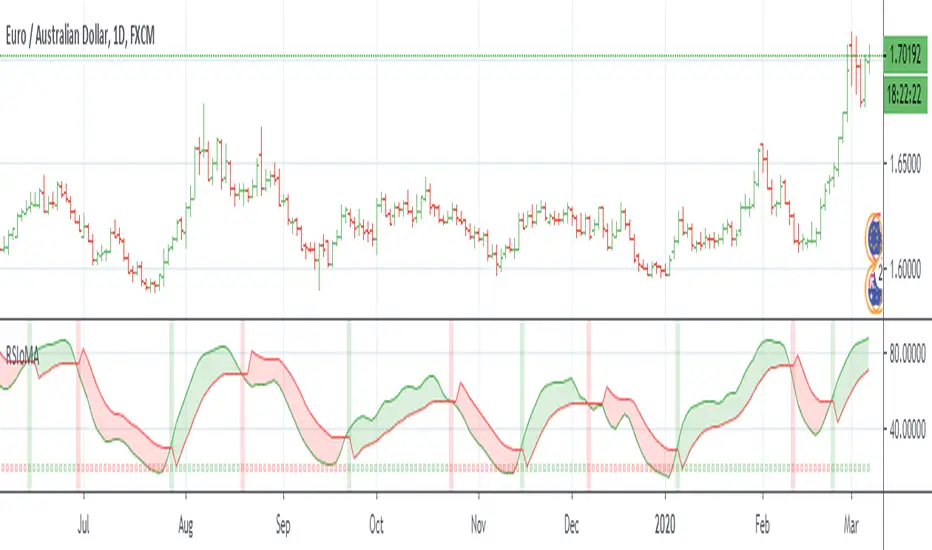
RSI of MAsRSI of MAs is designed to calculate the moving average for a specific period, and then take the RSI of that value. This script allows the user to select which moving average they would like to utilize for the calculation, as well as customizing how the Signal Line is calculated. There are many combinations available and you will need to tune the indicator to fit your trading style. The Signal Line is designed to indicate when there is a potential change in price action. If the Signal Line is below RSIoMA, price is bullish. If the Signal Line is above RSIoMA, price is bearish.
MA Period is the length/period the moving average is calculated with
RSI Period is the length/period the RSI is calculated with
RSI MA Mode determines which moving average is applied to the MA period
Signal Line determines which moving average or QQE is used to calculate the signal line
Signal Line Period is the length/period the Signal Line is calculated with
As always, trade at your own risk.
Multiple MA Options Credits to @Fractured
Signal Line Options Credits to @lejmer
Bits and Pieces from @AlexGrover, @Montyjus, and @Jiehonglim
VQZL Z-ScoreVolatility Qaulity Zero Line attempts to keep a trader out of ranging markets, but the original calculation on TradingView had to be adjusted for each instrument. To avoid this issue, I have applied a z-score calculation to the VQZL so the result is standardized for all instruments. A Z-Score is simply a value's relationship to the mean (average) of a group of values, measured in terms of standard deviations from the mean.
This calculation allows us to compare current volatility to the mean (moving average) of the population (Z-Length). The closer the VQZL Z-Score is to the mean, the closer it will be to the Zero Line and therefore price is likely consolidating and choppy. The farther VQZL Z-Score is from the mean, the more likely price is trending.
The MA Mode determines the Moving Average used to calculate VQZL itself. The Z-Score is ALWAYS calculated with a simple moving average (as that is the standard calculation for Z-Score).
The Threshold Levels are the levels at which VQZL Z-Score will change from gray to yellow, orange, green (bullish), or red (bearish). These levels can be adjusted but you should adjust the Threshold Lines as well (in the style section), so they line up with your adjusted values.
Statistically speaking, confidence levels in relation to Z-Score are noted below. The built in Threshold Levels are the positive and negative values for 90%, 95%, and 99%. This would indicate when volatility is greater than these values they are out of the ordinary from the standard range. You may wish to adjust these levels for VQZL Z-Score to be more responsive to your trading need
80% :: 1.28
85% :: 1.44
90% :: 1.64
95% :: 1.96
99% :: 2.58
As always, trade at your own risk.
VQZL Created by Investo And Adapted From @sarangab
Multiple MA Options Credits to @Fractured
Bits and Pieces from @AlexGrover and @Montyjus

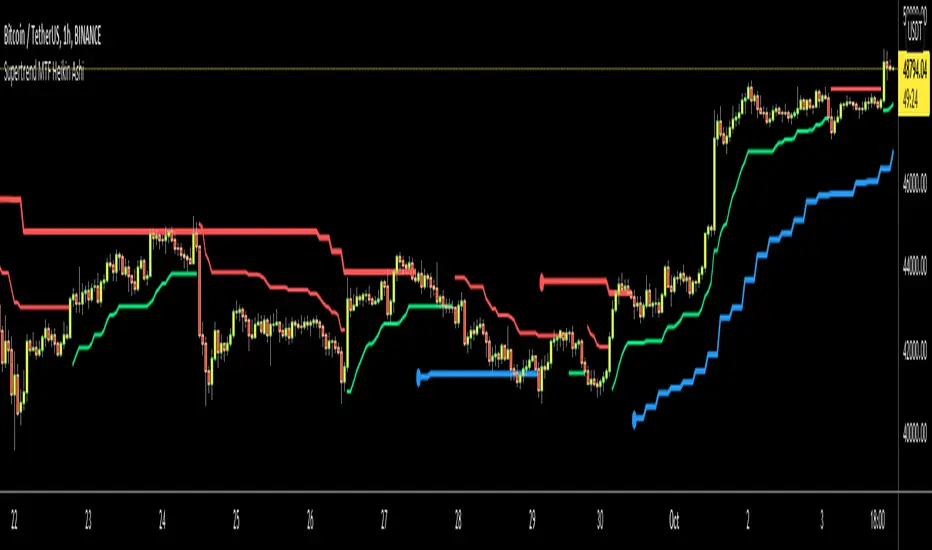
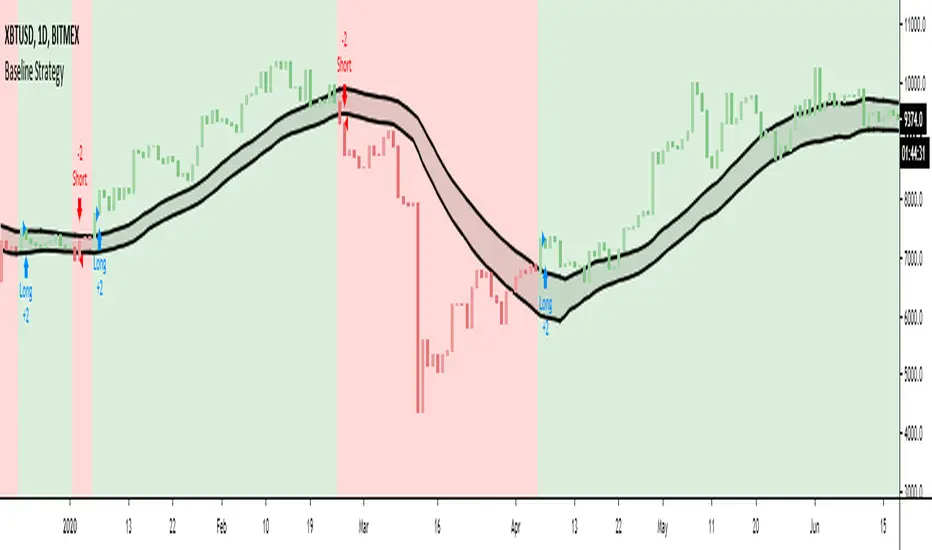
Supertrend MTF Heikin AshiThis is non-repaiting Supertrend Multi Time Frame script, uses Heikin Ashi Candles as source on normal chart
There is an option for Higher Time Frame. if you choose "Auto" then Higher Time Frame calculation is made by the script. If you choose "User Defined" option and then you can select Time Frame.
You better use this script with other indicators such as RSI, Momentum etc.
Enjoy!
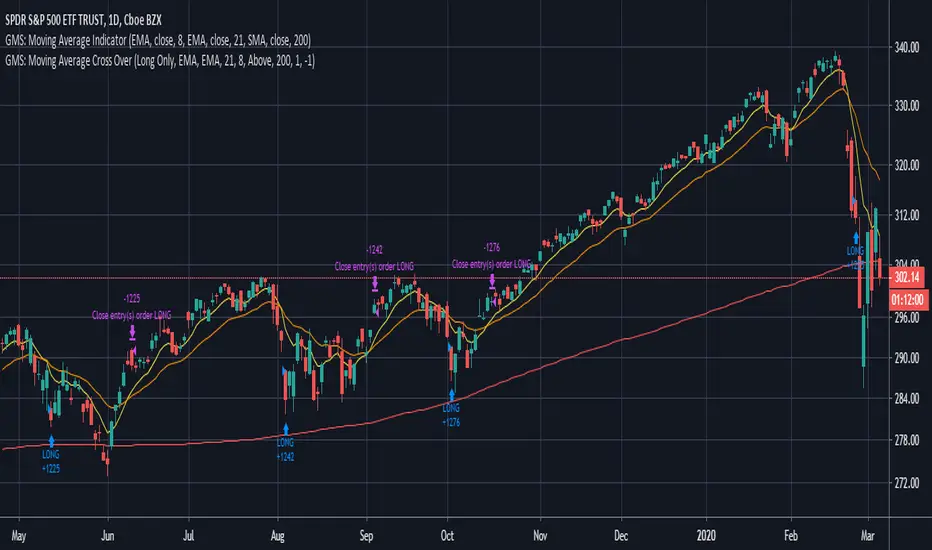
GMS: Moving Average Crossover StrategyThis is a moving average crossover system built the way I would want it to be.
- The moving averages included are SMA, EMA, WMA, VWMA.
- You can select either for the first moving average or the second moving average.
- You can also select to see the Long trades, Short trades, or both at the same time.
- There is also a simple moving average trend filter. When this is selected, it only applies to the entries of a trade and not the exit. There are situations where the entry is above the trend filter and the exit is below.
The source code should be open so feel free to adapt it, make it more efficient, or take some part for your own project!
I hope it helps,
Andre
GMS: RSI & ROC StrategyThis is a basic strategy like the RSI one I posted. This one adds in the Rate of Change indicator as well.
You can separate the two for RSI only and ROC only. Everything else is the same as the RSI strategy.
- Simple moving average trend filter.
- Simple moving average trade exit.
- Both long and short or each on it's own.
The source code should be open if you want to see it or modify it for your own project. I hope it helps!
Andre
Global Market Signals

Gann Trend OscillatorDeveloped by Robert Krausz, the Gann Trend Oscillator is a trend-following indicator used to determine the financial instruments long-term price direction.

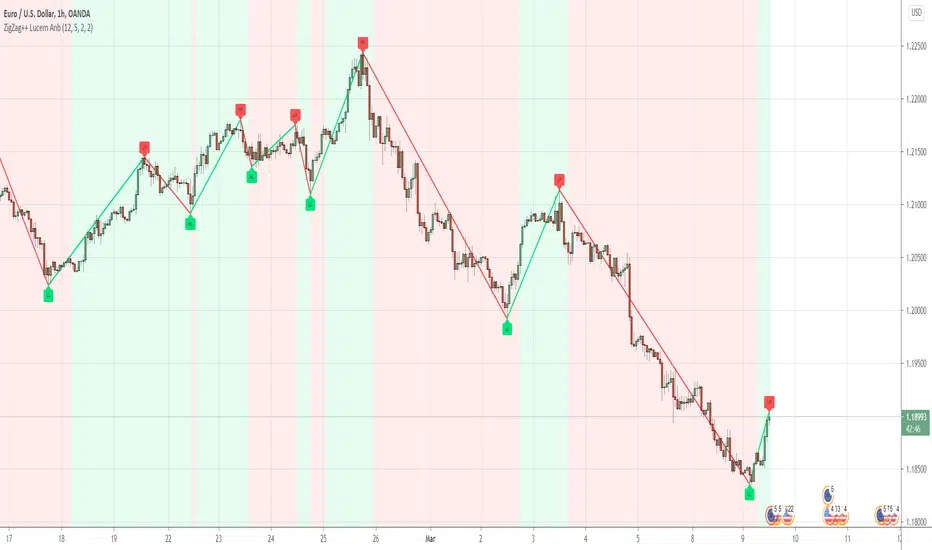
ZigZag++Hey Awesome Traders
I noticed people were so happy with my ZigZag lucemanb script and so I made one that is more user-friendly and customizable
Please note the original one is dedicated to developers, The code is very minimal for fast understanding when anyone wants to use it in their development
In this script, I have included several features like multi-timeframe and alerts. Do take a look and enjoy
If you are using the indicator, please comment down the link to your script
If you would love to support my work through donations, Am so happy to receive them
ADDITIONAL FEATURES
Do u have an idea or a feature that you want to be added,
You can ping me or ask about it here, I can always update
Check out some of the best works i have done with this script
1. Angle trading
2. Harmonic Patterns
Divergence for many indicator v3Hello Everyone. Almost one year later, with Pine version 4, I developed new version of the Divergence for many Indicator.
It analyses divergences for 10 predefined indicators and then draws line on the graph. Red for negatif divergence (means prices may go down or trend reversal), Lime for positive divergences (means prices may go up or trend reversal)
Divergences version 2 has latency because it waits higher time frame completion. in this new version the script uses Pivot Points and on every bar it checks divergence between last Pivot point and current bar and if it finds any then immediately draws line and removes old one. so there is no latency with this version.
There are predefined 10 indicators in the script, you have option to choose which indicators the script would analyse for divergence. (RSI , MACD , MACD Histogram, Stochastic , CCI , Momentum, OBV, Diosc, VWMACD and CMF)
In replay mode you can see how the script puts new divergence line and removes old one. you better see it for yourself by using replay mode.
Hope you Enjoy!

Trend LinesHello Everyone! This is my new trend lines script (after beta version that was published almost one year ago)
The idea is to find Pivot Highs (PH) and Pivot Lows(PL) first.
Then, If current PH is smaller then previous PH (means no new higher high and possible downtrend) then draw trend line using them. and also it checks previous trend line (if exits) and if current angle is smaller then don't extend previous one.
Same idea when using Pivot Lows, If current PL is higher then previous PL (means no new lower low and possible uptrend) then draw trend line using them. and also it checks previous trend line (if exits) and if current angle is smaller then don't extend previous one.
Optionally style of old trend lines drawn as dashed.
Hope you enjoy it!

Trend Following or Mean RevertingThe strategy checks nature of the instruments. It Buys if the close is greater than yesterday's high, reverse the position if the close is lower than yesterday's low and repeat the process.
1. If it is trend following then the equity curve will be in uptrend
2. If it is mean reverting then the equity curve will be downtrend
Thanks to Rayner Teo.

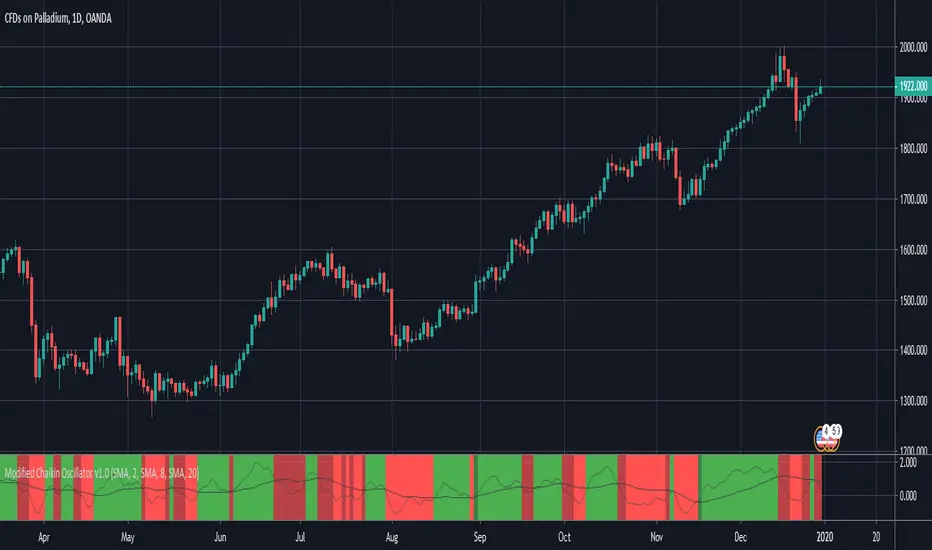
Modified Chaikin OscillatorThis is a modified version of the Chaikin Oscillator. The idea is to find accumulation and distribution phases in the market to identify when institutions are building their positions.
It uses acc/dist but as an oscillator, just like the Chaikin Oscillator, but not to find overbought or oversold areas, but to find trends. It functions like a MACD. It takes a fast moving average of the acc/dist and a slow moving average of the acc/dist, and plots the differense to create the oscillator, and uses a signal line to use for entries.
A strong signal is when the oscillator crosses the signal line while the signal line is on he right side of 0. So a crossover (long) when the signal line is below 0 woul be a weak signal, while a crossover (long) when the signal line is above 0 would be a strong signal.
By default, tick volume is discarded in the calculation, which makes this version behave a bit differently than the standard Chaikin Oscillator. This is because the indicator is mostly used to trade CFD's. If used to trade stocks for example, it is better to include the volume by unchecking that checkbox in the indicator settings.
BRIGHT GREEN = Strong signal LONG (signal line is above 0)
DARK GREEN = Weak signal LONG (signal line is below 0)
BRIGHT RED = Strong signal SHORT (signal line is below 0)
DARK RED = Weak signal SHORT (signal line is above 0)
Ehlers Fractal Adaptive Moving Average with Bands [Bitcoinduke]FRAMA – What is it?
Fractal Adaptive Moving Average Technical Indicator ( FRAMA ) was developed by John Ehlers, code was implemented by TradingView user Shizaru. I've updated it to Pine Script 4 and added Bands Extension.
This indicator is constructed based on the algorithm of the Exponential Moving Average , in which the smoothing factor is calculated based on the current fractal dimension of the price series.
Advantages:
possibility to follow strong trend movements
determine moments of price consolidation ( FRAMA sufficiently slow down at these moments)
FRAMA + Bands
The FRAMA serves as a base for the Upper and Lower Bands which are used as a way to measure volatility by observing the relationship between the Bands and price. Typically the Upper and Lower Bands are set to two standard deviations away from the FRAMA ; however it should be adjusted depending on the task.

Pivot Reversal Strategy - FIGS & DATES 2.0Simple Pivot Reversal Strategy with some adding settings.
Date Range: To test over specific market conditions.
Initial Capitol: $10K - This is a more realistic representation of funds used this strategy (for me anyway). The default of $100K can give different results (usually better) than when using a smaller balance.
Order Size: 100% Equity - These trend following strategies typically used this way, going all in each direction.
Commission: .075% - It's always disheartening to think you've found a ridiculously good setting, and then realize you forgot to add the commission.
All of these settings can be changed, but it's easier for me (and more fool proof) to have them set as default.

Signal To Noise Ratio IndicatorThis is a trend indicator at its core so combine with rsi or a moving average of your choice to see which direction the stock is trending in.
Only enter a position (long or short) when signal to noise ratio is above the signal line
This is one of my first indicators posted on here so be sure to leave me feedback

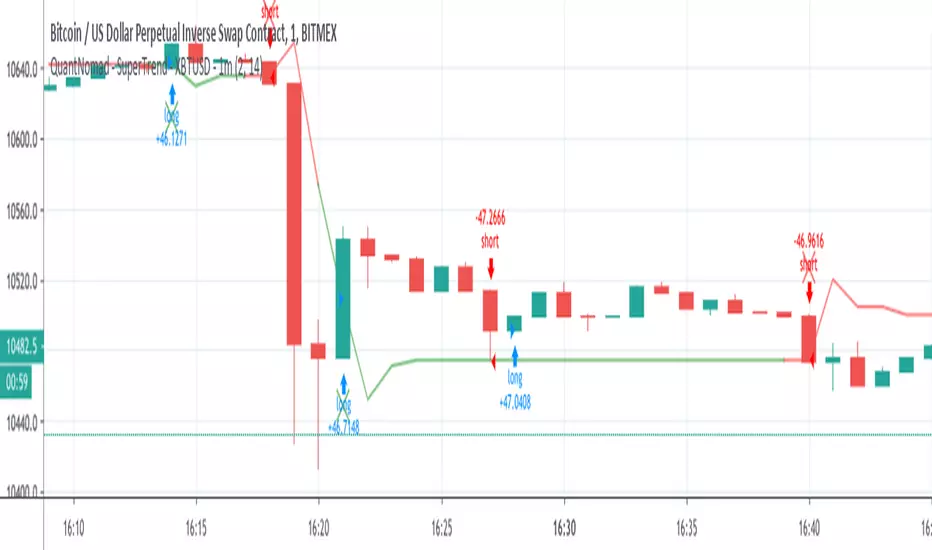
QuantNomad - SuperTrend - XBTUSD - 1mInteresting performance for Super Trend strategy for XBTUSD 1m chart.
Params: ST Mult: 2, ST Period 14.
Performance: 144% profit, 1988 trades, only 41% prof, 2.04% dd , 2.51 Sharpe.
On its own, it might be not a very good strategy, but the big amount of trades allows you to add more filters and improve it.
And remember:
Past performance does not guarantee future results.
QuantNomad - SuperTrend - TSLA - 1mInteresting performance for Super Trend strategy for Tesla ( TSLA ) 1m chart.
Params: ST Mult: 3, ST Period 120.
Performance:61% profit, 637 trades, only 33% prof, 4.84% dd , 0.4 Sharpe.
On its own, it might be not a very good strategy, but the big amount of trades allows you to add more filters and improve it.
The strategy is not bad both with "when" params when strategy executed on open of next bar and with stop orders when strategy enters on exact Super Trend level.
You can comment/uncomment lines in the code and switch from one approach to another.
And remember:
Past performance does not guarantee future results.
