Triangle Breakout Strategy for BTC —[MARK804]Triangle Breakout Strategy for BTC —
Overview
The \ strategy targets high-probability breakout trades on **Bitcoin (BTC)** by leveraging triangle chart patterns—symmetrical, ascending, or descending. These formations reflect periods of consolidation where neither bulls nor bears dominate, often preceding strong directional moves.
Key Components
Pattern Recognition
Triangle patterns form when BTC price action consolidates within two converging trendlines—either sloping or horizontal. At least two swing highs and two swing lows are needed to construct reliable trendlines. Volume typically contracts during formation, highlighting reduced volatility before a breakout.
Breakout Confirmation
A breakout occurs when BTC closes outside the triangle’s boundaries, preferably accompanied by a volume surge for validation.
Entry & Targets
Entry: Go long if price breaks above; go short if price breaks below the triangle.
Target: Estimate by measuring the triangle’s maximum height and projecting that distance from the breakout point.
Stops & Risk Management
Position stop-loss just beyond the opposite trendline to limit losses from false breakouts.
Additional Confirmation Tools
Supplement the pattern with RSI, MACD, or other indicators to reduce false signals and fortify your analysis.
Applying to BTC
Bitcoin frequently forms triangle patterns around key psychological levels, with trader discussions often noting tightening ranges and imminent moves. For instance:
> “Bitcoin is coiling up. Big move coming in the next 72 hours. Symmetric triangle is a classic setup before a breakout.”
Why MARK804 Works for BTC
| Feature | Benefit for BTC Traders |
| ----------------------------- | ------------------------------------------------------------- |
| Structured pattern | Clear entry/exit rules improve consistency |
| Measured targets | Offers realistic profit projections |
| Risk discipline | Tight stop-loss controls losses from erratic moves |
| Enhanced reliability | Volume and indicator filters reduce false breakouts |
Ready to customize this strategy with specific entry timeframes, indicator thresholds, or live chart references? Just say the word—I can tailor it further for BTC trading.
DJ FXCM Index

Dollar Index (DXY) Candles [Loxx]Dollar Index (DXY) Candles is an educational/experimental indicator that attempts to recreate the Dollar Index DXY: TVC:DXY .This is useful so others traders can see how the DXY is calculated.
The U.S. Dollar Index (USDX, DXY, DX) is an index (or measure) of the value of the United States dollar relative to a basket of foreign currencies, often referred to as a basket of U.S. trade partners' currencies. The Index goes up when the U.S. dollar gains "strength" (value) when compared to other currencies.
The index is maintained and published by ICE (Intercontinental Exchange, Inc.), with the name "U.S. Dollar Index" a registered trademark.
It is a weighted geometric mean of the dollar's value relative to following select currencies:
Euro (EUR), 57.6% weight.
Japanese yen (JPY) 13.6% weight.
Pound sterling (GBP), 11.9% weight.
Canadian dollar (CAD), 9.1% weight.
Swedish krona (SEK), 4.2% weight.
Swiss franc (CHF) 3.6% weight.
USDX = 50.14348112 × EURUSD^-0.576 × USDJPY^0.136 × GBPUSD^-0.119 × USDCAD^0.091 × USDSEK^0.042 × USDCHF^0.036
These candles won't match the ticker DXY dollar for dollar, but it comes very close. Either way, the general trend and volatility of this synthetic recreation is the same as the DXY.
Read more here: en.wikipedia.org

Correlation of chart symbol to different Index-ETF-currencyScript plots correlation of chart symbol to a variety of indexes, symbols, equities. ** Original idea was to find Bitcoin correlation, which I did not. Built in correlations are: Nikie, DAX, SPY, AAPL, US Dollar, Gold, EURUSD, USDCNY, EEM, QQQ, XLK, XLF, USDJPY, EURGBP

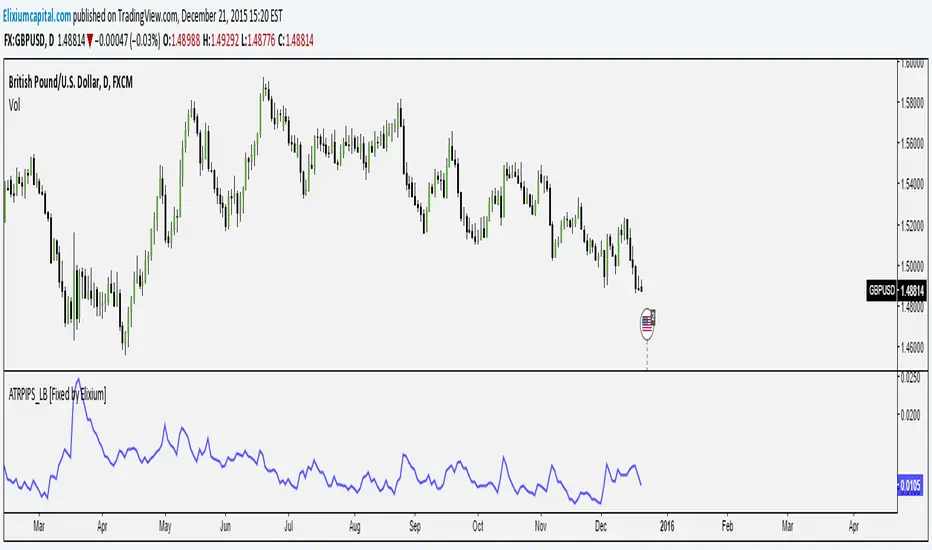
ATR Pips [LazyBear] [Fixed by Elixium]This is ATR in pips. This was requested by user @ElixiumCapital on Twitter. ATRPIPs in his words:
How to use: Change the chart to the Daily time frame. The indicators value e.g. 0.0105 means that the average daily range of the past 5 trading days is 105 pips. (On standard pairs like EURUSD, GBPUSD)
"ATR PIPs is useful for finding markets with your desired amount of volatility, for example I prefer to trade forex pairs with the highest amount of volatility in the past 5 days, setting the length parameter to 5 days. And setting my stop loss at 25% to 33% of the the indicators value."
Fixed: Default parameters and a critical bug.