Percent Change of Range Candles - FullPercent Change of Range Candles – Full (PCR Full)
Description:
PCR Full is a custom momentum indicator that measures the percentage price change relative to a defined range, offering traders a unique way to evaluate strength, direction, and potential reversals in price movement.
How it works:
The main value (PCR) is calculated by comparing the price change over a selected number of candles (length) to the range between the highest high and lowest low in the same period.
This percentage change is normalized and visualized with dynamic candles on the subgraph.
Reference levels at +100, +50, 0, -50, and -100 serve as key zones to indicate potential overbought/oversold conditions, continuation, or neutrality.
How to read the indicator:
1. Trend continuation:
When PCR breaks above +50 and holds, it often confirms a strong bullish move.
Similarly, values below -50 and staying low signal a bearish continuation.
2. Wick behavior (volatility insight):
Long wicks on PCR candles suggest uncertainty or failed breakout attempts.
Short or no wicks with strong body color show stable momentum and conviction.
On the chart, multiple long wicks near -50 suggest bulls are attempting to push price upward, but lack the strength — until a confirmed breakout.
3. Polarity transition (Bearish to Bullish or vice versa):
A transition from negative PCR values to above zero shows that the market is possibly turning.
Especially if PCR climbs gradually and stabilizes above zero, it indicates a developing bullish phase.
Components:
Main PCR line: Color-coded (green for rising, red for falling).
Open Average (gray line): Smooths recent PCR values, indicating balance.
High/Low adaptive bands: Adjust dynamically to PCR polarity.
PCR Candles: Visualize OHLC of PCR data for enhanced interpretation.
Suggested use cases:
Enter trend trades when PCR crosses +50 or -50 with volume or price confirmation.
Watch for reversal signs near ±100 if PCR fails to break further.
Use 0 line as a neutral zone — markets hovering near 0 are often in consolidation.
Combine with price action or oscillators like RSI/MACD for additional signals.
Customization:
The length input allows users to define the range for PCR calculations, making it adjustable to various timeframes and strategies (scalping, intraday, swing).
Volatility

Session Range ProjectionsSession Range Projections
Purpose & Concept:
Session Range Projections is a comprehensive trading tool that identifies and analyzes price ranges during user-defined time periods. The indicator visualizes high-probability reversal zones and profit targets by projecting Fibonacci levels from custom session ranges, making it ideal for traders who focus on time-based market structure analysis.
Key Features & Calculations:
1. Custom Time Range Analysis
- Define any time period for range calculation - from traditional sessions (Asian, London, NY) to custom periods like opening ranges, hourly ranges, or 4-hour blocks
- Automatically captures the highest and lowest prices within your specified timeframe
- Supports multiple timezone selections for global market analysis
- Flexible enough for intraday scalping ranges or longer-term swing trading setups
2. Premium & Discount Zones
- Automatically divides the range into premium (above 50%) and discount (below 50%) zones
- Visual differentiation helps identify institutional buying and selling areas
- Color-coded boxes clearly mark these critical price zones
3. Optimal Trade Entry (OTE) Zones
- Highlights the 79-89% retracement zone in premium territory
- Highlights the 11-21% retracement zone in discount territory
- These zones represent high-probability reversal areas based on institutional order flow concepts
4. Fibonacci Projections
- Projects 11 customizable Fibonacci extension levels from the range extremes
- Levels extend both above and below the range for symmetrical analysis
- Each level can be individually toggled and color-customized
- Default levels include common retracement ratios: -0.5, -1.0, -2.0, -2.33, -2.5, -3.0, -4.0, -4.5, -6.0, -7.0, -8.0
How to Use:
Set Your Time Range: Input your desired session start and end times (24-hour format)
Select Timezone: Choose the appropriate timezone for your trading session
Customize Display: Toggle various visual elements based on your preferences
Monitor Price Action: Watch for reactions at projected levels and OTE zones
Set Alerts: Configure sweep alerts for when price breaks above/below range extremes
Input Parameters Explained:
Time Range Settings
Range Start/End Hour & Minute: Define your analysis period
Time Zone: Ensure accurate session timing across different markets
Visual Settings
Range Box: Toggle the premium/discount zone visualization
Horizontal Lines: Customize high/low line appearance
Internal Range Levels: Show/hide equilibrium and OTE zones
Labels: Configure text display for key levels
Fibonacci Projections: Enable/disable extension levels
Display Settings
Historical Ranges: Show up to 10 previous session ranges
Alert Type: Choose between high sweep, low sweep, or both
Trading Applications:
Session-Based Trading: Analyze specific market sessions (Asian, London, New York, opening ranges, hourly ranges)
Reversal Trading: Identify high-probability reversal zones at OTE levels
Breakout/Reversal Trading: Monitor range breaks/reversals with built-in sweep alerts
Risk Management: Use Fibonacci projections as profit targets or rejection areas
Multi-Timeframe Analysis: Apply to any timeframe for various trading styles
Important Notes:
This indicator is for educational purposes only and should not be considered financial advice
Past performance does not guarantee future results
Always use proper risk management when trading
The indicator automatically manages historical data to maintain chart performance

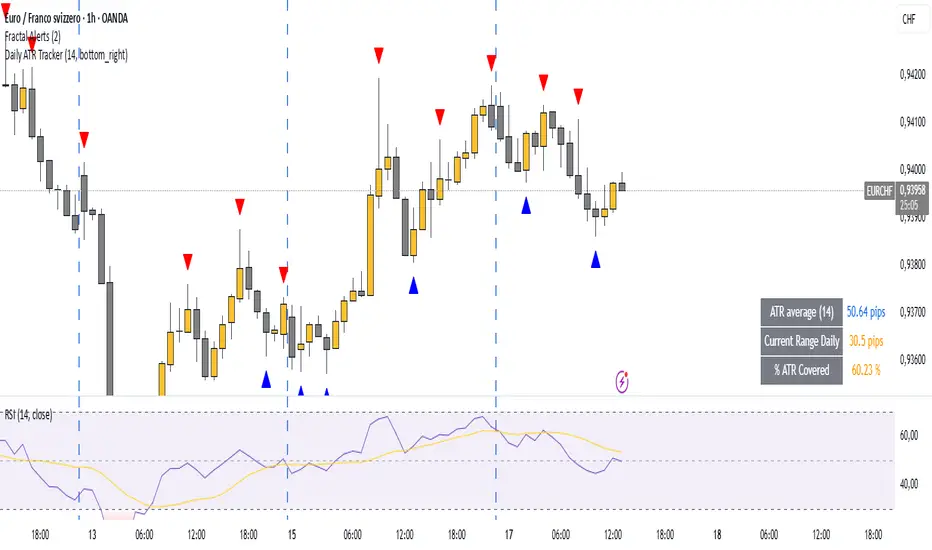
Daily ATR TrackerDaily ATR Tracker
The Daily ATR Tracker is a simple yet powerful tool designed to help traders monitor the daily price movement relative to the average daily range (ATR). This indicator provides an objective view of how much price has moved compared to its recent daily volatility.
🔎 Key Features:
Customizable ATR period (default 14 days)
Live calculation of the current day's price range
ATR value displayed in pips for clear reference
Percentage of ATR covered by the current day's range
Color-coded table for quick visual interpretation:
🟢 Green: less than 60% of ATR covered
🟠 Orange: 60% to 100% of ATR covered
🔴 Red: more than 100% of ATR covered
Alert condition when daily range exceeds 100% of the ATR average
Movable table position to fit your chart layout
🎯 Why use Daily ATR Tracker?
✅ Identify exhaustion zones: When price has already covered a large portion of its typical daily range, the odds of further strong movement may diminish, helping you to manage entries, exits, and risk.
✅ Objective daily bias: Get a quantitative sense of how "stretched" the market is in real time.
✅ Works with any timeframe: While designed for daily ranges, you can monitor intraday movements with this context in mind.
⚠️ Usage Note:
This tool does not provide buy or sell signals by itself. It is designed to complement your existing strategies by offering additional context regarding daily range exhaustion.
Rolling Z-Score Trend [QuantAlgo]🟢 Overview
The Rolling Z-Score Trend measures how far the current price deviates from its rolling mean in terms of standard deviations. It transforms price data into standardized scores to identify overbought and oversold conditions while tracking momentum shifts.
The indicator displays a Z-Score line showing price deviation from statistical norms, with background momentum columns showing the rate of change in these deviations. This helps traders and investors identify mean reversion opportunities and momentum shifts across different asset classes and timeframes.
🟢 How It Works
The indicator uses the Z-Score formula: Z = (X - μ) / σ, where X is the current closing price, μ is the rolling mean, and σ is the rolling standard deviation over a user-defined lookback period. This creates a dynamic baseline that adapts to changing market conditions and standardizes price movements for interpretation across different assets and volatility conditions. The raw Z-Score undergoes 3-period EMA smoothing to reduce noise while maintaining responsiveness to market signals.
Beyond the basic Z-Score calculation, the indicator measures the rate of change in Z-Score values between successive bars, displayed as background momentum columns. This momentum component shows acceleration and deceleration of statistical deviations. All calculations are processed through confirmation filters, displaying signals only on confirmed bars to reduce premature signals based on incomplete price action.
🟢 How to Use
1. Z-Score Interpretation and Threshold Zones
Positive Values (Above Zero) : Price trading above statistical mean, suggesting bullish momentum or potential overbought conditions
Negative Values (Below Zero) : Price trading below statistical mean, suggesting bearish momentum or potential oversold conditions
Zero Line Crosses : Signal transitions between statistical regimes and potential trend changes
Upper Threshold Zone : Area above entry threshold (default 1.5) indicating potential overbought conditions
Lower Threshold Zone : Area below negative entry threshold (default -1.5) indicating potential oversold conditions
Extreme Values (±2.0 or higher) : Statistically significant deviations that may indicate reversal opportunities
2. Momentum Background Analysis and Info Table
Green Columns : Accelerating positive momentum in Z-Score values
Red Columns : Accelerating negative momentum in Z-Score values
Column Height : Magnitude of momentum change between bars
Momentum Divergence : When columns contradict primary Z-Score direction, often signals impending reversals
Info Table : Displays real-time numerical values for both Z-Score and momentum, including trend direction indicators and bar-to-bar change calculations for position management
3. Preconfigured Settings
Default : Balanced performance across multiple timeframes and asset classes for general trading and medium-term position management.
Scalping : Responsive setup for ultra-short-term trading on 1-15 minute charts with frequent signals and increased sensitivity to quick price movements.
Swing Trading : Optimized for multi-day positions with noise filtering, focusing on larger price swings. Most effective on 1-4 hour and daily timeframes.
Trend Following : Maximum smoothing that prioritizes established trends over short-term volatility. Generates fewer signals for daily and weekly charts.

Liquidity Hunter HeatmapLiquidity Hunter (GPS Companion Tool)
Liquidity Hunter is a specialized script designed to help traders visualize and track potential liquidation zones, clusters, and imbalance traps in real-time. It is particularly useful for scalpers and short-term traders who rely on liquidity sweeps, stop hunts, and reversion plays.
This tool does not replicate open-source liquidation trackers. Instead, it uses a proprietary combination of volume surges, candle displacement, VWAP deviation, and high-timeframe wicks to infer areas of trapped traders and display them with clear, color-coded markers.
Key Features:
• Real-Time Liquidation Estimates: Detects where major stop losses (and potential liquidations) may have occurred, based on proprietary volume + price action logic.
• Cluster Strength Bubbles: Visual bubbles (scaled by cluster size) show where liquidations are stacking. Purple for bearish, white for bullish — intensity reflects strength.
• Pre-Liquidation Warning Zones: Highlights areas where price is likely to sweep liquidity before reversing, helping traders avoid chasing moves.
• Dollar-Based Labels (Optional): Displays the estimated value liquidated, helping traders size the significance of a move (e.g., $8.4M).
• Minimal Clutter Mode: Designed for intraday clarity — hides excess lines and uses bubbles, not shapes, for cleaner visualization.

Consolidation Zones[RanaAlgo]Overview
This indicator helps traders identify price consolidation zones (ranges) and potential breakouts in the market. It is useful for spotting periods of low volatility before significant price movements.
How It Works
Detects Consolidation Zones
Uses the ADX (Average Directional Index) to determine when the market is in a consolidation phase .
When ADX is below the threshold , the indicator marks the start of a consolidation zone.
Draws a semi-transparent box around the price range, adjusting its height as new highs/lows form.
Tracks Breakouts
When price breaks above/below the consolidation box, it signals a potential trend continuation.
Displays breakout arrows/labels (configurable shape & style) when price exits the range.
Visual Features
Boxes highlight consolidation areas (customizable color, border, and style).
Labels show real-time status ("CONSOLIDATING" or "TRENDING").
Breakout signals appear as arrows or shapes (up/down).
Usefulness in Trading
Range Trading: Helps traders identify sideways markets for buying low and selling high.
Breakout Trading: Signals potential trend entries when price exits consolidation.
Trend Confirmation: Low ADX + consolidation box = weak trend; breakout = possible trend start.
Example: If price stays in a blue box (consolidation) and then breaks above with an arrow, it suggests a bullish move.

Adaptive Multi-MA OptimizerAdaptive Multi-MA Optimizer
This indicator provides a powerful, customizable solution for traders seeking dynamically optimized moving averages with precision and control. It integrates multiple custom-built moving average types, applies real-time volatility-based optimization, and includes an optional composite smoothing engine.
🧠 Key Features
Dynamic Optimization:
Automatically selects the optimal lookback length based on market volatility stability using a custom standard deviation differential model.
Multiple Custom MA Types:
Includes fully custom implementations of:
SMA (Simple Moving Average)
EMA (Exponential Moving Average)
WMA (Weighted Moving Average)
VWMA (Volume Weighted MA)
DEMA (Double EMA)
TEMA (Triple EMA)
Hull MA
ALMA (Arnaud Legoux MA)
Composite MA Option:
A unique "Composite" mode blends all supported MAs into a single average, then applies optional smoothing for enhanced signal clarity.
Dynamic Smoothing:
The composite mode supports volatility-adjusted smoothing (based on optimized lookback), making it adaptable to different market regimes.
Fully Custom Logic:
No built-in MA functions are used — every moving average is hand-coded for transparency and educational value.
⚙️ How It Works
Optimization:
The script evaluates a range of lengths (minLen to maxLen) using the standard deviation of price returns. It selects the length with the most stable recent volatility profile.
Calculation:
The selected MA type is calculated using that optimized length. If "Composite" is chosen, all MA types are averaged and smoothed dynamically.
Visualization:
The adaptive MA is plotted on the chart, changing color based on its position relative to price.
📌 Use Cases
Trend-following strategies that adapt to different market conditions.
Traders wanting a high-fidelity composite of multiple MAs.
Analysts interested in visualizing market smoothness without lag-heavy signals.
Coders looking to learn how to build custom indicators from scratch.
🧪 Inputs
MA Type: Choose from 8 MA types or a blended Composite.
Lookback Range: Control min/max and step size for optimization.
Source: Choose any price series (e.g., close, hl2).
⚠️ Disclaimer
This indicator is for educational and informational purposes only and does not constitute financial advice, trading advice, or investment recommendations. Use of this script is at your own risk. Past performance does not guarantee future results. Always perform your own analysis and consult with a qualified financial advisor before making trading decisions.

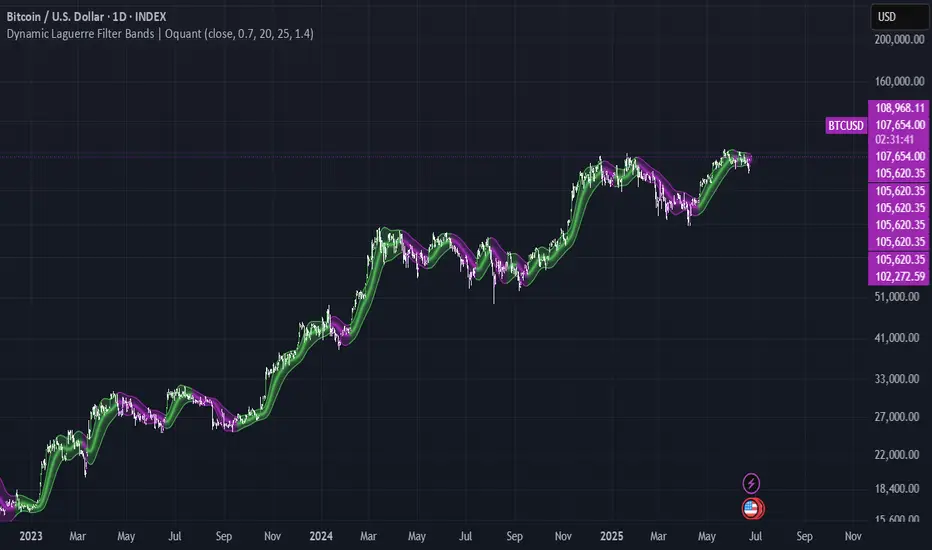
Dynamic Laguerre Filter Bands | OttoThis indicator combines trend-following and volatility analysis by enhancing the traditional Laguerre filter with a dynamic, volatility-adjusted band system. Instead of using fixed thresholds, the bands adapt in real-time to changing market conditions by applying smoothed standard deviation calculations. This design keeps the indicator responsive to significant price movements while effectively filtering out short-term market noise, resulting in more accurate trend identification and breakout signals.
Core Concept
The indicator is built around the following key components:
Laguerre Filter:
The Laguerre filter is designed to smooth out price data by reducing market noise while still being quick enough to detect real changes in price direction. Its goal is to create a clear, smooth trend line that helps traders/investors focus on the overall market trend without getting distracted by small, random price swings.
It uses a parameter called gamma to control how it balances smoothness and responsiveness:
A lower gamma gives more weight to recent price data, making the filter react faster to new price changes. This means the trend line is more sensitive but may also be less smooth and more prone to small fluctuations.
A higher gamma gives more weight to past price data, making the filter smoother and less sensitive to quick changes. This helps reduce noise and produces a steadier trend line, but it also introduces more lag, meaning the filter reacts slower to new price moves.
By adjusting gamma, the Laguerre filter lets you choose the balance between following price changes quickly and having a stable, noise-free trend signal.
Standard Deviation:
shows how much price varies from the mean. In this indicator, it’s used to measure market volatility.
Volatility Bands: The upper and lower bands are based on an EMA-smoothed standard deviation of price. The EMA reduces sudden jumps in volatility, creating smoother and more stable bands that still respond to changing market conditions. These bands are plotted around the Laguerre filter line, expanding and contracting in a controlled way to stay aligned with real market movement while avoiding short-term noise.
Signal Logic:
A long signal is triggered when the close price crosses above the upper band.
A short signal occurs when the close price falls below the lower band.
⚙️ Inputs
Source: Price source used in calculations
Gamma: Adjusts how much the Laguerre filter responds to price changes. Lower gamma values make the filter react more to recent prices, while higher values give more influence to older data, making the line smoother but slower to respond.
Volatility Length: Period used to calculate standard deviation
Volatility Smoothing Length: EMA smoothing length for standard deviation
Multiplier: Scales the width of the bands based on volatility
📈 Visual Output
Laguerre Filter Line: Plots the laguerre filter line, colored dynamically based on signal direction (green for bullish, purple for bearish)
Upper & Lower Bands: Volatility-based bands that adjust with market conditions. (green for bullish, purple for bearish)
Glow Effect: Optional glow layer to enhance visibility of the laguerre filter trend line (green for bullish, purple for bearish)
Bar Coloring: Candlesticks and bar colors reflect the active signal state for fast visual interpretation (green for bullish, purple for bearish)
How to Use
Apply the indicator to your chart and monitor for signal events:
Long Signal: When price closes above the upper band
Short Signal: When price closes below the lower band
🔔 Alerts
This indicator supports optional alert conditions you can enable for:
Long Signal: Close price crossing above the upper band
Short Signal: Close price crossing below the lower band
⚠️ Disclaimer:
This indicator is intended for educational and informational purposes only. Trading/investing involves risk, and past performance does not guarantee future results. Always test and evaluate indicators/strategies before applying them in live markets. Use at your own risk.
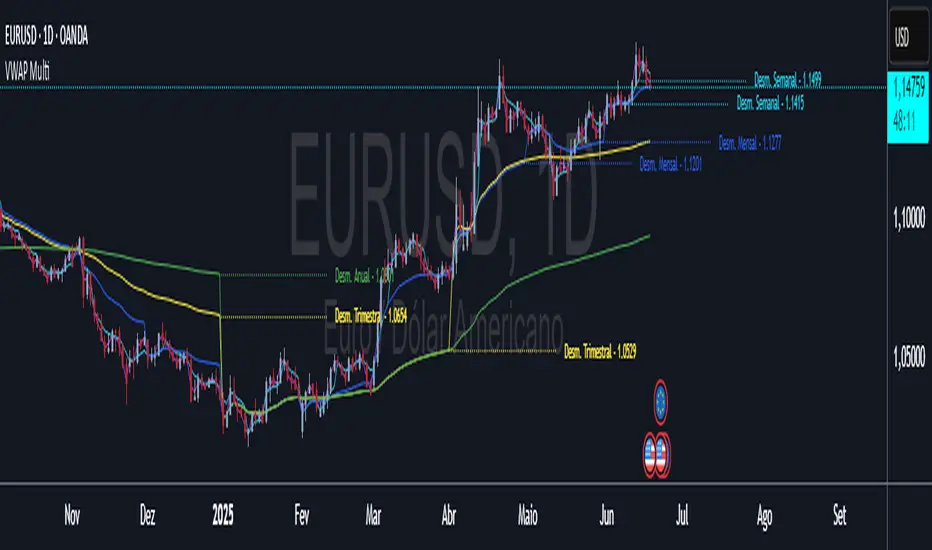
VWAP Multi-Timeframe VWAP Multi-Timeframe - Complete Professional Indicator
🚀 WHAT IS IT?
The VWAP Multi-Timeframe is an advanced indicator that combines 5 different VWAP periods in a single tool, providing a complete view of market fair value levels across multiple time scales.
⭐ KEY FEATURES
📊 5 Configurable VWAPs:
🟡 Daily VWAP - Ideal for day trading and intraday operations
🟠 Weekly VWAP - Perfect for swing trading
🔵 Monthly VWAP - Excellent for medium-term analysis
🔴 Quarterly VWAP - Essential for quarterly strategies
🟢 Yearly VWAP - Fundamental for long-term investments
🎯 Multiple Price Sources:
Choose the source that best fits your strategy:
Close - Closing price (most common)
OHLC4 - Complete average (smoother)
HLC3 - Typical price (default)
HL2 - Period midpoint
Open/High/Low - Specific prices
💡 HOW TO USE
For Day Traders:
Use Daily VWAP as main fair value reference
Prices above = buying pressure / Prices below = selling pressure
For Swing Traders:
Combine Weekly and Monthly VWAP to identify trends
Look for confluences between different timeframes
For Investors:
Quarterly and Yearly VWAP show long-term value levels
Excellent for identifying entry points in investments
🔧 TECHNICAL FEATURES
✅ Pine Script v6 - Latest and optimized version
✅ Clean Interface - User-friendly design
Adaptive Normalized Global Liquidity OscillatorAdaptive Normalized Global Liquidity Oscillator
A dynamic, non-repainting oscillator built on real central bank balance sheet data. This tool visualizes global liquidity shifts by aggregating monetary asset flows from the world’s most influential central banks.
🔍 What This Script Does:
Aggregates Global Liquidity:
Includes Federal Reserve (FED) assets and subtracts liabilities like the Treasury General Account (TGA) and Reverse Repo Facility (RRP), combined with asset positions from the ECB, BOJ, PBC, BOE, and over 10 other central banks. All data is normalized into USD using FX rates.
Adaptive Normalization:
Optimizes the lookback period dynamically based on rate-of-change stability—no fixed lengths, enabling adaptation across macro conditions.
Self-Optimizing Weighting:
Applies inverse standard deviation to balance raw liquidity, smoothed momentum (HMA), and standardized deviation from the mean.
Percentile-Ranked Highlights:
Liquidity readings are ranked relative to history—extremes are visually emphasized using gradient color and adaptive transparency.
Non-Repainting Design:
Data is anchored with bar index awareness and offset techniques, ensuring no forward-looking bias. What you see is what was known at that time.
⚠️ Important Interpretation Note:
This is not a zero-centered oscillator like RSI or MACD. The signal line does not represent neutrality at zero.
Instead, a dynamic baseline is calculated using a rolling mean of scaled liquidity.
0 is irrelevant on its own—true directional signals come from crosses above or below this adaptive baseline.
Even negative values may signal strength if they are rising above the moving average of past liquidity conditions.
✅ What to Watch For:
Crossover Above Dynamic Baseline:
Indicates liquidity is expanding relative to recent conditions—supports a risk-on interpretation.
Crossover Below Dynamic Baseline:
Suggests deteriorating liquidity conditions—may align with risk-off shifts.
Percentile Extremes:
Readings near the top or bottom historical percentiles can act as contrarian or confirmation signals, depending on momentum.
⚙️ How It Works:
Bounded Normalization:
The final oscillator is passed through a tanh function, keeping values within and reducing distortion.
Adaptive Transparency:
The strength of deviations dynamically adjusts plot intensity—visually highlighting stronger liquidity shifts.
Fully Customizable:
Toggle which banks are included, adjust dynamic optimization ranges, and control visual display options for plot and background layers.
🧠 How to Use:
Trend Confirmation:
Sustained rises in the oscillator above baseline suggest underlying monetary support for asset prices.
Macro Turning Points:
Reversals or divergences, especially near OB/OS zones, can foreshadow broader risk regime changes.
Visual Context:
Use the dynamic baseline to see if liquidity is supportive or suppressive relative to its own adaptive history.
📌 Disclaimer:
This indicator is for educational and informational purposes only. It does not constitute financial advice. Past performance is not indicative of future results. Always consult a qualified financial advisor before making trading or investment decisions.

Adaptive RSI Oscillator📌 Adaptive RSI Oscillator
This indicator transforms the classic RSI into a fully adaptive, self-optimizing oscillator — normalized between -1 and 1, dynamically smoothed, and enhanced with divergence detection.
🔧 Key Features
Self-Optimizing RSI: Automatically selects the optimal RSI lookback length based on return stability (no hardcoded periods).
Dynamic Smoothing: Adapts to market conditions using a fraction of the optimized length.
Normalized Output : Converts traditional RSI to a consistent scale across all assets and timeframes.
Divergence Detection: Compares RSI behavior vs. price percentile ranks and scales the signal accordingly.
Gradient Visualization: Color-coded background and plot lines reflect the strength and direction of the signal with soft transitions.
Neutral Zone Adaptation: Dynamically widens or narrows the zone of inaction based on volatility, reducing noise.
🎯 Use Cases
Identify extreme momentum zones without relying on fixed 70/30 RSI levels
Detect divergences early with adaptive filtering
Highlight potential exhaustion or continuation
⚠️ Disclaimer: This indicator is for informational and educational purposes only. It does not constitute financial advice or a recommendation to buy or sell any security. Always conduct your own research and consult a licensed financial advisor before making investment decisions. Use at your own risk.

X-Day Capital Efficiency ScoreThis indicator helps identify the Most Profitable Movers for Your fixed Capital (ie, which assets offer the best average intraday profit potential for a fixed capital).
Unlike traditional volatility indicators (like ATR or % change), this script calculates how much real dollar profit you could have made each day over a custom lookback period — assuming you deployed your full capital into that ticker daily.
How it works:
Calculates the daily intraday range (high − low)
Filters for clean candles (where body > 60% of the candle range)
Assumes you invested the full amount of capital ($100K set as default) on each valid day
Computes an average daily profit score based on price action over the selected period (default set to 20 days)
Plots the score in dollars — higher = more efficient use of capital
Why It’s Useful:
Compare tickers based on real dollar return potential — not just % volatility
Spot low-priced, high-volatility stocks that are better suited for intraday or momentum trading
Inputs:
Capital ($): Amount you're hypothetically deploying (e.g., 100,000)
Look Back Period: Number of past days to average over (e.g., 20)

Haven Average Daily RangeOverview
This indicator is an enhanced version of the traditional ADR tool that adapts to intraday price movements. Unlike static ADR levels, this indicator dynamically adjusts its range boundaries based on real-time price action while maintaining the original ADR calculation framework.
Key Features
ADR calculation based on multiple periods (5, 10, and 20 days)
ADR levels displayed with automatic style changes upon range reach
Customizable display settings (color, line style)
Price labels for better visualization
The indicator helps traders assess the instrument's volatility, identify potential reversal zones, and plan daily trading targets.
Suitable for all timeframes up to D1 and any trading instrument.
How It Works
Session Start (UTC+0): Calculates ADR based on historical data and sets initial High/Low levels
Dynamic Phase: Monitors price action and adjusts the opposite boundary (ADR Low or High) when new extremes are reached.
When price creates new Day high price above the opening price, the ADR Low level moves upward proportionally.
When price creates new Day low price below the opening price, the ADR High level moves downward proportionally.
Completion Phase: Stops adjustments and highlights breach when price reaches either boundary
Trading Application
Entry and Exit Signals
The ADR boundaries serve as key decision points for trade execution. When price approaches the upper ADR boundary, it often signals a potential selling zone, particularly when confluence exists with other overbought indicators such as RSI divergence or resistance levels. Conversely, price reaching the lower ADR boundary frequently indicates potential buying opportunities, especially when supported by oversold conditions or support confluences.
Trend Continuation Assessment
One of the most valuable applications is gauging the probability of continued directional movement. When the current session's price action has not yet reached either ADR boundary, statistical probability favors trend continuation in the established direction. This information helps traders stay with profitable positions longer rather than exiting prematurely.
Reversal and Consolidation Zones
The visual color change to orange when ADR boundaries are reached provides immediate feedback that the normal daily range has been exhausted. At this point, the probability of trend reversal or sideways consolidation increases significantly. This signal helps traders prepare for potential position adjustments or new counter-trend opportunities.

[Smith] VWAP Deviation + VWAP Deviation +
Short Description:
Advanced VWAP indicator with deviation bands, smart signal filtering, and session-based performance tracking. Features log-space scaling, RSI confirmation, volume filters, and market regime detection.
Full Description:
The VWAP Deviation + is a comprehensive trading indicator that combines Volume Weighted Average Price (VWAP) analysis with advanced signal filtering to identify high-probability trade opportunities. This indicator goes beyond basic VWAP by incorporating multiple confirmation layers and intelligent market analysis.
🎯 Key Features
Core VWAP Analysis:
- Custom volume-weighted mean calculation with deviation bands (2σ and 3σ)
- Optional log-space scaling for proportional price movements
- Real-time VWAP line with customizable visibility
Smart Signal Detection:
- RSI confirmation for all trade signals
- Volume filter requiring above-average trading activity
- Market regime detection (trending vs ranging markets)
- Optional RSI divergence analysis
Advanced Filtering:
- Multi-condition signal validation
- Session-based performance tracking (Asian, London, NY)
- Real-time win rate calculation
- Strong vs regular signal classification
Visual Features:
- Clean, professional interface with customizable colors
- Optional signal shapes and annotations
- Performance statistics table
- Filled deviation bands for easy visualization
📊 How It Works
The indicator identifies trade opportunities when:
1. Price touches VWAP deviation bands (2σ or 3σ)
2. RSI confirms oversold/overbought conditions
3. Volume exceeds the specified threshold
4. Market regime conditions are favorable
Signal Types:
- LONG : Price at lower bands + RSI oversold + volume confirmation
- SHORT : Price at upper bands + RSI overbought + volume confirmation
- STRONG : Same conditions but at 3σ bands for higher conviction trades
⚙️ Customization Options
Core Settings:
- VWAP length and source selection
- Adjustable deviation multipliers
- Log-space scaling toggle
Signal Filters:
- RSI length and threshold levels
- Volume filter with customizable multiplier
- Market type filtering options
Advanced Features:
- Session statistics tracking
- RSI divergence detection
- Market regime analysis
Visual Controls:
- Show/hide individual components
- Custom color schemes
- Signal display toggles
🔔 Alert System
Built-in alerts for:
- Long and short trade opportunities
- Strong signal confirmations
- RSI divergence signals
💡 Best Practices
- Use higher timeframes (15m+) for more reliable signals
- Combine with additional confirmation indicators
- Pay attention to session statistics for timing optimization
- Monitor market regime indicators for context
This indicator is suitable for day traders, swing traders, and anyone looking to improve their VWAP-based trading strategies with advanced filtering and market analysis.

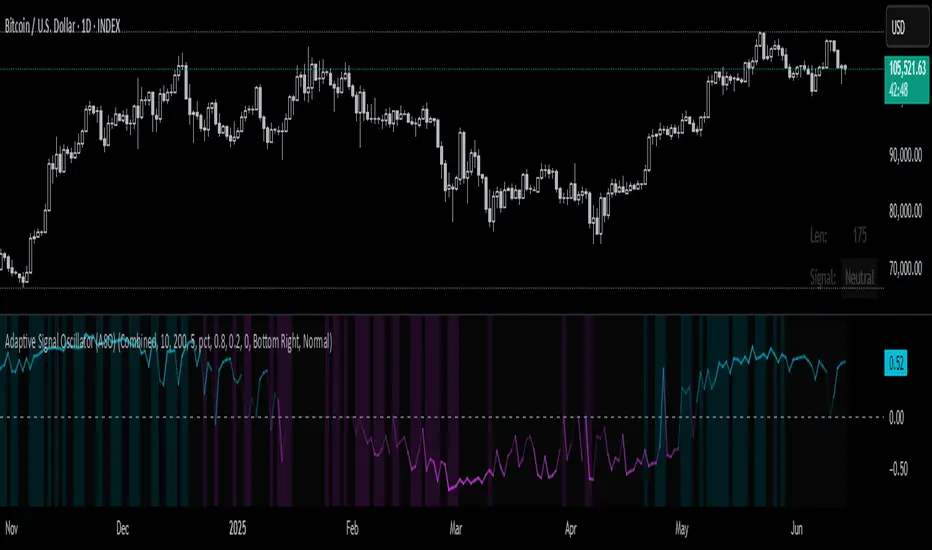
Adaptive Signal Oscillator (ASO)📘 Adaptive Signal Oscillator (ASO)
A fully dynamic, self-calibrating oscillator that adapts to any asset or timeframe by optimizing for real-time signal stability and volatility structure — without relying on static parameters or hardcoded thresholds.
🔍 Overview
The Adaptive Signal Oscillator (ASO) is a next-generation technical analysis tool designed to provide context-aware long/short signals across crypto, equities, or forex markets. Unlike traditional oscillators (RSI, Stochastics, MACD), ASO requires no manual tuning of lookback periods or overbought/oversold zones — it self-optimizes based on current market behavior.
🧠 How It Works
✅ 1. Dynamic Lookback Optimization
ASO evaluates a range of lookback lengths between user-defined minLen and maxLen. For each length, it calculates the standard deviation of returns and finds the one with the least volatility change (i.e., the most stable structure). This length is dynamically assigned as bestLen, recalculated on every bar.
✅ 2. Multi-Layer Signal Composition
Four independent signal layers are computed using bestLen:
RSI Layer: Measures relative price strength via a custom dynamic RSI.
Z-Score Layer: Standardized deviation of price from its mean.
Volatility Layer: Standard deviation of log or percent returns.
Price Position Layer: Current price percentile within the lookback window.
Each of these layers is transformed into a percentile score scaled to the range .
✅ 3. Volatility-Based Weighting
The standard deviation (volatility) of each signal layer is computed. Less volatile layers are weighted more heavily, ensuring the final composite signal prioritizes stable, consistent inputs.
Weights are normalized and combined to form a composite score, representing a dynamically blended, noise-weighted signal across the four layers.
✅ 4. Optional Adaptive Smoothing
A boolean toggle lets users apply smoothing to the final score. The smoothing window scales proportionally to bestLen, preserving adaptiveness even during trend transitions.
✅ 5. Percentile-Based Thresholding
Rather than using arbitrary fixed thresholds, ASO converts the composite score into a ranked percentile. Long/short signals are then generated based on user-defined percentile bands, adapting naturally to each asset’s behavior.
📈 Interpreting ASO
Score > Threshold → Strong long signal (highlighted in aqua).
Score < Threshold → Strong short signal (highlighted in fuchsia).
Crossing h_thresh (e.g., 0) → Neutral-to-bias change; useful for early trend cues.
The background and label update in real time to reflect the current regime and bestLen.
⚙️ Inputs
minLen, maxLen, step: Define the search range for optimal lookback length.
retMethod: Choose between log or percent return calculations.
threshHigh, threshLow: Define signal zones using percentiles.
smooth: Enable dynamic score smoothing.
h_thresh: Midline crossover zone for directional context.
⚠️ Disclaimer
This tool is designed for exploratory and educational purposes only. It does not offer financial advice or trading recommendations. Past performance is not indicative of future results.
Always consult a licensed financial advisor before making investment decisions.
OBV with MA & Bollinger Bands by Marius1032OBV with MA & Bollinger Bands by Marius1032
This script adds customizable moving averages and Bollinger Bands to the classic OBV (On Balance Volume) indicator. It helps identify volume-driven momentum and trend strength.
Features:
OBV-based trend tracking
Optional smoothing: SMA, EMA, RMA, WMA, VWMA
Optional Bollinger Bands with SMA
Potential Combinations and Trading Strategies:
Breakouts: Look for price breakouts from the Bollinger Bands, and confirm with a rising OBV for an uptrend or falling OBV for a downtrend.
Trend Reversals: When the price touches a Bollinger Band, examine the OBV for divergence. A bullish divergence (price lower low, OBV higher low) near the lower band could signal a reversal.
Volume Confirmation: Use OBV to confirm the strength of the trend indicated by Bollinger Bands. For example, if the BBs indicate an uptrend and OBV is also rising, it reinforces the bullish signal.
1. On-Balance Volume (OBV):
Purpose: OBV is a momentum indicator that uses volume flow to predict price movements.
Calculation: Volume is added on up days and subtracted on down days.
Interpretation: Rising OBV suggests potential upward price movement. Falling OBV suggests potential lower prices.
Divergence: Divergence between OBV and price can signal potential trend reversals.
2. Moving Average (MA):
Purpose: Moving Averages smooth price fluctuations and help identify trends.
Combination with OBV: Pairing OBV with MAs helps confirm trends and identify potential reversals. A crossover of the OBV line and its MA can signal a trend reversal or continuation.
3. Bollinger Bands (BB):
Purpose: BBs measure market volatility and help identify potential breakouts and trend reversals.
Structure: They consist of a moving average (typically 20-period) and two standard deviation bands.
Combination with OBV: Combining BBs with OBV allows for a multifaceted approach to market analysis. For example, a stock hitting the lower BB with a rising OBV could indicate accumulation and a potential upward reversal.
Created by: Marius1032

Flux Capacitor (FC)# Flux Capacitor
**A volume-weighted, outlier-resistant momentum oscillator designed to expose hidden directional pressure from institutional participants.**
---
### Why "Flux Capacitor"?
The name pays homage to the fictional energy core in *Back to the Future* — an invisible engine that powers movement. Similarly, this indicator detects whether price movement is being powered by real market participation (volume) or if it's coasting without conviction.
---
### Methodology
The Flux Capacitor fuses three statistical layers:
- **Normalized Momentum**: `(Close – Open) / ATR`
Controls for raw price size and volatility.
- **Volume Scaling**:
Amplifies the effect of price moves that occur with elevated volume.
- **Robust Normalization**:
- *Winsorization* caps outlier spikes.
- *MAD-Z scoring* normalizes the signal across assets (crypto, futures, stocks).
- This produces consistent scaling across timeframes and symbols.
The result is a smooth oscillator that reliably indicates **liquidity-backed momentum** — not just price movement.
---
### Signal Events
- **Divergence (D)**: Price makes higher highs or lower lows, but Flux does not.
- **Absorption (A)**: Candle shows high volume and small body, while Flux opposes the candle direction — indicates smart money stepping in.
- **Compression (◆)**: High volume with low momentum — potential breakout zone.
- **Zero-Cross**: Indicates directional regime flip.
- **Flux Acceleration**: Histogram shows pressure rate of change.
- **Regime Background**: Color fades with weakening trend conviction.
All signals are color-coded and visually compact for easy pattern recognition.
---
### Interpreting Divergence & Absorption Correctly
Signal strength improves significantly when it appears **in the correct zone**:
#### Divergence:
| Signal | Zone | Meaning | Strength |
|--------|------------|------------------------------------------|--------------|
| Green D | Below 0 | Bullish reversal forming in weakness | **Strong** |
| Green D | Above 0 | Bullish, but less convincing | Moderate |
| Red D | Above 0 | Bearish reversal forming in strength | **Strong** |
| Red D | Below 0 | Bearish continuation — low warning value | Weak |
#### Absorption:
| Signal | Zone | Meaning | Strength |
|--------|------------|-----------------------------------------|--------------|
| Green A | Below 0 | Buyers absorbing panic-selling | **Strong** |
| Green A | Above 0 | Support continuation | Moderate |
| Red A | Above 0 | Sellers absorbing FOMO buying | **Strong** |
| Red A | Below 0 | Trend continuation — not actionable | Weak |
Look for **absorption or divergence signals in “enemy territory”** for the most actionable entries.
---
### Reducing Visual Footprint
If your chart shows a long line of numbers across the top of the Flux Capacitor pane (e.g. "FC 14 20 9 ... Bottom Right"), it’s due to TradingView’s *status line input display*.
**To fix this**:
Right-click the indicator pane → **Settings** → **Status Line** tab → uncheck “Show Indicator Arguments”.
This frees up vertical space so top-edge signals (like red `D` or yellow `◆`) remain visible and unobstructed.
---
### Features
- Original MAD-Z based momentum design
- True volume-based divergence and absorption logic
- Built-in alerts for all signal types
- Works across timeframes (1-min to weekly)
- Minimalist, responsive layout
- 25+ customizable parameters
- No future leaks, no repainting
---
### Usage Scenarios
- **Trend confirmation**: Flux > 0 confirms bullish trend strength
- **Reversal detection**: Divergence or absorption in opposite territory = high-probability reversal
- **Breakout anticipation**: Compression signal inside range often precedes directional move
- **Momentum shifts**: Watch for zero-crosses + flux acceleration spikes
---
### ⚠ Visual Note for BTC, ETH, Crude Oil & Futures
These high-priced or rapidly accelerating instruments can visually compress any linear oscillator. You may notice the Flux Capacitor’s line appears "flat" or muted on these assets — especially over long lookbacks.
> **This does not affect signal validity.** Divergence, absorption, and compression triggers still fire based on underlying logic — only the line’s amplitude appears reduced due to scaling constraints.
---
### Disclaimer
This indicator is for educational purposes only. It is not trading advice. Past results do not guarantee future performance. Use in combination with your own risk management and analysis.

ATR-Multiple from 50SMAThis indicator provides a nuanced view of price extension by calculating the distance between the current price and its 50-period Simple Moving Average. This distance is not measured in simple percentage terms but is quantified in multiples of the Average True Range (ATR), offering a volatility-adjusted perspective on how far an asset has moved from its mean.
The primary goal is to help traders identify potentially overextended conditions, which can often precede price consolidation or reversals. As a general guideline, when an asset's price stretches to multiples of 7 ATRs or more above its 50-day SMA, it often enters a zone where significant profit-taking may occur. By visualizing this extension, the indicator can serve as a powerful tool for gauging when to consider taking profits on existing long positions. Furthermore, it can act as a cautionary signal, helping traders avoid initiating new long positions in assets that are already significantly stretched and may be poised for a pullback.
Features
Volatility-Adjusted Extension
Measures the distance from the 50 SMA in terms of ATR multiples, providing a more standardized way to compare extension across different assets and time periods.
Daily Timeframe Consistency
By default, the indicator uses the daily SMA and ATR for its calculations, regardless of the chart's current timeframe. This ensures a consistent and meaningful measure of extension rooted in the daily trend.
Histogram Visualization
Displays the result as a clear histogram in a separate pane, making it easy to track the extension level over time and identify historical extremes.
Dynamic Color-Coding
The histogram bars are color-coded to visually highlight different levels of extension. The colors shift as the price moves further from the mean, providing an intuitive at-a-glance reading.
Key Threshold Markers
Includes pre-set horizontal lines at the 7 and 10 ATR multiples to clearly mark the zones of potential profit-taking and extreme extension, respectively.
Built-in Alerts
Comes with configurable alert conditions that can notify you when the price reaches the "profit-taking" threshold (7 ATRs) or the "extreme extension" threshold (10 ATRs).
Customization Options
MA & ATR Periods
You can adjust the length for the Simple Moving Average (default 50) and the Average True Range (default 14) to suit your specific analytical needs.
Timeframe Source
A toggle allows you to switch between always calculating using daily data (the default and recommended setting) or using the data from the current chart's timeframe.
Color Display Style
You can choose between a smooth color gradient that transitions elegantly with the extension level or a distinct, step-based color display for a clearer visual separation of the defined zones.
Full Color Scheme Control
Every visual element is fully customizable. You can change the colors for the regular extension, the "get ready," "profit-taking," and "extreme" levels, as well as the horizontal reference lines.

HOG Liquidity HunterHOG Liquidity Hunter – Pivot‑Based Liquidity Zones
📌 Overview
Plots dynamic support and resistance zones on swing pivots with an ATR‑based buffer. Anchored only when pivots are confirmed, the zones stay close to current price levels—ideal for spotting liquidity runs or traps.
🔧 How It Works
Detects swing highs and lows using ta.pivothigh() / ta.pivotlow() with a user‑defined lookback.
After a pivot is confirmed, calculates BSL/SSL zone = pivot ± (ATR * margin).
Zones update only on confirmed pivots—no repainting on open bars.
⚙️ Inputs
Lookback: bars to confirm pivots (e.g. 10–20).
ATR Margin Multiplier: buffer width (e.g. 1.25).
✅ Benefits
Structure‑focused: Zones align with real swing points.
Responsive yet stable: Tight ATR margin keeps zones precise, only updating on valid pivots.
Clean visuals: Two uncluttered zones—easy to interpret.
🛠 How to Use
Detect near‑zone bounce entries or exits on 4H/1D charts.
Combine with trend or volume indicators for stronger setups.
Use zones to identify potential stop‑run, liquidity re‑tests, or range turns.
⚠️ Notes & Disclaimers
Zones base off historical pivots; may lag until confirmed.
No future-looking data—relying entirely on closing bar confirmation.
Use alongside a complete trading framework; this is not a standalone signal.

Volatility Quality [Alpha Extract]The Alpha-Extract Volatility Quality (AVQ) Indicator provides traders with deep insights into market volatility by measuring the directional strength of price movements. This sophisticated momentum-based tool helps identify overbought and oversold conditions, offering actionable buy and sell signals based on volatility trends and standard deviation bands.
🔶 CALCULATION
The indicator processes volatility quality data through a series of analytical steps:
Bar Range Calculation: Measures true range (TR) to capture price volatility.
Directional Weighting: Applies directional bias (positive for bullish candles, negative for bearish) to the true range.
VQI Computation: Uses an exponential moving average (EMA) of weighted volatility to derive the Volatility Quality Index (VQI).
vqiRaw = ta.ema(weightedVol, vqiLen)
Smoothing: Applies an additional EMA to smooth the VQI for clearer signals.
Normalization: Optionally normalizes VQI to a -100/+100 scale based on historical highs and lows.
Standard Deviation Bands: Calculates three upper and lower bands using standard deviation multipliers for volatility thresholds.
vqiStdev = ta.stdev(vqiSmoothed, vqiLen)
upperBand1 = vqiSmoothed + (vqiStdev * stdevMultiplier1)
upperBand2 = vqiSmoothed + (vqiStdev * stdevMultiplier2)
upperBand3 = vqiSmoothed + (vqiStdev * stdevMultiplier3)
lowerBand1 = vqiSmoothed - (vqiStdev * stdevMultiplier1)
lowerBand2 = vqiSmoothed - (vqiStdev * stdevMultiplier2)
lowerBand3 = vqiSmoothed - (vqiStdev * stdevMultiplier3)
Signal Generation: Produces overbought/oversold signals when VQI reaches extreme levels (±200 in normalized mode).
Formula:
Bar Range = True Range (TR)
Weighted Volatility = Bar Range × (Close > Open ? 1 : Close < Open ? -1 : 0)
VQI Raw = EMA(Weighted Volatility, VQI Length)
VQI Smoothed = EMA(VQI Raw, Smoothing Length)
VQI Normalized = ((VQI Smoothed - Lowest VQI) / (Highest VQI - Lowest VQI) - 0.5) × 200
Upper Band N = VQI Smoothed + (StdDev(VQI Smoothed, VQI Length) × Multiplier N)
Lower Band N = VQI Smoothed - (StdDev(VQI Smoothed, VQI Length) × Multiplier N)
🔶 DETAILS
Visual Features:
VQI Plot: Displays VQI as a line or histogram (lime for positive, red for negative).
Standard Deviation Bands: Plots three upper and lower bands (teal for upper, grayscale for lower) to indicate volatility thresholds.
Reference Levels: Horizontal lines at 0 (neutral), +100, and -100 (in normalized mode) for context.
Zone Highlighting: Overbought (⋎ above bars) and oversold (⋏ below bars) signals for extreme VQI levels (±200 in normalized mode).
Candle Coloring: Optional candle overlay colored by VQI direction (lime for positive, red for negative).
Interpretation:
VQI ≥ 200 (Normalized): Overbought condition, strong sell signal.
VQI 100–200: High volatility, potential selling opportunity.
VQI 0–100: Neutral bullish momentum.
VQI 0 to -100: Neutral bearish momentum.
VQI -100 to -200: High volatility, strong bearish momentum.
VQI ≤ -200 (Normalized): Oversold condition, strong buy signal.
🔶 EXAMPLES
Overbought Signal Detection: When VQI exceeds 200 (normalized), the indicator flags potential market tops with a red ⋎ symbol.
Example: During strong uptrends, VQI reaching 200 has historically preceded corrections, allowing traders to secure profits.
Oversold Signal Detection: When VQI falls below -200 (normalized), a lime ⋏ symbol highlights potential buying opportunities.
Example: In bearish markets, VQI dropping below -200 has marked reversal points for profitable long entries.
Volatility Trend Tracking: The VQI plot and bands help traders visualize shifts in market momentum.
Example: A rising VQI crossing above zero with widening bands indicates strengthening bullish momentum, guiding traders to hold or enter long positions.
Dynamic Support/Resistance: Standard deviation bands act as dynamic volatility thresholds during price movements.
Example: Price reversals often occur near the third standard deviation bands, providing reliable entry/exit points during volatile periods.
🔶 SETTINGS
Customization Options:
VQI Length: Adjust the EMA period for VQI calculation (default: 14, range: 1–50).
Smoothing Length: Set the EMA period for smoothing (default: 5, range: 1–50).
Standard Deviation Multipliers: Customize multipliers for bands (defaults: 1.0, 2.0, 3.0).
Normalization: Toggle normalization to -100/+100 scale and adjust lookback period (default: 200, min: 50).
Display Style: Switch between line or histogram plot for VQI.
Candle Overlay: Enable/disable VQI-colored candles (lime for positive, red for negative).
The Alpha-Extract Volatility Quality Indicator empowers traders with a robust tool to navigate market volatility. By combining directional price range analysis with smoothed volatility metrics, it identifies overbought and oversold conditions, offering clear buy and sell signals. The customizable standard deviation bands and optional normalization provide precise context for market conditions, enabling traders to make informed decisions across various market cycles.

Fibonacci Entry Bands [AlgoAlpha]OVERVIEW
This script plots Fibonacci Entry Bands, a trend-following and mean-reversion hybrid system built around dynamic volatility-adjusted bands scaled using key Fibonacci levels. It calculates a smoothed basis line and overlays multiple bands at fixed Fibonacci multipliers of either ATR or standard deviation. Depending on the trend direction, specific upper or lower bands become active, offering a clear framework for entry timing, trend identification, and profit-taking zones.
CONCEPTS
The core idea is to use Fibonacci levels—0.618, 1.0, 1.618, and 2.618—as multipliers on a volatility measure to form layered price bands around a trend-following moving average. Trends are defined by whether the basis is rising or falling. The trend determines which side of the bands is emphasized: upper bands for downtrends, lower bands for uptrends. This approach captures both directional bias and extreme price extensions. Take-profit logic is built in via crossovers relative to the outermost bands, scaled by user-selected aggressiveness.
FEATURES
Basis Line – A double EMA smoothing of the source defines trend direction and acts as the central mean.
Volatility Bands – Four levels per side (based on selected ATR or stdev) mark the Fibonacci bands. These become visible only when trend direction matches the side (e.g., only lower bands plot in an uptrend).
Bar Coloring – Bars are shaded with adjustable transparency depending on distance from the basis, with color intensity helping gauge overextension.
Entry Arrows – A trend shift triggers either a long or short signal, with a marker at the outermost band with ▲/▼ signs.
Take-Profit Crosses – If price rejects near the outer band (based on aggressiveness setting), a cross appears marking potential profit-taking.
Bounce Signals – Minor pullbacks that respect the basis line are marked with triangle arrows, hinting at continuation setups.
Customization – Users can toggle bar coloring, signal markers, and select between ATR/stdev as well as take-profit aggressiveness.
Alerts – All major signals, including entries, take-profits, and bounces, are available as alert conditions.
USAGE
To use this tool, load it on your chart, adjust the inputs for volatility method and aggressiveness, and wait for entries to form on trend changes. Use TP crosses and bounce arrows as potential exit or scale-in signals.

SPX Weekly Expected Moves# SPX Weekly Expected Moves Indicator
A professional Pine Script indicator for TradingView that displays weekly expected move levels for SPX based on real options data, with integrated Fibonacci retracement analysis and intelligent alerting system.
## Overview
This indicator helps options and equity traders visualize weekly expected move ranges for the S&P 500 Index (SPX) by plotting historical and current week expected move boundaries derived from weekly options pricing. Unlike theoretical volatility calculations, this indicator uses actual market-based expected move data that you provide from options platforms.
## Key Features
### 📈 **Expected Move Visualization**
- **Historical Lines**: Display past weeks' expected moves with configurable history (10, 26, or 52 weeks)
- **Current Week Focus**: Highlighted current week with extended lines to present time
- **Friday Close Reference**: Orange baseline showing the previous Friday's close price
- **Timeframe Independent**: Works consistently across all chart timeframes (1m to 1D)
### 🎯 **Fibonacci Integration**
- **Five Fibonacci Levels**: 23.6%, 38.2%, 50%, 61.8%, 76.4% between Friday close and expected move boundaries
- **Color-Coded Levels**:
- Red: 23.6% & 76.4% (outer levels)
- Blue: 38.2% & 61.8% (golden ratio levels)
- Black: 50% (midpoint - most critical level)
- **Current Week Only**: Fibonacci levels shown only for active trading week to reduce clutter
### 📊 **Real-Time Information Table**
- **Current SPX Price**: Live market price
- **Expected Move**: ±EM value for current week
- **Previous Close**: Friday close price (baseline for calculations)
- **100% EM Levels**: Exact upper and lower boundary prices
- **Current Location**: Real-time position within the EM structure (e.g., "Above 38.2% Fib (upper zone)")
### 🚨 **Intelligent Alert System**
- **Zone-Aware Alerts**: Separate alerts for upper and lower zones
- **Key Level Breaches**: Alerts for 23.6% and 76.4% Fibonacci level crossings
- **Bar Close Based**: Alerts trigger on confirmed bar closes, not tick-by-tick
- **Customizable**: Enable/disable alerts through settings
## How It Works
### Data Input Method
The indicator uses a **manual data entry approach** where you input actual expected move values obtained from options platforms:
```pinescript
// Add entries using the options expiration Friday date
map.put(expected_moves, 20250613, 91.244) // Week ending June 13, 2025
map.put(expected_moves, 20250620, 95.150) // Week ending June 20, 2025
```
### Weekly Structure
- **Monday 9:30 AM ET**: Week begins
- **Friday 4:00 PM ET**: Week ends
- **Lines Extend**: From Monday open to Friday close (historical) or current time + 5 bars (current week)
- **Timezone Handling**: Uses "America/New_York" for proper DST handling
### Calculation Logic
1. **Base Price**: Previous Friday's SPX close price
2. **Expected Move**: Market-derived ±EM value from weekly options
3. **Upper Boundary**: Friday Close + Expected Move
4. **Lower Boundary**: Friday Close - Expected Move
5. **Fibonacci Levels**: Proportional levels between Friday close and EM boundaries
## Setup Instructions
### 1. Data Collection
Obtain weekly expected move values from options platforms such as:
- **ThinkOrSwim**: Use thinkBack feature to look up weekly expected moves
- **Tastyworks**: Check weekly options expected move data
- **CBOE**: Reference SPX weekly options data
- **Manual Calculation**: (ATM Call Premium + ATM Put Premium) × 0.85
### 2. Data Entry
After each Friday close, update the indicator with the next week's expected move:
```pinescript
// Example: On Friday June 7, 2025, add data for week ending June 13
map.put(expected_moves, 20250613, 91.244) // Actual EM value from your platform
```
### 3. Configuration
Customize the indicator through the settings panel:
#### Visual Settings
- **Show Current Week EM**: Toggle current week display
- **Show Past Weeks**: Toggle historical weeks display
- **Max Weeks History**: Choose 10, 26, or 52 weeks of history
- **Show Fibonacci Levels**: Toggle Fibonacci retracement levels
- **Label Controls**: Customize which labels to display
#### Colors
- **Current Week EM**: Default yellow for active week
- **Past Weeks EM**: Default gray for historical weeks
- **Friday Close**: Default orange for baseline
- **Fibonacci Levels**: Customizable colors for each level type
#### Alerts
- **Enable EM Breach Alerts**: Master toggle for all alerts
- **Specific Alerts**: Four alert types for Fibonacci level breaches
## Trading Applications
### Options Trading
- **Straddle/Strangle Positioning**: Visualize breakeven levels for neutral strategies
- **Directional Plays**: Assess probability of reaching target levels
- **Earnings Plays**: Compare actual vs. expected move outcomes
### Equity Trading
- **Support/Resistance**: Use EM boundaries and Fibonacci levels as key levels
- **Breakout Trading**: Monitor for moves beyond expected ranges
- **Mean Reversion**: Look for reversals at extreme Fibonacci levels
### Risk Management
- **Position Sizing**: Gauge likely price ranges for the week
- **Stop Placement**: Use Fibonacci levels for logical stop locations
- **Profit Targets**: Set targets based on EM structure probabilities
## Technical Implementation
### Performance Features
- **Memory Managed**: Configurable history limits prevent memory issues
- **Timeframe Independent**: Uses timestamp-based calculations for consistency
- **Object Management**: Automatic cleanup of drawing objects prevents duplicates
- **Error Handling**: Robust bounds checking and NA value handling
### Pine Script Best Practices
- **v6 Compliance**: Uses latest Pine Script version features
- **User Defined Types**: Structured data management with WeeklyEM type
- **Efficient Drawing**: Smart line/label creation and deletion
- **Professional Standards**: Clean code organization and comprehensive documentation
## Customization Guide
### Adding New Weeks
```pinescript
// Add after market close each Friday
map.put(expected_moves, YYYYMMDD, EM_VALUE)
```
### Color Schemes
Customize colors for different trading styles:
- **Dark Theme**: Use bright colors for visibility
- **Light Theme**: Use contrasting dark colors
- **Minimalist**: Use single color with transparency
### Label Management
Control label density:
- **Show Current Week Labels Only**: Reduce clutter for active trading
- **Show All Labels**: Full information for analysis
- **Selective Display**: Choose specific label types
## Troubleshooting
### Common Issues
1. **No Lines Appearing**: Check that expected move data is entered for current/recent weeks
2. **Wrong Time Display**: Ensure "America/New_York" timezone is properly handled
3. **Duplicate Lines**: Restart indicator if drawing objects appear duplicated
4. **Missing Fibonacci Levels**: Verify "Show Fibonacci Levels" is enabled
### Data Validation
- **Expected Move Format**: Use positive numbers (e.g., 91.244, not ±91.244)
- **Date Format**: Use YYYYMMDD format (e.g., 20250613)
- **Reasonable Values**: Verify EM values are realistic (typically 50-200 for SPX)
## Version History
### Current Version
- **Pine Script v6**: Latest version compatibility
- **Fibonacci Integration**: Five-level retracement analysis
- **Zone-Aware Alerts**: Upper/lower zone differentiation
- **Dynamic Line Management**: Smart current week extension
- **Professional UI**: Comprehensive information table
### Future Enhancements
- **Multiple Symbols**: Extend beyond SPX to other indices
- **Automated Data**: Integration with options data APIs
- **Statistical Analysis**: Success rate tracking for EM predictions
- **Additional Levels**: Custom percentage levels beyond Fibonacci
## License & Usage
This indicator is designed for educational and trading purposes. Users are responsible for:
- **Data Accuracy**: Ensuring correct expected move values
- **Risk Management**: Proper position sizing and risk controls
- **Market Understanding**: Comprehending options-based expected move concepts
## Support
For questions, issues, or feature requests related to this indicator, please refer to the code comments and documentation within the Pine Script file.
---
**Disclaimer**: This indicator is for informational purposes only. Trading involves substantial risk of loss and is not suitable for all investors. Past performance does not guarantee future results.

Multi TF Oscillators Screener [TradingFinder] RSI / ATR / Stoch🔵 Introduction
The oscillator screener is designed to simplify multi-timeframe analysis by allowing traders and analysts to monitor one or multiple symbols across their preferred timeframes—all at the same time. Users can track a single symbol through various timeframes simultaneously or follow multiple symbols in selected intervals. This flexibility makes the tool highly effective for analyzing diverse markets concurrently.
At the core of this screener lie two essential oscillators: RSI (Relative Strength Index) and the Stochastic Oscillator. The RSI measures the speed and magnitude of recent price movements and helps identify overbought or oversold conditions.
It's one of the most reliable indicators for spotting potential reversals. The Stochastic Oscillator, on the other hand, compares the current price to recent highs and lows to detect momentum strength and potential trend shifts. It’s especially effective in identifying divergences and short-term reversal signals.
In addition to these two primary indicators, the screener also displays helpful supplementary data such as the dominant candlestick type (Bullish, Bearish, or Doji), market volatility indicators like ATR and TR, and the four key OHLC prices (Open, High, Low, Close) for each symbol and timeframe. This combination of data gives users a comprehensive technical view and allows for quick, side-by-side comparison of symbols and timeframes.
🔵 How to Use
This tool is built for users who want to view the behavior of a single symbol across several timeframes simultaneously. Instead of jumping between charts, users can quickly grasp the state of a symbol like gold or Bitcoin across the 15-minute, 1-hour, and daily timeframes at a glance. This is particularly useful for traders who rely on multi-timeframe confirmation to strengthen their analysis and decision-making.
The tool also supports simultaneous monitoring of multiple symbols. Users can select and track various assets based on the timeframes that matter most to them. For example, if you’re looking for entry opportunities, the screener allows you to compare setups across several markets side by side—making it easier to choose the most favorable trade. Whether you’re a scalper focused on low timeframes or a swing trader using higher ones, the tool adapts to your workflow.
The screener utilizes the widely-used RSI indicator, which ranges from 0 to 100 and highlights market exhaustion levels. Readings above 70 typically indicate potential pullbacks, while values below 30 may suggest bullish reversals. Viewing RSI across timeframes can reveal meaningful divergences or alignments that improve signal quality.
Another key indicator in the screener is the Stochastic Oscillator, which analyzes the closing price relative to its recent high-low range. When the %K and %D lines converge and cross within the overbought or oversold zones, it often signals a momentum reversal. This oscillator is especially responsive in lower timeframes, making it ideal for spotting quick entries or exits.
Beyond these oscillators, the table includes other valuable data such as candlestick type (bullish, bearish, or doji), volatility measures like ATR and TR, and complete OHLC pricing. This layered approach helps users understand both market momentum and structure at a glance.
Ultimately, this screener allows analysts and traders to gain a full market overview with just one look—empowering faster, more informed, and lower-risk decision-making. It not only saves time but also enhances the precision and clarity of technical analysis.
🔵 Settings
🟣 Display Settings
Table Size : Lets you adjust the table’s visual size with options such as: auto, tiny, small, normal, large, huge.
Table Position : Sets the screen location of the table. Choose from 9 possible positions, combining vertical (top, middle, bottom) and horizontal (left, center, right) alignments.
🟣 Symbol Settings
Each of the 10 symbol slots comes with a full set of customizable parameters :
Enable Symbol : A checkbox to activate or hide each symbol from the table.
Symbol : Define or select the asset (e.g., XAUUSD, BTCUSD, EURUSD, etc.).
Timeframe : Set your desired timeframe for each symbol (e.g., 15, 60, 240, 1D).
RSI Length : Defines the period used in RSI calculation (default is 14).
Stochastic Length : Sets the period for the Stochastic Oscillator.
ATR Length : Sets the length used to calculate the Average True Range, a key volatility metric.
🔵 Conclusion
By combining powerful oscillators like RSI and Stochastic with full customization over symbols and timeframes, this tool provides a fast, flexible solution for technical analysts. Users can instantly monitor one or several assets across multiple timeframes without opening separate charts.
Individual configuration for each symbol, along with the inclusion of key metrics like candlestick type, ATR/TR, and OHLC prices, makes the tool suitable for a wide range of trading styles—from scalping to swing and position trading.
In summary, this screener enables traders to gain a clear, high-level view of various markets in seconds and make quicker, smarter, and lower-risk decisions. It saves time, streamlines analysis, and boosts overall efficiency and confidence in trading strategies.
