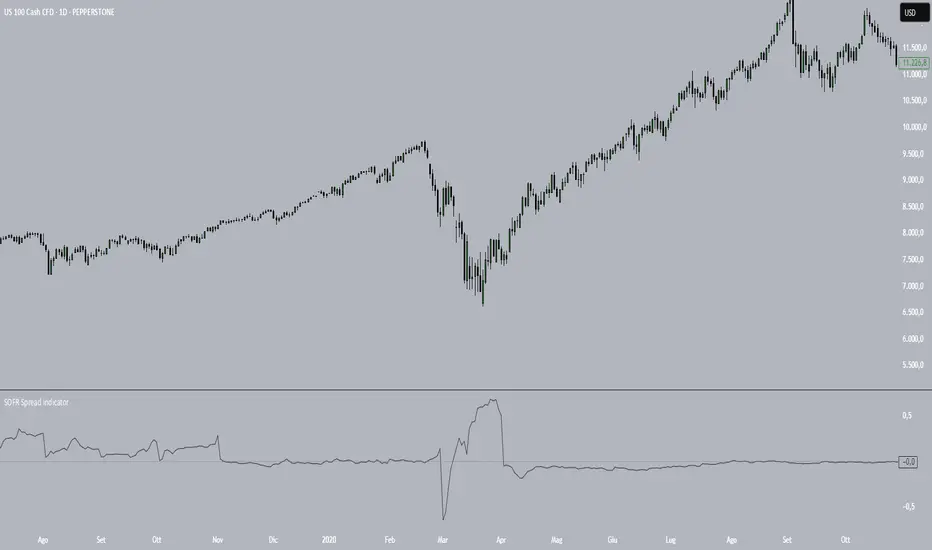
SOFR Spread (proxy: FEDFUNDS - US03MY)📊 SOFR Spread (Proxy: FEDFUNDS - US03MY) – Monitoring USD Money Market Liquidity
In 2008, the spread exhibits a sharp vertical spike, signaling a severe liquidity dislocation: investors rushed into short-term U.S. Treasuries, pushing their yields down dramatically, while the FEDFUNDS rate remained relatively high.
This behavior indicates extreme systemic stress in the interbank lending market, preceding massive Federal Reserve interventions such as rate cuts, emergency liquidity operations, and the launch of quantitative easing (QE).
Description:
This indicator plots the spread between the Effective Federal Funds Rate (FEDFUNDS) and the 3-Month US Treasury Bill yield (US03MY), used here as a proxy for the SOFR spread.
It serves as a simple yet powerful tool to detect liquidity dislocations and stress signals in the US short-term funding markets.
Interpretation:
🔴 Spread > 0.20% → Possible liquidity stress: elevated repo rates, cash shortage, interbank distrust.
🟡 Spread ≈ 0% → Normal market conditions, balanced liquidity.
🟢 Spread < 0% → Excess liquidity: strong demand for T-Bills, “flight to safety”, or distortion due to expansionary monetary policy.
Ideal for:
Monitoring Fed policy impact
Anticipating market-wide liquidity squeezes
Correlation with DXY, SPX, VIX, MOVE Index, and risk sentiment
🧠 Note: As SOFR is not directly available on TradingView, FEDFUNDS is used as a reliable proxy, closely tracking the same trends in most macro conditions.
Volatility
Big Mover Catcher BTC 4h🧠 Big Mover Catcher (BTC 4H Strategy) — Educational Tool
⚠️ Disclaimer: I am not a financial advisor. This script is for educational and testing purposes only. Cryptocurrency trading is highly volatile and involves significant risk. You can lose all of your invested capital.
📌 Overview
The Big Mover Catcher strategy is a work-in-progress trading system designed for Bitcoin (BTC) on the 4-hour chart. It aims to identify strong breakout moves by combining multiple technical indicators and conditions, allowing for high customization and filter-based confirmations.
This script is part of a personal project to learn Pine Script and backtesting on TradingView. It is currently in the testing and research phase.
🎯 Strategy Objective
Catch large, high-momentum breakout moves in the BTC market using:
Bollinger Band breakouts for entry signals
Momentum, volatility, and trend filters for trade confirmation
🧰 Features & Filters
The script provides a flexible set of filters that can be turned ON/OFF and adjusted directly from the settings panel:
✅ Entry Conditions
Price must break above or below Bollinger Bands
All selected filters must align before entry
🧪 Available Filters:
Relative Strength Index (RSI) with EMA/SMA smoothing
Average Directional Index (ADX) with EMA/SMA smoothing
Average True Range (ATR) with EMA/SMA smoothing
MACD Signal above or below zero
EMA 350 trend filter
ATR / ADX / RSI Threshold toggles for added control
🔥 Additional Feature:
Force Take Profit: Optionally closes the trade immediately if a candle closes with more than a defined % movement (default: 5%). This can help lock in quick profits during high volatility moves.
⚙️ Customizable Inputs
You can configure:
Stop loss percentage
All indicator lengths
Smoothing types (EMA/SMA)
Threshold activation toggles
Individual filter ON/OFF switches
This makes the strategy highly adaptable for educational exploration and optimization.
📊 Best Used For
Learning Pine Script and strategy structure
Testing filter combinations for BTC on the 4H timeframe
Understanding how different indicators interact in live markets
⚠️ Note: ❌ Short trades are currently disabled by default, as short-side logic is still under development.
❗ Final Reminder
This script is not financial advice. It is an educational tool. Use it to learn and explore trading logic. Trading cryptocurrencies carries high risk — only invest what you can afford to lose.

Swing Highs and Lows Detector🔍 Swing Highs and Lows Detector
The Swing Highs and Lows Detector is a powerful tool for traders looking to identify meaningful structural shifts in price action, based on swing point logic and internal trend shifts.
📈 What It Does
This indicator automatically identifies and labels:
HH (Higher High) – Price broke above the previous swing high
LH (Lower High) – Price failed to break the previous high, signaling potential weakness
LL (Lower Low) – Price broke below the previous swing low
HL (Higher Low) – Price maintained a higher support level, indicating strength
The script distinguishes between bullish and bearish internal shifts and tracks the highest/lowest points between those shifts to determine the swing structure.
⚙️ How It Works
You can choose between two shift detection modes:
"Open": Compares closing price to the first open of the opposite streak
"High/Low": Uses the high of bearish or low of bullish candles
Once a shift is confirmed, the indicator scans the bars between shifts to find the most significant swing high or low
When a valid swing is detected, it’s labeled directly on the chart with color-coded markers
🛎️ Built-in Alerts
Set alerts for:
Higher High
Lower High
Lower Low
Higher Low
These alerts help you catch key structural shifts in real time — great for breakout traders, structure-based analysts, and smart money concepts (SMC) strategies.
✅ How to Use
Confirm Trend Strength or Reversals – Use HH/HL to confirm an uptrend, LL/LH to confirm a downtrend
Combine with Liquidity Sweeps or Zones – Ideal for SMC or Wyckoff-style setups
Entry/Exit Triggers – Use swing breaks to time entries or exits near key structural points

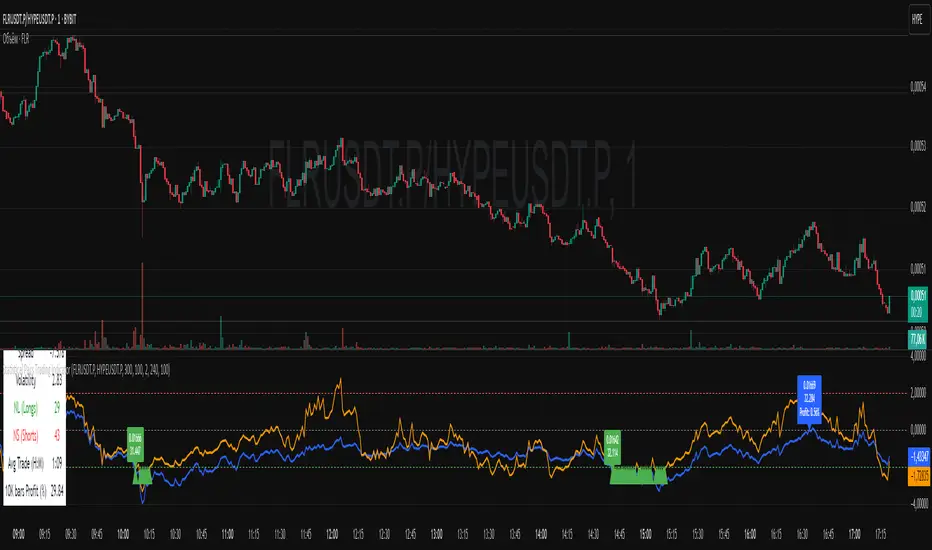
Statistical Pairs Trading IndicatorZ-Score Stat Trading — Statistical Pairs Trading Indicator
📊🔗
---
What is it?
Z-Score Stat Trading is a powerful indicator for statistical pairs trading and quantitative analysis of two correlated assets.
It calculates the Z-Score of the log-price spread between any two symbols you choose, providing both long-term and short-term Z-Score signals.
You’ll also see real-time correlation, volatility, spread, and the number of long/short signals in a handy on-chart table!
---
How to Use 🛠️
1. Add the indicator to your chart.
2. Select two assets (symbols) to analyze in the settings.
3. Watch the Z-Score plots (blue and orange lines) and threshold levels (+2, -2 by default).
4. Check the info table for:
- Correlation
- Volatility
- Spread
- Number of long (NL) and short (NS) signals in the last 1000 bars
5. Set up alerts for signal generation or threshold crossings if you want to be notified automatically.
---
Trading Strategy 💡
- This indicator is designed for statistical arbitrage (mean reversion) strategies.
- Long Signal (🟢):
When both Z-Scores drop below the negative threshold (e.g., -2), a long signal is generated.
→ Buy Symbol A, Sell Symbol B, expecting the spread to revert to the mean.
- Short Signal (🔴):
When both Z-Scores rise above the positive threshold (e.g., +2), a short signal is generated.
→ Sell Symbol A, Buy Symbol B, again expecting mean reversion.
- The info table helps you quickly assess the frequency of signals and the current statistical relationship between your chosen assets.
---
Best Practices & Warnings 🚦
- Avoid high leverage! Pairs trading can be risky, especially during periods of divergence. Use conservative position sizing.
- Check for cointegration: Before using this indicator, make sure both assets are cointegrated or have a strong historical relationship. This increases the reliability of mean reversion signals.
- Check correlation: Only use asset pairs with a high correlation (preferably 0.8–0.9 or higher) for best results. The correlation value is shown in the info table.
- Scale in and out gradually: When entering or exiting positions, consider doing so in parts rather than all at once. This helps manage slippage and risk, especially in volatile markets.
---
⚠️ Note on Performance:
This indicator may work a bit slowly, especially on large timeframes or long chart histories, because the calculation of NL and NS (number of long/short signals) is computationally intensive.
---
Disclaimer ⚠️
This script is provided for educational and informational purposes only .
It is not financial advice or a recommendation to buy or sell any asset.
Use at your own risk. The author assumes no responsibility for any trading decisions or losses.
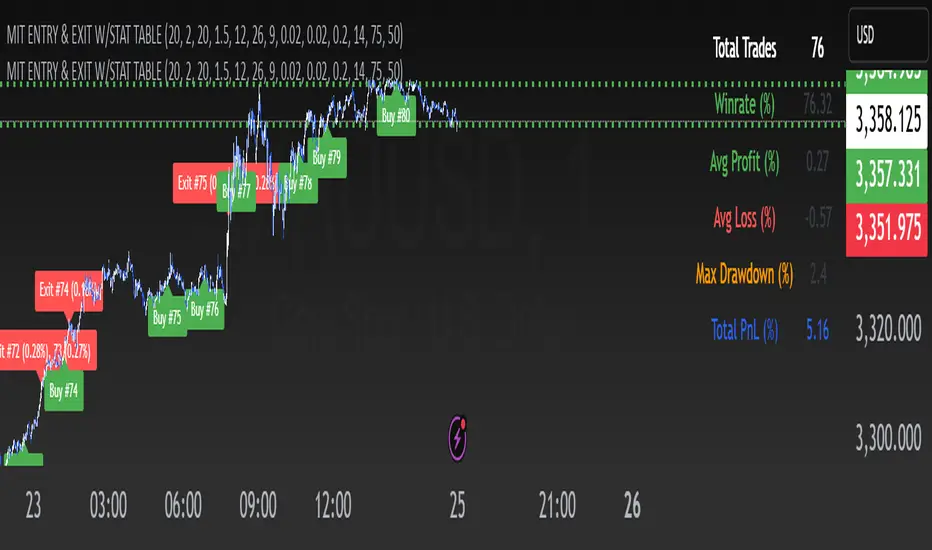
EMA Pullback Speed Strategy 📌 **Overview**
The **EMA Pullback Speed Strategy** is a trend-following approach that combines **price momentum** and **Exponential Moving Averages (EMA)**.
It aims to identify high-probability entry points during brief pullbacks within ongoing uptrends or downtrends.
The strategy evaluates **speed of price movement**, **relative position to dynamic EMA**, and **candlestick patterns** to determine ideal timing for entries.
One of the key concepts is checking whether the price has **“not pulled back too much”**, helping focus only on situations where the trend is likely to continue.
⚠️ This strategy is designed for educational and research purposes only. It does not guarantee future profits.
🧭 **Purpose**
This strategy addresses the common issue of **"jumping in too late during trends and taking unnecessary losses."**
By waiting for a healthy pullback and confirming signs of **trend resumption**, traders can enter with greater confidence and reduce false entries.
🎯 **Strategy Objectives**
* Enter in the direction of the prevailing trend to increase win rate
* Filter out false signals using pullback depth, speed, and candlestick confirmations
* Predefine Take-Profit (TP) and Stop-Loss (SL) levels for safer, rule-based trading
✨ **Key Features**
* **Dynamic EMA**: Reacts faster when price moves quickly, slower when market is calm – adapting to current momentum
* **Pullback Filter**: Avoids trades when price pulls back too far (e.g., more than 5%), indicating a trend may be weakening
* **Speed Check**: Measures how strongly the price returns to the trend using candlestick body speed (open-to-close range in ticks)
📊 **Trading Rules**
**■ Long Entry Conditions:**
* Current price is above the dynamic EMA (indicating uptrend)
* Price has pulled back toward the EMA (a "buy the dip" situation)
* Pullback depth is within the threshold (not excessive)
* Candlesticks show consecutive bullish closes and break the previous high
* Price speed is strong (positive movement with momentum)
**■ Short Entry Conditions:**
* Current price is below the dynamic EMA (indicating downtrend)
* Price has pulled back up toward the EMA (a "sell the rally" setup)
* Pullback is within range (not too deep)
* Candlesticks show consecutive bearish closes and break the previous low
* Price speed is negative (downward momentum confirmed)
**■ Exit Conditions (TP/SL):**
* **Take-Profit (TP):** Fixed 1.5% target above/below entry price
* **Stop-Loss (SL):** Based on recent price volatility, calculated using ATR × 4
💰 **Risk Management Parameters**
* Symbol & Timeframe: BTCUSD on 1-hour chart (H1)
* Test Capital: \$3000 (simulated account)
* Commission: 0.02%
* Slippage: 2 ticks (minimal execution lag)
* Max risk per trade: 5% of account balance
* Backtest Period: Aug 30, 2023 – May 9, 2025
* Profit Factor (PF): 1.965 (Net profit ÷ Net loss, including spreads & fees)
⚙️ **Trading Parameters & Indicator Settings**
* Maximum EMA Length: 50
* Accelerator Multiplier: 3.0
* Pullback Threshold: 5.0%
* ATR Period: 14
* ATR Multiplier (SL distance): 4.0
* Fixed TP: 1.5%
* Short-term EMA: 21
* Long-term EMA: 50
* Long Speed Threshold: ≥ 1000.0 (ticks)
* Short Speed Threshold: ≤ -1000.0 (ticks)
⚠️Adjustments are based on BTCUSD.
⚠️Forex and other currency pairs require separate adjustments.
🔧 **Strategy Improvements & Uniqueness**
Unlike basic moving average crossovers or RSI triggers, this strategy emphasizes **"momentum-supported pullbacks"**.
By combining dynamic EMA, speed checks, and candlestick signals, it captures trades **as if surfing the wave of a trend.**
Its built-in filters help **avoid overextended pullbacks**, which often signal the trend is ending – making it more robust than traditional trend-following systems.
✅ **Summary**
The **EMA Pullback Speed Strategy** is easy to understand, rule-based, and highly reproducible – ideal for both beginners and intermediate traders.
Because it shows **clear visual entry/exit points** on the chart, it’s also a great tool for practicing discretionary trading decisions.
⚠️ Past performance is not a guarantee of future results.
Always respect your Stop-Loss levels and manage your position size according to your risk tolerance.

Wick Spike 50% Detector (15m & 1h)This script identifies candles with significant upper or lower wicks (spikes) based on a percentage of the total candle range. It helps spot potential reversals, exhaustion moves, or liquidity grabs — especially useful in volatile markets.
📍 Key Features:
15-Minute Timeframe:
Red Triangle Above: Candle range ≥ 0.35% and upper wick ≥ 50% of the range.
Green Triangle Below: Candle range ≥ 0.30% and lower wick ≥ 50% of the range.
1-Hour Timeframe:
Red Circle Above: Candle range ≥ 0.50% and upper wick ≥ 50%.
Green Circle Below: Candle range ≥ 0.50% and lower wick ≥ 50%.
📢 Alerts:
Alerts trigger when the 50% spike condition is met — within the last 60 seconds before candle close — ensuring timely notifications.
🎯 Designed to assist traders in identifying spike-driven opportunities and refining entry/exit strategies.

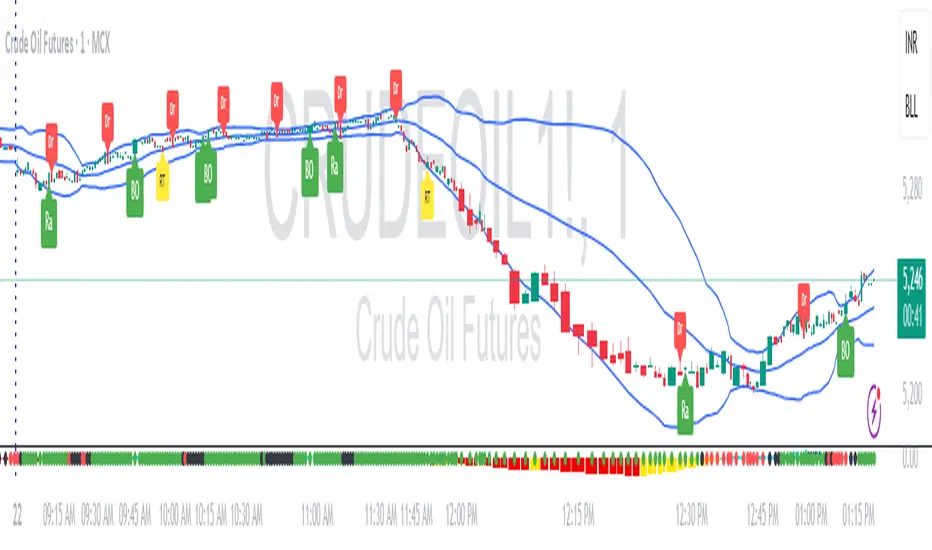
RDBRB Strategy with Filters + Cooldowns + LabelsRDBRB Strategy with Filters + Cooldowns
This script implements the RDBRB (Rally-Drop-Base-Retest-Breakout) strategy, a classic price action setup designed to identify structured trade opportunities using volume, volatility bands, and trend alignment. It’s ideal for traders looking for clean, rule-based entries across any timeframe.
🧠 Core Components
Rally & Drop Detection
Identifies short-term momentum shifts using moving average crossovers:
✅ Ra = Rally (bullish crossover)
🔻 Dr = Drop (bearish crossunder)
Base Formation
A statistical base is defined using a moving average with a standard deviation envelope (Upper/Lower BB). This forms the foundation for breakout or retest setups.
Retest Zone (RT)
When price returns to the lower band (but stays below the base), it suggests a potential re-accumulation or reaction zone before a breakout.
Breakout Confirmation (BO)
A breakout is validated when:
Price crosses above the upper band
Volume exceeds the 20-bar average by a threshold multiplier
RSI is above a bullish momentum level
Price is trending above the longer-term EMA
⏱️ Smart Cooldown Logic
Each signal (Rally, Drop, Retest, Breakout) has an independent cooldown timer to prevent multiple triggers within a short range, filtering out noise and duplicate signals:
Customizable cooldown periods via input settings
Ensures signals are meaningful and not clustered
💡 Visual Markers
All signals are shown as small, color-coded labels:
Ra : Green label below bar
Dr : Red label above bar
RT : Yellow label below bar
BO : Green breakout label below bar
Bands and base are plotted for structure reference.
🛠️ Customizable Settings
Cooldown periods for each signal type
MA lengths, volume and RSI thresholds
Trend filter and base calculation inputs
This script is ideal for price action traders who want a clean, structured method to trade consolidations and trend continuations while avoiding over-signaling. Use it on any timeframe and combine with higher-timeframe confirmation for best results.
Beyond Insights IndicatorThe Beyond Insights Indicator is a multi-timeframe overlay tool designed for TradingView that displays key Exponential Moving Averages (EMAs) and volatility insights to support various trading strategies. It intelligently adapts its display based on the current chart timeframe to reduce clutter and enhance relevance. Specifically, it shows EMA 6, 18, and 50 when viewing intraday timeframes.
In addition to EMAs, the indicator includes an ATR (Average True Range) calculation with a default length of 14, offering insight into market volatility.

Full Day Midpoint Line with Dynamic StdDev Bands (ETH & RTH)A Pine Script indicator designed to plot a midpoint line based on the high and low prices of a user-defined trading session (typically Extended Trading Hours, ETH) and to add dynamic standard deviation (StdDev) bands around this midpoint.
Session Midpoint Line:
The midpoint is calculated as the average of the session's highest high and lowest low during the defined ETH period (e.g., 4:00 AM to 8:00 PM).
This line represents a central tendency or "fair value" for the session, similar to a pivot point or volume-weighted average price (VWAP) anchor.
Interpretation:
Prices above the midpoint suggest bullish sentiment, while prices below indicate bearish sentiment.
The midpoint can act as a dynamic support/resistance level, where price may revert to or react at this level during the session.
Dynamic StdDev Bands:
The bands are calculated by adding/subtracting a multiple of the standard deviation of the midpoint values (tracked in an array) from the midpoint.
The standard deviation is dynamically computed based on the historical midpoint values within the session, making the bands adaptive to volatility.
Interpretation:
The upper and lower bands represent potential overbought (upper) and oversold (lower) zones.
Prices approaching or crossing the bands may indicate stretched conditions, potentially signaling reversals or breakouts.
Trend Identification:
Use the midpoint as a reference for the session’s trend. Persistent price action above the midpoint suggests bullishness, while below indicates bearishness.
Combine with other indicators (e.g., moving averages, RSI) to confirm trend direction.
Support/Resistance Trading:
Treat the midpoint as a dynamic pivot point. Price rejections or consolidations near the midpoint can be entry points for mean-reversion trades.
The StdDev bands can act as secondary support/resistance levels. For example, price reaching the upper band may signal a potential short entry if accompanied by reversal signals.
Breakout/Breakdown Strategies:
A strong move beyond the upper or lower band may indicate a breakout (bullish above upper, bearish below lower). Confirm with volume or momentum indicators to avoid false breakouts.
The dynamic nature of the bands makes them useful for identifying significant price extensions.
Volatility Assessment:
Wider bands indicate higher volatility, suggesting larger price swings and potentially riskier trades.
Narrow bands suggest consolidation, which may precede a breakout. Traders can prepare for volatility expansions in such scenarios.
The "Full Day Midpoint Line with Dynamic StdDev Bands" is a versatile and visually intuitive indicator well-suited for day traders focusing on session-specific price action. Its dynamic midpoint and volatility-adjusted bands provide valuable insights into support, resistance, and potential reversals or breakouts.

SMC ICT – Simplified Daily Trend & Reversal AnalyzerThis Pine Script provides a simplified approach to analyzing daily trends and potential reversals using concepts inspired by Smart Money Concepts (SMC) and ICT (Inner Circle Trader).
What It Does:
• Detects daily uptrend and downtrend conditions by comparing the current daily high/low to the previous day’s values.
• Highlights potential bullish or bearish reversal zones when price behavior suggests a shift in sentiment.
• Automatically draws dashed lines for the previous day's high and low.
• Labels these high/low levels for quick visual reference.
How to Use:
Apply this indicator to any timeframe chart. Use the plotted trend markers to assess daily direction and potential reversal signals. The dashed lines (previous high/low) can be used as reference points for liquidity zones or break/retest entries.
User Interface:
The indicator displays labels and shapes in English. This script is intended for educational and trading workflow enhancement purposes.
Note:
This is an open-source tool designed for clarity and basic SMC/ICT application. It is best used in combination with other confluences like FVGs, order blocks, and liquidity sweeps.

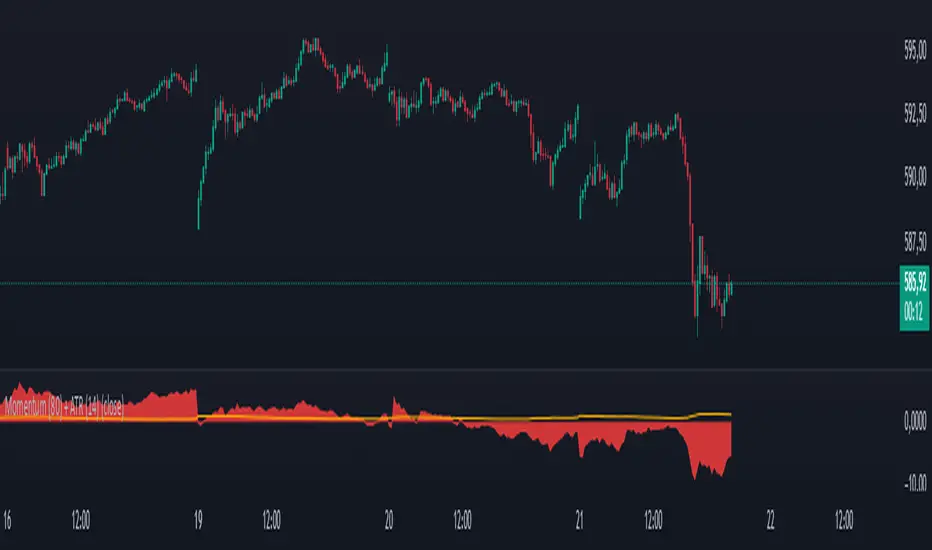
Momentum (80) + ATR (14)his indicator combines two essential technical analysis tools in a single panel for enhanced market insight:
🔹 Momentum (80 periods): Measures the difference between the current price and the price 80 bars ago. Displayed as a semi-transparent filled area, it helps to visually identify shifts in price momentum over a longer timeframe.
🔸 ATR (Average True Range, 14 periods): Shown as a fine orange line, the ATR represents average market volatility over 14 periods, highlighting phases of calm or increased price fluctuations.
By viewing both momentum and volatility simultaneously, traders can better assess trend strength and market conditions, improving decision-making across assets such as stocks, forex, and cryptocurrencies.
✅ Suitable for all asset types
✅ Complements other indicators like RSI, MACD, and Bollinger Bands
✅ Categorized under Momentum & Volatility indicators
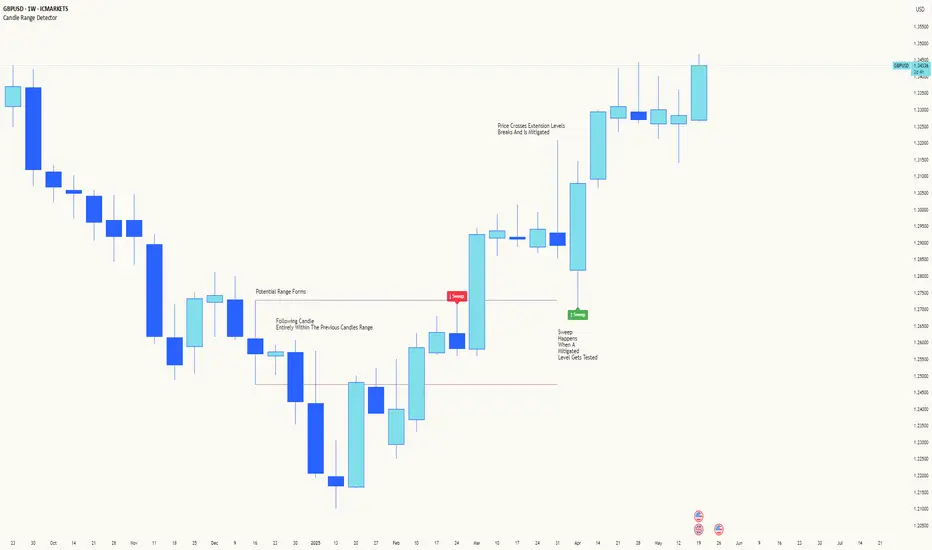
Candle Range DetectorCandle Range Detector
// Pine Script v6
// Detects candle-based ranges, mitigations, and sweeps with advanced logic
Overview
This indicator automatically detects price ranges based on candle containment, then tracks when those ranges are mitigated (broken) and when a sweep occurs. It is designed for traders who want to identify liquidity events and range breaks with precision.
How It Works
- Range Detection: A range is formed when a candle is fully contained within the previous candle (its high is lower and its low is higher). This marks a potential area of price balance or liquidity.
- Mitigation: A range is considered mitigated when price closes beyond its extension levels (configurable by normal or Fibonacci logic). This signals that the range has been invalidated or "taken out" by price action.
- Sweep Detection: After mitigation, the script watches for a sweep event: a candle that both trades through the range extreme and closes decisively beyond the log-mid of the candle itself. This is a strong sign of a liquidity grab or stop run.
- Alerts & Visuals: You can enable alerts and on-chart labels for sweeps. Only the most recent mitigated range can be swept, and each range can only be swept once.
- Timeframe Sensitivity: On weekly or monthly charts, a candle can both mitigate and sweep a range on the same bar. On lower timeframes, only one event can occur per bar.
Why It Works
- Candle containment is a robust way to identify natural price ranges and liquidity pools, as it reflects where price is consolidating or being absorbed.
- Mitigation marks the moment when a range is no longer defended, often leading to new directional moves.
- Sweeps are powerful signals of stop hunts or liquidity grabs, especially when confirmed by a close beyond the log-mid of the candle, indicating strong intent.
Visual Explanation
Tip: Use this tool to spot high-probability reversal or continuation zones, and to get alerted to key liquidity events in real time.
Ultimate Scalping Tool[BullByte]Overview
The Ultimate Scalping Tool is an open-source TradingView indicator built for scalpers and short-term traders released under the Mozilla Public License 2.0. It uses a custom Quantum Flux Candle (QFC) oscillator to combine multiple market forces into one visual signal. In plain terms, the script reads momentum, trend strength, volatility, and volume together and plots a special “candlestick” each bar (the QFC) that reflects the overall market bias. This unified view makes it easier to spot entries and exits: the tool labels signals as Strong Buy/Sell, Pullback (a brief retracement in a trend), Early Entry, or Exit Warning . It also provides color-coded alerts and a small dashboard of metrics. In practice, traders see green/red oscillator bars and symbols on the chart when conditions align, helping them scalp or trend-follow without reading multiple separate indicators.
Core Components
Quantum Flux Candle (QFC) Construction
The QFC is the heart of the indicator. Rather than using raw price, it creates a candlestick-like bar from the underlying oscillator values. Each QFC bar has an “open,” “high/low,” and “close” derived from calculated momentum and volatility inputs for that period . In effect, this turns the oscillator into intuitive candle patterns so traders can recognize momentum shifts visually. (For comparison, note that Heikin-Ashi candles “have a smoother look because take an average of the movement”. The QFC instead represents exact oscillator readings, so it reflects true momentum changes without hiding price action.) Colors of QFC bars change dynamically (e.g. green for bullish momentum, red for bearish) to highlight shifts. This is the first open-source QFC oscillator that dynamically weights four non-correlated indicators with moving thresholds, which makes it a unique indicator on its own.
Oscillator Normalization & Adaptive Weights
The script normalizes its oscillator to a fixed scale (for example, a 0–100 range much like the RSI) so that various inputs can be compared fairly. It then applies adaptive weighting: the relative influence of trend, momentum, volatility or volume signals is automatically adjusted based on current market conditions. For instance, in very volatile markets the script might weight volatility more heavily, or in a strong trend it might give extra weight to trend direction. Normalizing data and adjusting weights helps keep the QFC sensitive but stable (normalization ensures all inputs fit a common scale).
Trend/Momentum/Volume/Volatility Fusion
Unlike a typical single-factor oscillator, the QFC oscillator fuses four aspects at once. It may compute, for example, a trend indicator (such as an ADX or moving average slope), a momentum measure (like RSI or Rate-of-Change), a volume-based pressure (similar to MFI/OBV), and a volatility measure (like ATR) . These different values are combined into one composite oscillator. This “multi-dimensional” approach follows best practices of using non-correlated indicators (trend, momentum, volume, volatility) for confirmation. By encoding all these signals in one line, a high QFC reading means that trend, momentum, and volume are all aligned, whereas a neutral reading might mean mixed conditions. This gives traders a comprehensive picture of market strength.
Signal Classification
The script interprets the QFC oscillator to label trades. For example:
• Strong Buy/Sell : Triggered when the oscillator crosses a high-confidence threshold (e.g. breaks clearly above zero with strong slope), indicating a well-confirmed move. This is like seeing a big green/red QFC candle aligned with the trend.
• Pullbacks : Identified when the trend is up but momentum dips briefly. A Pullback Buy appears if the overall trend is bullish but the oscillator has a short retracement – a typical buying opportunity in an uptrend. (A pullback is “a brief decline or pause in a generally upward price trend”.)
• Early Buy/Sell : Marks an initial swing in the oscillator suggesting a possible new trend, before it is fully confirmed. It’s a hint of momentum building (an early-warning signal), not as strong as the confirmed “Strong” signal.
• Exit Warnings : Issued when momentum peaks or reverses. For instance, if the QFC bars reach a high and start turning red/green opposite, the indicator warns that the move may be ending. In other words, a Momentum Peak is the point of maximum strength after which weakness may follow.
These categories correspond to typical trading concepts: Pullback (temporary reversal in an uptrend), Early Buy (an initial bullish cross), Strong Buy (confirmed bullish momentum), and Momentum Peak (peak oscillator value suggesting exhaustion).
Filters (DI Reversal, Dynamic Thresholds, HTF EMA/ADX)
Extra filters help avoid bad trades. A DI Reversal filter uses the +DI/–DI lines (from the ADX system) to require that the trend direction confirms the signal . For example, it might ignore a buy signal if the +DI is still below –DI. Dynamic Thresholds adjust signal levels on-the-fly: rather than fixed “overbought” lines, they move with volatility so signals happen under appropriate market stress. An optional High-Timeframe EMA or ADX filter adds a check against a larger timeframe trend: for instance, only taking a trade if price is above the weekly EMA or if weekly ADX shows a strong trend. (Notably, the ADX is “a technical indicator used by traders to determine the strength of a price trend”, so requiring a high-timeframe ADX avoids trading against the bigger trend.)
Dashboard Metrics & Color Logic
The Dashboard in the Ultimate Scalping Tool (UST) serves as a centralized information hub, providing traders with real-time insights into market conditions, trend strength, momentum, volume pressure, and trade signals. It is highly customizable, allowing users to adjust its appearance and content based on their preferences.
1. Dashboard Layout & Customization
Short vs. Extended Mode : Users can toggle between a compact view (9 rows) and an extended view (13 rows) via the `Short Dashboard` input.
Text Size Options : The dashboard supports three text sizes— Tiny, Small, and Normal —adjustable via the `Dashboard Text Size` input.
Positioning : The dashboard is positioned in the top-right corner by default but can be moved if modified in the script.
2. Key Metrics Displayed
The dashboard presents critical trading metrics in a structured table format:
Trend (TF) : Indicates the current trend direction (Strong Bullish, Moderate Bullish, Sideways, Moderate Bearish, Strong Bearish) based on normalized trend strength (normTrend) .
Momentum (TF) : Displays momentum status (Strong Bullish/Bearish or Neutral) derived from the oscillator's position relative to dynamic thresholds.
Volume (CMF) : Shows buying/selling pressure levels (Very High Buying, High Selling, Neutral, etc.) based on the Chaikin Money Flow (CMF) indicator.
Basic & Advanced Signals:
Basic Signal : Provides simple trade signals (Strong Buy, Strong Sell, Pullback Buy, Pullback Sell, No Trade).
Advanced Signal : Offers nuanced signals (Early Buy/Sell, Momentum Peak, Weakening Momentum, etc.) with color-coded alerts.
RSI : Displays the Relative Strength Index (RSI) value, colored based on overbought (>70), oversold (<30), or neutral conditions.
HTF Filter : Indicates the higher timeframe trend status (Bullish, Bearish, Neutral) when using the Leading HTF Filter.
VWAP : Shows the V olume-Weighted Average Price and whether the current price is above (bullish) or below (bearish) it.
ADX : Displays the Average Directional Index (ADX) value, with color highlighting whether it is rising (green) or falling (red).
Market Mode : Shows the selected market type (Crypto, Stocks, Options, Forex, Custom).
Regime : Indicates volatility conditions (High, Low, Moderate) based on the **ATR ratio**.
3. Filters Status Panel
A secondary panel displays the status of active filters, helping traders quickly assess which conditions are influencing signals:
- DI Reversal Filter: On/Off (confirms reversals before generating signals).
- Dynamic Thresholds: On/Off (adjusts buy/sell thresholds based on volatility).
- Adaptive Weighting: On/Off (auto-adjusts oscillator weights for trend/momentum/volatility).
- Early Signal: On/Off (enables early momentum-based signals).
- Leading HTF Filter: On/Off (applies higher timeframe trend confirmation).
4. Visual Enhancements
Color-Coded Cells : Each metric is color-coded (green for bullish, red for bearish, gray for neutral) for quick interpretation.
Dynamic Background : The dashboard background adapts to market conditions (bullish/bearish/neutral) based on ADX and DI trends.
Customizable Reference Lines : Users can enable/disable fixed reference lines for the oscillator.
How It(QFC) Differs from Traditional Indicators
Quantum Flux Candle (QFC) Versus Heikin-Ashi
Heikin-Ashi candles smooth price by averaging (HA’s open/close use averages) so they show trend clearly but hide true price (the current HA bar’s close is not the real price). QFC candles are different: they are oscillator values, not price averages . A Heikin-Ashi chart “has a smoother look because it is essentially taking an average of the movement”, which can cause lag. The QFC instead shows the raw combined momentum each bar, allowing faster recognition of shifts. In short, HA is a smoothed price chart; QFC is a momentum-based chart.
Versus Standard Oscillators
Common oscillators like RSI or MACD use fixed formulas on price (or price+volume). For example, RSI “compares gains and losses and normalizes this value on a scale from 0 to 100”, reflecting pure price momentum. MFI is similar but adds volume. These indicators each show one dimension: momentum or volume. The Ultimate Scalping Tool’s QFC goes further by integrating trend strength and volatility too. In practice, this means a move that looks strong on RSI might be downplayed by low volume or weak trend in QFC. As one source notes, using multiple non-correlated indicators (trend, momentum, volume, volatility) provides a more complete market picture. The QFC’s multi-factor fusion is unique – it is effectively a multi-dimensional oscillator rather than a traditional single-input one.
Signal Style
Traditional oscillators often use crossovers (RSI crossing 50) or fixed zones (MACD above zero) for signals. The Ultimate Scalping Tool’s signals are custom-classified: it explicitly labels pullbacks, early entries, and strong moves. These terms go beyond a typical indicator’s generic “buy”/“sell.” In other words, it packages a strategy around the oscillator, which traders can backtest or observe without reading code.
Key Term Definitions
• Pullback : A short-term dip or consolidation in an uptrend. In this script, a Pullback Buy appears when price is generally rising but shows a brief retracement. (As defined by Investopedia, a pullback is “a brief decline or pause in a generally upward price trend”.)
• Early Buy/Sell : An initial or tentative entry signal. It means the oscillator first starts turning positive (or negative) before a full trend has developed. It’s an early indication that a trend might be starting.
• Strong Buy/Sell : A confident entry signal when multiple conditions align. This label is used when momentum is already strong and confirmed by trend/volume filters, offering a higher-probability trade.
• Momentum Peak : The point where bullish (or bearish) momentum reaches its maximum before weakening. When the oscillator value stops rising (or falling) and begins to reverse, the script flags it as a peak – signaling that the current move could be overextended.
What is the Flux MA?
The Flux MA (Moving Average) is an Exponential Moving Average (EMA) applied to a normalized oscillator, referred to as FM . Its purpose is to smooth out the fluctuations of the oscillator, providing a clearer picture of the underlying trend direction and strength. Think of it as a dynamic baseline that the oscillator moves above or below, helping you determine whether the market is trending bullish or bearish.
How it’s calculated (Flux MA):
1.The oscillator is normalized (scaled to a range, typically between 0 and 1, using a default scale factor of 100.0).
2.An EMA is applied to this normalized value (FM) over a user-defined period (default is 10 periods).
3.The result is rescaled back to the oscillator’s original range for plotting.
Why it matters : The Flux MA acts like a support or resistance level for the oscillator, making it easier to spot trend shifts.
Color of the Flux Candle
The Quantum Flux Candle visualizes the normalized oscillator (FM) as candlesticks, with colors that indicate specific market conditions based on the relationship between the FM and the Flux MA. Here’s what each color means:
• Green : The FM is above the Flux MA, signaling bullish momentum. This suggests the market is trending upward.
• Red : The FM is below the Flux MA, signaling bearish momentum. This suggests the market is trending downward.
• Yellow : Indicates strong buy conditions (e.g., a "Strong Buy" signal combined with a positive trend). This is a high-confidence signal to go long.
• Purple : Indicates strong sell conditions (e.g., a "Strong Sell" signal combined with a negative trend). This is a high-confidence signal to go short.
The candle mode shows the oscillator’s open, high, low, and close values for each period, similar to price candlesticks, but it’s the color that provides the quick visual cue for trading decisions.
How to Trade the Flux MA with Respect to the Candle
Trading with the Flux MA and Quantum Flux Candle involves using the MA as a trend indicator and the candle colors as entry and exit signals. Here’s a step-by-step guide:
1. Identify the Trend Direction
• Bullish Trend : The Flux Candle is green and positioned above the Flux MA. This indicates upward momentum.
• Bearish Trend : The Flux Candle is red and positioned below the Flux MA. This indicates downward momentum.
The Flux MA serves as the reference line—candles above it suggest buying pressure, while candles below it suggest selling pressure.
2. Interpret Candle Colors for Trade Signals
• Green Candle : General bullish momentum. Consider entering or holding a long position.
• Red Candle : General bearish momentum. Consider entering or holding a short position.
• Yellow Candle : A strong buy signal. This is an ideal time to enter a long trade.
• Purple Candle : A strong sell signal. This is an ideal time to enter a short trade.
3. Enter Trades Based on Crossovers and Colors
• Long Entry : Enter a buy position when the Flux Candle turns green and crosses above the Flux MA. If it turns yellow, this is an even stronger signal to go long.
• Short Entry : Enter a sell position when the Flux Candle turns red and crosses below the Flux MA. If it turns purple, this is an even stronger signal to go short.
4. Exit Trades
• Exit Long : Close your buy position when the Flux Candle turns red or crosses below the Flux MA, indicating the bullish trend may be reversing.
• Exit Short : Close your sell position when the Flux Candle turns green or crosses above the Flux MA, indicating the bearish trend may be reversing.
•You might also exit a long trade if the candle changes from yellow to green (weakening strong buy signal) or a short trade from purple to red (weakening strong sell signal).
5. Use Additional Confirmation
To avoid false signals, combine the Flux MA and candle signals with other indicators or dashboard metrics (e.g., trend strength, momentum, or volume pressure). For example:
•A yellow candle with a " Strong Bullish " trend and high buying volume is a robust long signal.
•A red candle with a " Moderate Bearish " trend and neutral momentum might need more confirmation before shorting.
Practical Example
Imagine you’re scalping a cryptocurrency:
• Long Trade : The Flux Candle turns yellow and is above the Flux MA, with the dashboard showing "Strong Buy" and high buying volume. You enter a long position. You exit when the candle turns red and dips below the Flux MA.
• Short Trade : The Flux Candle turns purple and crosses below the Flux MA, with a "Strong Sell" signal on the dashboard. You enter a short position. You exit when the candle turns green and crosses above the Flux MA.
Market Presets and Adaptation
This indicator is designed to work on any market with candlestick price data (stocks, crypto, forex, indices, etc.). To handle different behavior, it provides presets for major asset classes. Selecting a “Stocks,” “Crypto,” “Forex,” or “Options” preset automatically loads a set of parameter values optimized for that market . For example, a crypto preset might use a shorter lookback or higher sensitivity to account for crypto’s high volatility, while a stocks preset might use slightly longer smoothing since stocks often trend more slowly. In practice, this means the same core QFC logic applies across markets, but the thresholds and smoothing adjust so signals remain relevant for each asset type.
Usage Guidelines
• Recommended Timeframes : Optimized for 1 minute to 15 minute intraday charts. Can also be used on higher timeframes for short term swings.
• Market Types : Select “Crypto,” “Stocks,” “Forex,” or “Options” to auto tune periods, thresholds and weights. Use “Custom” to manually adjust all inputs.
• Interpreting Signals : Always confirm a signal by checking that trend, volume, and VWAP agree on the dashboard. A green “Strong Buy” arrow with green trend, green volume, and price > VWAP is highest probability.
• Adjusting Sensitivity : To reduce false signals in fast markets, enable DI Reversal Confirmation and Dynamic Thresholds. For more frequent entries in trending environments, enable Early Entry Trigger.
• Risk Management : This tool does not plot stop loss or take profit levels. Users should define their own risk parameters based on support/resistance or volatility bands.
Background Shading
To give you an at-a-glance sense of market regime without reading numbers, the indicator automatically tints the chart background in three modes—neutral, bullish and bearish—with two levels of intensity (light vs. dark):
Neutral (Gray)
When ADX is below 20 the market is considered “no trend” or too weak to trade. The background fills with a light gray (high transparency) so you know to sit on your hands.
Bullish (Green)
As soon as ADX rises above 20 and +DI exceeds –DI, the background turns a semi-transparent green, signaling an emerging uptrend. When ADX climbs above 30 (strong trend), the green becomes more opaque—reminding you that trend-following signals (Strong Buy, Pullback) carry extra weight.
Bearish (Red)
Similarly, if –DI exceeds +DI with ADX >20, you get a light red tint for a developing downtrend, and a darker, more solid red once ADX surpasses 30.
By dynamically varying both hue (green vs. red vs. gray) and opacity (light vs. dark), the background instantly communicates trend strength and direction—so you always know whether to favor breakout-style entries (in a strong trend) or stay flat during choppy, low-ADX conditions.
The setup shown in the above chart snapshot is BTCUSD 15 min chart : Binance for reference.
Disclaimer
No indicator guarantees profits. Backtest or paper trade this tool to understand its behavior in your market. Always use proper position sizing and stop loss orders.
Good luck!
- BullByte

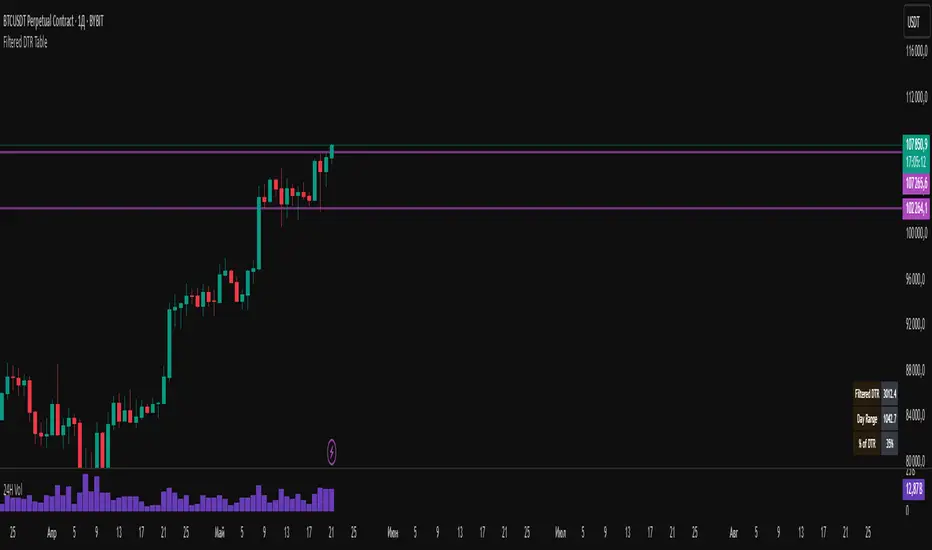
Filtered DTR Table📊 Filtered Daily True Range (DTR) Indicator
This indicator calculates and displays a filtered version of the Daily True Range (DTR) over the last 14 trading days, using high and low prices of each day.
It filters out extreme values by excluding any daily range that is:
Less than 0.5× the average range
Greater than 2× the average range
The indicator shows a table in the bottom-right corner of the main chart, containing:
Filtered ATR – The average of valid (filtered) daily ranges over the past 14 days, based on the high-low difference.
Current Day's Range – The high-low range of the current trading day.
% of ATR – How much of the filtered ATR has been covered by today's range, expressed as a whole number percentage.
PhenLabs - Market Fluid Dynamics📊 Market Fluid Dynamics -
Version: PineScript™ v6
📌 Description
The Market Fluid Dynamics - Phen indicator is a new thinking regarding market analysis by modeling price action, volume, and volatility using a fluid system. It attempts to offer traders control over more profound market forces, such as momentum (speed), resistance (thickness), and buying/selling pressure. By visualizing such dynamics, the script allows the traders to decide on the prevailing market flow, its power, likely continuations, and zones of calmness and chaos, and thereby allows improved decision-making.
This measure avoids the usual difficulty of reconciling multiple, often contradictory, market indications by including them within a single overarching model. It moves beyond traditional binary indicators by providing a multi-dimensional view of market behavior, employing fluid dynamic analogs to describe complex interactions in an accessible manner.
🚀 Points of Innovation
Integrated Fluid Dynamics Model: Combines velocity, viscosity, pressure, and turbulence into a single indicator.
Normalized Metrics: Uses ATR and other normalization techniques for consistent readings across different assets and timeframes.
Dynamic Flow Visualization: Main flow line changes color and intensity based on direction and strength.
Turbulence Background: Visually represents market stability with a gradient background, from calm to turbulent.
Comprehensive Dashboard: Provides an at-a-glance summary of key fluid dynamic metrics.
Multi-Layer Smoothing: Employs several layers of EMA smoothing for a clearer, more responsive main flow line.
🔧 Core Components
Velocity Component: Measures price momentum (first derivative of price), normalized by ATR. It indicates the speed and direction of price changes.
Viscosity Component: Represents market resistance to price changes, derived from ATR relative to its historical average. Higher viscosity suggests it’s harder for prices to move.
Pressure Component: Quantifies the force created by volume and price range (close - open), normalized by ATR. It reflects buying or selling pressure.
Turbulence Detection: Calculates a Reynolds number equivalent to identify market stability, ranging from laminar (stable) to turbulent (chaotic).
Main Flow Indicator: Combines the above components, applying sensitivity and smoothing, to generate a primary signal of market direction and strength.
🔥 Key Features
Advanced Smoothing Algorithm: Utilizes multiple EMA layers on the raw flow calculation for a fluid and responsive main flow line, reducing noise while maintaining sensitivity.
Gradient Flow Coloring: The main flow line dynamically changes color from light to deep blue for bullish flow and light to deep red for bearish flow, with intensity reflecting flow strength. This provides an immediate visual cue of market sentiment and momentum.
Turbulence Level Background: The chart background changes color based on calculated turbulence (from calm gray to vibrant orange), offering an intuitive understanding of market stability and potential for erratic price action.
Informative Dashboard: A customizable on-screen table displays critical metrics like Flow State, Flow Strength, Market Viscosity, Turbulence, Pressure Force, Flow Acceleration, and Flow Continuity, allowing traders to quickly assess current market conditions.
Configurable Lookback and Sensitivity: Users can adjust the base lookback period for calculations and the sensitivity of the flow to viscosity, tailoring the indicator to different trading styles and market conditions.
Alert Conditions: Pre-defined alerts for flow direction changes (positive/negative crossover of zero line) and detection of high turbulence states.
🎨 Visualization
Main Flow Line: A smoothed line plotted below the main chart, colored blue for bullish flow and red for bearish flow. The intensity of the color (light to dark) indicates the strength of the flow. This line crossing the zero line can signal a change in market direction.
Zero Line: A dotted horizontal line at the zero level, serving as a baseline to gauge whether the market flow is positive (bullish) or negative (bearish).
Turbulence Background: The indicator pane’s background color changes based on the calculated turbulence level. A calm, almost transparent gray indicates low turbulence (laminar flow), while a more vibrant, semi-transparent orange signifies high turbulence. This helps traders visually assess market stability.
Dashboard Table: An optional table displayed on the chart, showing key metrics like ‘Flow State’, ‘Flow Strength’, ‘Market Viscosity’, ‘Turbulence’, ‘Pressure Force’, ‘Flow Acceleration’, and ‘Flow Continuity’ with their current values and qualitative descriptions (e.g., ‘Bullish Flow’, ‘Laminar (Stable)’).
📖 Usage Guidelines
Setting Categories
Show Dashboard - Default: true; Range: true/false; Description: Toggles the visibility of the Market Fluid Dynamics dashboard on the chart. Enable to see key metrics at a glance.
Base Lookback Period - Default: 14; Range: 5 - (no upper limit, practical limits apply); Description: Sets the primary lookback period for core calculations like velocity, ATR, and volume SMA. Shorter periods make the indicator more sensitive to recent price action, while longer periods provide a smoother, slower signal.
Flow Sensitivity - Default: 0.5; Range: 0.1 - 1.0 (step 0.1); Description: Adjusts how much the market viscosity dampens the raw flow. A lower value means viscosity has less impact (flow is more sensitive to raw velocity/pressure), while a higher value means viscosity has a greater dampening effect.
Flow Smoothing - Default: 5; Range: 1 - 20; Description: Controls the length of the EMA smoothing applied to the main flow line. Higher values result in a smoother flow line but with more lag; lower values make it more responsive but potentially noisier.
Dashboard Position - Default: ‘Top Right’; Range: ‘Top Right’, ‘Top Left’, ‘Bottom Right’, ‘Bottom Left’, ‘Middle Right’, ‘Middle Left’; Description: Determines the placement of the dashboard on the chart.
Header Size - Default: ‘Normal’; Range: ‘Tiny’, ‘Small’, ‘Normal’, ‘Large’, ‘Huge’; Description: Sets the text size for the dashboard header.
Values Size - Default: ‘Small’; Range: ‘Tiny’, ‘Small’, ‘Normal’, ‘Large’; Description: Sets the text size for the metric values in the dashboard.
✅ Best Use Cases
Trend Identification: Identifying the dominant market flow (bullish or bearish) and its strength to trade in the direction of the prevailing trend.
Momentum Confirmation: Using the flow strength and acceleration to confirm the conviction behind price movements.
Volatility Assessment: Utilizing the turbulence metric to gauge market stability, helping to adjust position sizing or avoid choppy conditions.
Reversal Spotting: Watching for divergences between price and flow, or crossovers of the main flow line above/below the zero line, as potential reversal signals, especially when combined with changes in pressure or viscosity.
Swing Trading: Leveraging the smoothed flow line to capture medium-term market swings, entering when flow aligns with the desired trade direction and exiting when flow weakens or reverses.
Intraday Scalping: Using shorter lookback periods and higher sensitivity to identify quick shifts in flow and turbulence for short-term trading opportunities, particularly in liquid markets.
⚠️ Limitations
Lagging Nature: Like many indicators based on moving averages and lookback periods, the main flow line can lag behind rapid price changes, potentially leading to delayed signals.
Whipsaws in Ranging Markets: During periods of low volatility or sideways price action (high viscosity, low flow strength), the indicator might produce frequent buy/sell signals (whipsaws) as the flow oscillates around the zero line.
Not a Standalone System: While comprehensive, it should be used in conjunction with other forms of analysis (e.g., price action, support/resistance levels, other indicators) and not as a sole basis for trading decisions.
Subjectivity in Interpretation: While the dashboard provides quantitative values, the interpretation of “strong” flow, “high” turbulence, or “significant” acceleration can still have a subjective element depending on the trader’s strategy and risk tolerance.
💡 What Makes This Unique
Fluid Dynamics Analogy: Its core strength lies in translating complex market interactions into an intuitive fluid dynamics framework, making concepts like momentum, resistance, and pressure easier to visualize and understand.
Market View: Instead of focusing on a single aspect (like just momentum or just volatility), it integrates multiple factors (velocity, viscosity, pressure, turbulence) to provide a more comprehensive picture of market conditions.
Adaptive Visualization: The dynamic coloring of the flow line and the turbulence background provide immediate, adaptive visual feedback that changes with market conditions.
🔬 How It Works
Price Velocity Calculation: The indicator first calculates price velocity by measuring the rate of change of the closing price over a given ‘lookback’ period. The raw velocity is then normalized by the Average True Range (ATR) of the same lookback period. Normalization enables comparison of momentum between assets or timeframes by scaling for volatility. This is the direction and speed of initial price movement.
Viscosity Calculation: Market ‘viscosity’ or resistance to price movement is determined by looking at the current ATR relative to its longer-term average (SMA of ATR over lookback * 2). The further the current ATR is above its average, the lower the viscosity (less resistance to price movement), and vice-versa. The script inverts this relationship and bounds it so that rising viscosity means more resistance.
Pressure Force Measurement: A ‘pressure’ variable is calculated as a function of the ratio of current volume to its simple moving average, multiplied by the price range (close - open) and normalized by ATR. This is designed to measure the force behind price movement created by volume and intraday price thrusts. This pressure is smoothed by an EMA.
Turbulence State Evaluation: A equivalent ‘Reynolds number’ is calculated by dividing the absolute normalized velocity by the viscosity. This is the proclivity of the market to move in a chaotic or orderly fashion. This ‘reynoldsValue’ is smoothed with an EMA to get the ‘turbulenceState’, which indicates if the market is laminar (stable), transitional, or turbulent.
Main Flow Derivation: The ‘rawFlow’ is calculated by taking the normalized velocity, dampening its impact based on the ‘viscosity’ and user-input ‘sensitivity’, and orienting it by the sign of the smoothed ‘pressureSmooth’. The ‘rawFlow’ is then put through multiple layers of exponential moving average (EMA) smoothing (with ‘smoothingLength’ and derived values) to reach the final ‘mainFlow’ line. The extensive smoothing is designed to give a smooth and clear visualization of the overall market direction and magnitude.
Dashboard Metrics Compilation: Additional metrics like flow acceleration (derivative of mainFlow), and flow continuity (correlation between close and volume) are calculated. All primary components (Flow State, Strength, Viscosity, Turbulence, Pressure, Acceleration, Continuity) are then presented in a user-configurable dashboard for ease of monitoring.
💡 Note:
The “Market Fluid Dynamics - Phen” indicator is designed to offer a unique perspective on market behavior by applying principles from fluid dynamics. It’s most effective when used to understand the underlying forces driving price rather than as a direct buy/sell signal generator in isolation. Experiment with the settings, particularly the ‘Base Lookback Period’, ‘Flow Sensitivity’, and ‘Flow Smoothing’, to find what best suits your trading style and the specific asset you are analyzing. Always combine its insights with robust risk management practices.

Filt ADR🟠 Script Name: Filtered Average Daily Range (Filt ADR)
This script calculates a filtered version of the Average Daily Range (ADR) based on the last 14 daily candles. It's designed to reduce the influence of unusually high or low daily ranges (outliers) by applying a filter before calculating the average.
🔧 How It Works — Step by Step
1. Calculate Daily Ranges (High - Low)
It retrieves the daily price ranges (difference between daily high and low) for the last 14 days using request.security() with the "D" (daily) timeframe.
pinescript
Копировать
Редактировать
high - low // today's daily range
high - low // yesterday's daily range
...
These values are stored into individual variables dr0 to dr13.
2. Build an Array of Daily Ranges
An array named ranges is used to store the 14 daily ranges, but only if they are not na (missing data). This avoids errors during processing.
3. Calculate the Initial (Unfiltered) Average Range
The script sums all values in the ranges array and calculates their average:
pinescript
Копировать
Редактировать
avg_all = total sum of ranges / number of valid entries
4. Filter Out Outliers
Now it filters the values in ranges:
Only keeps the ranges that are between 0.5×avg_all and 2×avg_all.
This is to remove abnormally small or large daily ranges that could distort the average.
The filtered values are added to a second array called filtered.
5. Calculate the Filtered ADR
Finally, it calculates the average of the filtered daily ranges:
pinescript
Копировать
Редактировать
avg_filt = sum of filtered ranges / number of filtered values
This is the Filtered ADR.
6. Plot the Result
The result (avg_filt) is plotted as an orange line on the chart. It updates on each bar (depending on the current timeframe you're viewing) but the underlying data is based on the last 14 daily candles.
pinescript
Копировать
Редактировать
plot(avg_filt, title="Filtered ADR", color=color.orange, linewidth=2)
✅ Use Case
This script is useful for traders who use the Average Daily Range (ADR) to:
Estimate expected price movement during a day
Set volatility-based stop-loss or take-profit levels
Identify days with unusually high or low volatility
By filtering out extreme values, it provides a more stable and reliable estimate of daily volatility.

Killzones (UTC+3) by Roy⏰ Time-Based Division – Trading Quarters:
The trading day is divided into four main quarters, each reflecting distinct market behaviours:
Opo Finance Blog
Quarter Time (Israel Time) Description
Q1 16:30–18:30 Wall Street opening; highest volatility.
Q2 18:30–20:30 Continuation or correction of the opening move.
Q3 20:30–22:30 Quieter market; often characterized by consolidation.
Q4 22:30–24:00 Preparation for market close; potential breakouts or sharp movements.
This framework assists traders in anticipating market dynamics within each quarter, enhancing decision-making by aligning strategies with typical intraday patterns.

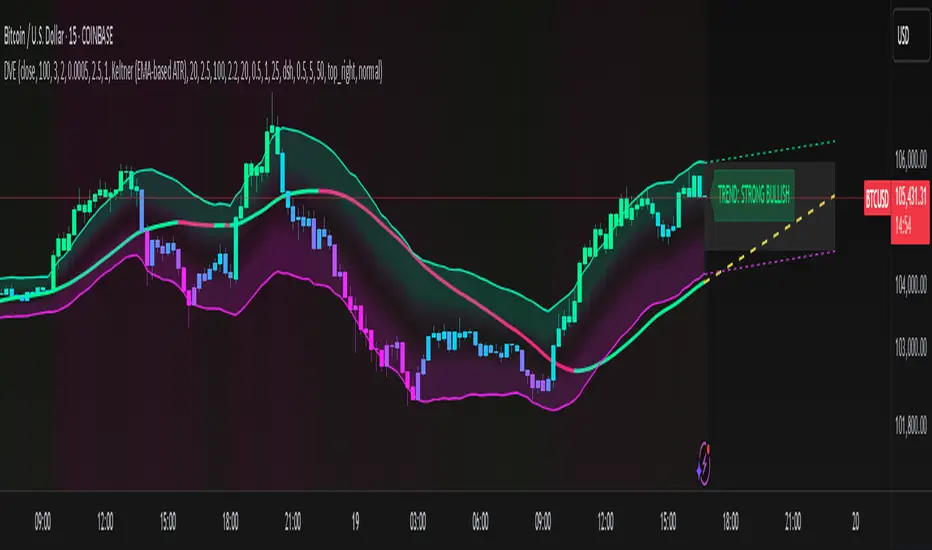
Dynamic Volatility EnvelopeDynamic Volatility Envelope: Indicator Overview
The Dynamic Volatility Envelope is an advanced, multi-faceted technical indicator designed to provide a comprehensive view of market trends, volatility, and potential future price movements. It centers around a customizable linear regression line, enveloped by dynamically adjusting volatility bands. The indicator offers rich visual feedback through gradient coloring, candle heatmaps, a background volatility pulse, and an on-chart trend strength meter.
Core Calculation Mechanism
Linear Regression Core :
-A central linear regression line is calculated based on a user-defined source (e.g., close, hl2) and lookback period.
-The regression line can be optionally smoothed using an Exponential Moving Average (EMA) to reduce noise.
-The slope of this regression line is continuously calculated to determine the current trend direction and strength.
Volatility Channel :
-Dynamic bands are plotted above and below a central basis line. This basis is typically the calculated regression line but shifts to an EMA in Keltner mode.
-The width of these bands is determined by market volatility, using one of three user-selectable modes:
ATR Mode : Bandwidth is a multiple of the Average True Range (ATR).
Standard Deviation Mode : Bandwidth is a multiple of the Standard Deviation of the source data.
Keltner Mode (EMA-based ATR) : ATR-based bands are plotted around a central Keltner EMA line, offering a smoother channel.
The channel helps identify dynamic support and resistance levels and assess market volatility.
Future Projection :
The indicator can project the current regression line and its associated volatility bands into the future for a user-defined number of bars. This provides a visual guide for potential future price pathways based on current trend and volatility characteristics.
Candle Heatmap Coloring :
-Candle bodies and/or wicks/borders can be colored based on the price's position within the upper and lower volatility bands.
-Colors transition in a gradient from bearish (when price is near the lower band) through neutral (mid-channel) to bullish (when price is near the upper band), providing an intuitive visual cue of price action relative to the dynamic envelope.
Background Volatility Pulse :
The chart background color can be set to dynamically shift based on a ratio of short-term to long-term ATR. This creates a "pulse" effect, where the background subtly changes color to indicate rising or falling market volatility.
Trend Strength Meter :
An on-chart text label displays the current trend status (e.g., "Strong Bullish", "Neutral", "Bearish") based on the calculated slope of the regression line relative to user-defined thresholds for normal and strong trends.
Key Features & Components
-Dynamic Linear Regression Line: Core trend indicator with optional smoothing and slope-based gradient coloring.
-Multi-Mode Volatility Channel: Choose between ATR, Standard Deviation, or Keltner (EMA-based ATR) calculations for band width.
-Customizable Vertical Gradient Channel Fills: Visually distinct fills for upper and lower channel segments with user-defined top/bottom colors and gradient spread.
-Future Projection: Extrapolates regression line and volatility bands to forecast potential price paths.
-Price-Action Based Candle Heatmap: Intuitive candle coloring based on position within the volatility channel, with adjustable gradient midpoint.
-Volatility-Reactive Background Gradient: Subtle background color shifts to reflect changes in market volatility.
-On-Chart Trend Strength Meter: Clear textual display of current trend direction and strength.
-Extensive Visual Customization: Fine-tune colors, line styles, widths, and gradient aggressiveness for most visual elements.
-Comprehensive Tooltips: Detailed explanations for every input setting, ensuring ease of use and understanding.
Visual Elements Explained
Regression Line : The primary trend line. Its color dynamically changes (e.g., green for uptrend, red-pink for downtrend, neutral for flat) based on its slope, with smooth gradient transitions.
Volatility Channel :
Upper & Lower Bands : These lines form the outer boundaries of the envelope, acting as dynamic support and resistance levels.
Channel Fill : The area between the band center and the outer bands is filled with a vertical gradient. For example, the upper band fill might transition from a darker green near the center to a lighter green at the upper band.
Band Borders : The lines outlining the upper and lower bands, with customizable color and width.
Future Projection Lines & Fill :
Projected Regression Line : An extension of the current regression line into the future, typically styled differently (e.g., dashed).
Projected Channel Bands : Extensions of the upper and lower volatility bands.
Projected Area Fill : A semi-transparent fill between the projected upper and lower bands.
Candle Heatmap Coloring : When enabled, candles are colored based on their closing price's relative position within the channel. Bullish colors appear when price is in the upper part of the channel, bearish in the lower, and neutral in the middle. Users can choose to color the entire candle body or just the wicks and borders.
Background Volatility Pulse : The chart's background color subtly shifts (e.g., between a calm green and an agitated red-pink) to reflect the current volatility regime.
Trend Strength Meter : A text label (e.g., "TREND: STRONG BULLISH") positioned on the chart, providing an at-a-glance summary of the trend.
Configuration Options
Users can tailor the indicator extensively via the settings panel, with options logically grouped:
Core Analysis Engine : Adjust regression source data, lookback period, and EMA smoothing for the regression line.
Regression Line Visuals : Control visibility, line width, trend-based colors (uptrend, downtrend, flat), slope thresholds for trend definition, strong slope multiplier (for Trend Meter), and color gradient sharpness.
Volatility Channel Configuration : Select band calculation mode (ATR, StdDev, Keltner), set relevant periods and multipliers. Customize colors for vertical gradient fills (upper/lower, top/bottom), border line colors, widths, and the gradient spread factor for fills.
Future Projection Configuration : Toggle visibility, set projection length (number of bars), line style, and colors for projected regression and band areas.
Appearance & Candle Theme : Set default bull/bear candle colors, enable/disable candle heatmap, choose if body color matches heatmap, and configure heatmap gradient target colors (bull, neutral, bear) and the gradient's midpoint.
Background Volatility Pulse : Enable/disable the background effect and configure short/long ATR periods for the volatility calculation.
Trend Strength Meter : Enable/disable the meter, and choose its on-chart position and text size.
Interpretation Notes
-The Regression Line is the primary indicator of trend direction. Its slope and color provide immediate insight.
-The Volatility Bands serve as dynamic support and resistance zones. Price approaching or touching these bands may indicate potential turning points or breakouts. The width of the channel itself reflects market volatility – widening suggests increasing volatility, while narrowing suggests consolidation.
Future Projections are not predictions but rather an extension of current conditions. They can help visualize potential areas where price might interact with projected support/resistance if the current trend and volatility persist.
Candle Heatmap Coloring offers a quick visual assessment of where price is trading within the dynamic envelope, highlighting strength or weakness relative to the channel.
The Background Volatility Pulse gives a contextual feel for overall market agitation or calmness.
This indicator is designed to be a comprehensive analytical tool. Its signals and visualizations are best used in conjunction with other technical analysis techniques, price action study, and robust risk management practices. It is not intended as a standalone trading system.
Risk Disclaimer
Trading and investing in financial markets involve substantial risk of loss and is not suitable for every investor. The Dynamic Volatility Envelope indicator is provided for analytical and educational purposes only and does not constitute financial advice or a recommendation to buy or sell any security. Past performance is not indicative of future results. Always use sound risk management practices and never trade with capital you cannot afford to lose. The developers assume no liability for any financial losses incurred based on the use of this indicator.
Polarity-VoVix Fusion Index (PVFI) Polarity-VoVix Fusion Index (PVFI) - Order Flow and Volatility Regime Detector
The PVFI is a next-generation indicator that fuses the Order Flow Polarity Index (OFPI) with a proprietary VoVix Volume Delta (VVD) engine. This tool is designed for traders who want to see not just how much volume is trading, but who is in control and how volatility is shifting beneath the surface.
What Makes PVFI Standout from the rest?
- Dual Engine: PVFI combines two advanced signals:
* OFPI: Measures real-time buy/sell pressure using candle body position and volume, then smooths it with a T3 moving average for clarity and responsiveness.
* VVD: Captures the "volatility of volume delta" - a normalized, memory-boosted measure of aggressive buying/selling, with a custom non-linear clamp for organic, non-pegged signals.
- Visual Clarity: Neon-glow OFPI line and shadowed, color-gradient VVD area make regime shifts and momentum instantly visible.
- Adaptive Dashboard: Toggle between a full-featured dashboard (desktop) and a compact info line (mobile) for seamless use on any device.
- Universal: Works on any asset - crypto, stocks, futures, forex - and any timeframe.
- No Chart Clutter: Clean, modern visuals and toggles for a pro look.
Inputs:
OFPI Lookback Length (ofpi_len): Sets the window for order flow pressure calculation. Shorter = more sensitive, longer = smoother. For scalping, try 5-10. For swing trading, 15-30. Crypto often benefits from shorter windows due to volatility.
OFPI T3 Smoothing Length (t3_len): Controls the smoothness of the OFPI line. Lower = more responsive, higher = smoother. Use 3-7 for fast markets, 8-15 for slow or higher timeframes.
OFPI T3 Volume Factor (t3_vf): Adjusts the T3’s sensitivity. Higher = more responsive, lower = more stable. 0.6-0.8 is typical. Raise for more “snappy” signals, lower for less noise.
VVD Delta Lookback (delta_len): Sets the window for VVD’s volume delta calculation. 10-20 for most assets. Shorter for high-volatility, longer for slow markets.
VVD Volatility Normalization Length (vol_norm_len): Normalizes VVD by recent volume. 15-30 is typical. Use higher for assets with wild volume swings.
VVD Momentum Memory (momentum_mem): Adds a “memory” boost to VVD, amplifying persistent buying/selling. 2-5 is common. Lower for choppy markets, higher for trending.
Show Dashboard (showDash): Toggles the full dashboard table (best for desktop). Turn off for a minimalist or mobile setup.
Show Compact Info Line (showInfoLabel): Toggles a single-line info label (best for mobile). Turn on for mobile or minimalist setups.
How PVFI Works:
- OFPI Calculation: Splits each candle’s volume into buy/sell pressure based on where the close is within the range. Aggregates over your chosen lookback, then smooths with a T3 moving average for a neon, lag-minimized signal.
- VVD Calculation: Measures the “aggression” of volume (body-weighted), normalizes by recent volume, and applies a memory boost for persistent trends. Uses a custom tanh clamp for a natural, non-pegged range.
- Visuals: OFPI is plotted as a neon line (with glow). VVD is a color-gradient area with a soft shadow, instantly showing regime shifts.
- Dashboard/Info Line: Desktop: Full dashboard with all key stats, color-coded and branded. Mobile: Compact info line with arrows for quick reads.
How you'll use PVFI:
- Bullish OFPI (Teal Neon, Up Arrow): Buyers are dominating. Look for breakouts, trend continuations, or confirmation with your own system.
- Bearish OFPI (Green Neon, Down Arrow): Sellers are in control. Watch for breakdowns or short setups.
- VVD Positive (Teal Area): Aggressive buying is increasing. Confirm with price action.
- VVD Negative (Purple Area): Aggressive selling is increasing. Use for risk management or short bias.
- Neutral/Flat: Market is balanced or indecisive. Consider waiting for a clear regime shift.
- Dashboard/Info Line: Use the dashboard for full context, or the info line for a quick glance on mobile.
Tips:
- For scalping, use lower lookbacks and smoothing.
- For swing trading, increase lookbacks and smoothing for stability.
- Works on all assets and timeframes - tune to your style.
Why PVFI is Unique:
- Fusion of Order Flow and Volatility: No other indicator combines body-based order flow with a volatility-of-volume delta, both visualized with modern, pro-grade graphics.
- Adaptive, Not Static: PVFI adapts to market regime, not just price movement.
- Mobile-Ready: Dashboard and info line toggles for any device.
- No Chart Clutter: Clean, color-coded, and easy to read.
For Educational Use Only
PVFI is a research and educational tool, not financial advice. Always use proper risk management and combine with your own strategy.
Trade with clarity. Trade with edge.
— Dskyz , for DAFE Trading Systems

UT Bot + Hull MA Confirmed Signal DelayOverview
This indicator is designed to detect high-probability reversal entry signals by combining "UT Bot Alerts" (UT Bot Alerts script adapted from QuantNomad - Originally developed by Yo_adriiiiaan and idea of original code for "UT Bot Alerts" from HPotter ) with confirmation from a Hull Moving Average (HMA) Developed by Alan Hull . It focuses on capturing momentum shifts that often precede trend reversals, helping traders identify potential entry points while filtering out false signals.
🔍 How It Works
This strategy operates in two stages:
1. UT Bot Momentum Trigger
The foundation of this script is the "UT Bot Alerts" , which uses an ATR-based trailing stop to detect momentum changes. Specifically:
The script calculates a dynamic stop level based on the Average True Range (ATR) multiplied by a user-defined sensitivity factor (Key Value).
When price closes above this trailing stop and the short-term EMA crosses above the stop, a potential buy setup is triggered.
Conversely, when price closes below the trailing stop and the short-term EMA crosses below, a potential sell setup is triggered.
These UT Bot alerts are designed to identify the initial shift in market direction, acting as the first filter in the signal process.
2. Hull MA Confirmation
To reduce noise and false triggers from the UT Bot alone, this script delays the entry signal until price confirms the move by crossing the Hull Moving Average (or its variants: HMA, THMA, EHMA) in the same direction as the UT Bot trigger:
A Buy Signal is generated only when:
A UT Bot Buy condition is active, and
The price closes above the Hull MA.
Or, if a UT Bot Buy condition was recently triggered but price hadn’t yet crossed above the Hull MA, a delayed buy is signaled when price finally breaks above it.
A Sell Signal is generated only when:
A UT Bot Sell condition is active, and
The price closes below the Hull MA.
Similarly, a delayed sell signal can occur if price breaks below the Hull MA shortly after a UT Bot Sell trigger.
This dual-confirmation process helps traders avoid premature entries and improves the reliability of reversal signals.
📈 Best Use Cases
Reversal Trading: This strategy is particularly well-suited for catching early trend reversals rather than trend continuations. It excels at identifying momentum pivots that occur after pullbacks or exhaustion moves.
Heikin Ashi Charts Recommended: The script offers a Heikin Ashi mode for smoothing out noise and enhancing visual clarity. Using Heikin Ashi candles can further reduce whipsaws and highlight cleaner shifts in trend direction.
MACD Alignment: For best results, trade in the direction of the MACD trend or use it as a filter to avoid counter-trend trades.
⚠️ Important Notes
Entry Signals Only: This indicator only plots entry points (Buy and Sell signals). It does not define exit strategies, so users should manage trades manually using trailing stops, profit targets, or other exit indicators.
No Signal = No Confirmation: You may see a UT Bot trigger without a corresponding Buy/Sell signal. This means the price did not confirm the move by crossing the Hull MA, and therefore the setup was considered too weak or incomplete.
⚙️ Customization
UT Bot Sensitivity: Adjust the “Key Value” and “ATR Period” to make the UT Bot more or less reactive to price action.
Use Heikin Ashi: Toggle between standard candles or Heikin Ashi in the indicator settings for a smoother trading experience.
The HMA length may also be modified in the indicator settings from its standard 55 length to increase or decrease the sensitivity of signal.
This strategy is best used by traders looking for a structured, logic-based way to enter early into reversals with added confirmation to reduce risk. By combining two independent systems—momentum detection (UT Bot) and trend confirmation (Hull MA)—it aims to provide high-confidence entries without overwhelming complexity.
Let the indicator guide your entries—you manage the exits.
Examples of use:
Futures:
Stock:
Crypto:
As shown in the snapshots this strategy, like most, works the best when price action has a sizeable ATR and works the least when price is choppy. Therefore it is always best to use this system when price is coming off known support or resistance levels and when it is seen to respect short term EMA's like the 9 or 15.
My personal preference to use this system is for day trading on a 3 or 5 minute chart. But it is valid for all timeframes and simply marks a high probability for a new trend to form.
Sources:
Quant Nomad - www.tradingview.com
Yo_adriiiiaan - www.tradingview.com
HPotter - www.tradingview.com
Hull Moving Average - alanhull.com

Circuit % Marker w/ Mirrored Arrows📈 Indian Market Circuit Limit Change Tracker
This indicator automatically tracks circuit limit changes (price bands) as applied in NSE/BSE stocks.
🧠 How It Works:
Start from a user-defined initial circuit limit (e.g. 10%)
If the upper or lower limit is hit, the script waits for a user-defined cooling period (e.g. 5 trading days)
After that, it automatically adjusts to the next lower or higher band (e.g. from 10% to 5%)
Shows a visual label with the current circuit % right on the chart — placed above or below candles for better visibility
🔧 Custom Inputs:
Starting Circuit % — choose between standard NSE/BSE values (20%, 10%, 5%, 2%)
Cooling Days — how many days must pass after a circuit hit before it’s allowed to change again
Label Positioning, Color, and Size — fully customizable to suit your chart style
🚫 No Clutter:
Doesn’t draw circuit limit lines
Just clean, small labels at key turning points — as seen in real trading dashboards
🔍 Notes:
NSE and BSE manually assign circuit bands — this script does not fetch live exchange data
Use it as a visual tracker and simulator of how circuit behavior would evolve under fixed rules
JPMorgan G7 Volatility IndexThe JPMorgan G7 Volatility Index: Scientific Analysis and Professional Applications
Introduction
The JPMorgan G7 Volatility Index (G7VOL) represents a sophisticated metric for monitoring currency market volatility across major developed economies. This indicator functions as an approximation of JPMorgan's proprietary volatility indices, providing traders and investors with a normalized measurement of cross-currency volatility conditions (Clark, 2019).
Theoretical Foundation
Currency volatility is fundamentally defined as "the statistical measure of the dispersion of returns for a given security or market index" (Hull, 2018, p.127). In the context of G7 currencies, this volatility measurement becomes particularly significant due to the economic importance of these nations, which collectively represent more than 50% of global nominal GDP (IMF, 2022).
According to Menkhoff et al. (2012, p.685), "currency volatility serves as a global risk factor that affects expected returns across different asset classes." This finding underscores the importance of monitoring G7 currency volatility as a proxy for global financial conditions.
Methodology
The G7VOL indicator employs a multi-step calculation process:
Individual volatility calculation for seven major currency pairs using standard deviation normalized by price (Lo, 2002)
- Weighted-average combination of these volatilities to form a composite index
- Normalization against historical bands to create a standardized scale
- Visual representation through dynamic coloring that reflects current market conditions
The mathematical foundation follows the volatility calculation methodology proposed by Bollerslev et al. (2018):
Volatility = σ(returns) / price × 100
Where σ represents standard deviation calculated over a specified timeframe, typically 20 periods as recommended by the Bank for International Settlements (BIS, 2020).
Professional Applications
Professional traders and institutional investors employ the G7VOL indicator in several key ways:
1. Risk Management Signaling
According to research by Adrian and Brunnermeier (2016), elevated currency volatility often precedes broader market stress. When the G7VOL breaches its high volatility threshold (typically 1.5 times the 100-period average), portfolio managers frequently reduce risk exposure across asset classes. As noted by Borio (2019, p.17), "currency volatility spikes have historically preceded equity market corrections by 2-7 trading days."
2. Counter-Cyclical Investment Strategy
Low G7 volatility periods (readings below the lower band) tend to coincide with what Shin (2017) describes as "risk-on" environments. Professional investors often use these signals to increase allocations to higher-beta assets and emerging markets. Campbell et al. (2021) found that G7 volatility in the lowest quintile historically preceded emerging market outperformance by an average of 3.7% over subsequent quarters.
3. Regime Identification
The normalized volatility framework enables identification of distinct market regimes:
- Readings above 1.0: Crisis/high volatility regime
- Readings between -0.5 and 0.5: Normal volatility regime
- Readings below -1.0: Unusually calm markets
According to Rey (2015), these regimes have significant implications for global monetary policy transmission mechanisms and cross-border capital flows.
Interpretation and Trading Applications
G7 currency volatility serves as a barometer for global financial conditions due to these currencies' centrality in international trade and reserve status. As noted by Gagnon and Ihrig (2021, p.423), "G7 currency volatility captures both trade-related uncertainty and broader financial market risk appetites."
Professional traders apply this indicator in multiple contexts:
- Leading indicator: Research from the Federal Reserve Board (Powell, 2020) suggests G7 volatility often leads VIX movements by 1-3 days, providing advance warning of broader market volatility.
- Correlation shifts: During periods of elevated G7 volatility, cross-asset correlations typically increase what Brunnermeier and Pedersen (2009) term "correlation breakdown during stress periods." This phenomenon informs portfolio diversification strategies.
- Carry trade timing: Currency carry strategies perform best during low volatility regimes as documented by Lustig et al. (2011). The G7VOL indicator provides objective thresholds for initiating or exiting such positions.
References
Adrian, T. and Brunnermeier, M.K. (2016) 'CoVaR', American Economic Review, 106(7), pp.1705-1741.
Bank for International Settlements (2020) Monitoring Volatility in Foreign Exchange Markets. BIS Quarterly Review, December 2020.
Bollerslev, T., Patton, A.J. and Quaedvlieg, R. (2018) 'Modeling and forecasting (un)reliable realized volatilities', Journal of Econometrics, 204(1), pp.112-130.
Borio, C. (2019) 'Monetary policy in the grip of a pincer movement', BIS Working Papers, No. 706.
Brunnermeier, M.K. and Pedersen, L.H. (2009) 'Market liquidity and funding liquidity', Review of Financial Studies, 22(6), pp.2201-2238.
Campbell, J.Y., Sunderam, A. and Viceira, L.M. (2021) 'Inflation Bets or Deflation Hedges? The Changing Risks of Nominal Bonds', Critical Finance Review, 10(2), pp.303-336.
Clark, J. (2019) 'Currency Volatility and Macro Fundamentals', JPMorgan Global FX Research Quarterly, Fall 2019.
Gagnon, J.E. and Ihrig, J. (2021) 'What drives foreign exchange markets?', International Finance, 24(3), pp.414-428.
Hull, J.C. (2018) Options, Futures, and Other Derivatives. 10th edn. London: Pearson.
International Monetary Fund (2022) World Economic Outlook Database. Washington, DC: IMF.
Lo, A.W. (2002) 'The statistics of Sharpe ratios', Financial Analysts Journal, 58(4), pp.36-52.
Lustig, H., Roussanov, N. and Verdelhan, A. (2011) 'Common risk factors in currency markets', Review of Financial Studies, 24(11), pp.3731-3777.
Menkhoff, L., Sarno, L., Schmeling, M. and Schrimpf, A. (2012) 'Carry trades and global foreign exchange volatility', Journal of Finance, 67(2), pp.681-718.
Powell, J. (2020) Monetary Policy and Price Stability. Speech at Jackson Hole Economic Symposium, August 27, 2020.
Rey, H. (2015) 'Dilemma not trilemma: The global financial cycle and monetary policy independence', NBER Working Paper No. 21162.
Shin, H.S. (2017) 'The bank/capital markets nexus goes global', Bank for International Settlements Speech, January 15, 2017.
