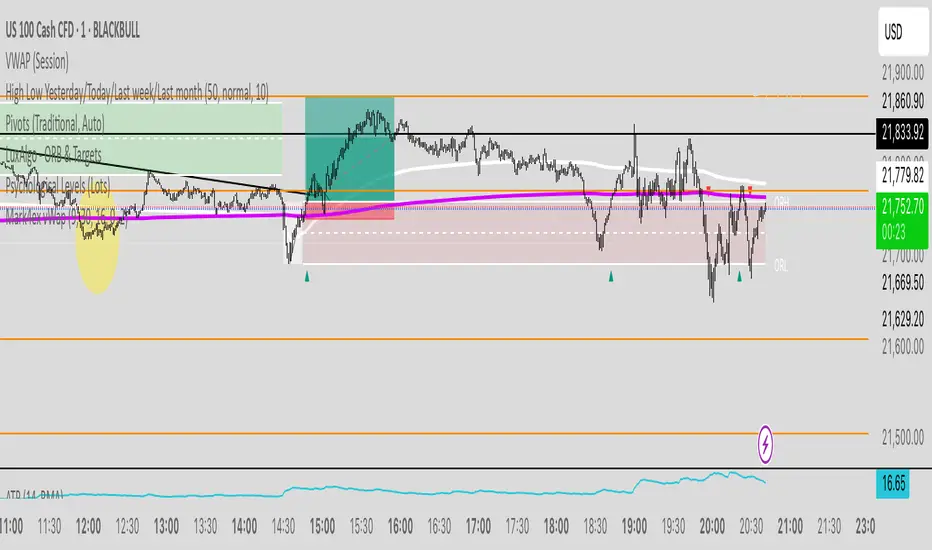
Fibo_Ma with Toggleable 200 EMA Filter Fibo_MA with Toggleable 200 EMA Filter
Description:
This multi-functional indicator blends Fibonacci-based moving averages with customizable filters and visual enhancements to support various trading strategies. It offers traders the flexibility to analyze trend dynamics and potential reversal zones using multiple tools in one script.
Key Features:
🔹 Fibonacci MA Framework
Leverage a range of Fibonacci numbers (from 1 to 233) to visualize trend-based EMA lines with optional smoothing. Users can choose the moving average method (SMA, EMA, RMA, WMA, VWMA, etc.) and adjust the smoothing length for fine-tuned analysis.
🔹 VWAP and Dynamic EMA Tools
Includes VWAP and a color-coded 200 EMA that updates based on trend slope. These help visualize key dynamic support and resistance levels.
🔹 Multi-Timeframe Support
Option to switch the data source to a higher timeframe for broader trend confirmation.
🔹 Signal Highlights
Bullish and bearish signal markers based on crossovers with optional filters.
Background highlights show whether the current price is above or below a smoothed EMA line.
🔹 Customizable Filters
Enable or disable filters like:
200 EMA Position Filter (only signal when price is above or below the 200 EMA)
ATR Filter (filter out low-volatility candles)
Volume Filter (signal only on sufficient volume)
🔹 Cross Alerts & Labels
Built-in alert conditions for crossovers and customizable signal display options—labels, shapes, and background highlights.
🔹 Advanced Options
Toggle forecast line visibility and offset
Fine-tune alerts using price action relative to the smooth trend line
Optional tail and cross label display for deeper chart customization
How to Use:
This tool can support trend-following, breakout, and pullback strategies. Customize the MA types, filters, and timeframe settings to match your trading style. The script is designed for visual clarity while offering rich configurability for discretionary and system-based traders.
Volume

LTF Volume markerLTF Volume Marker
Overview:
The LTF Volume Marker highlights candles that contain volume spikes on a lower timeframe (LTF), even while you are viewing a higher timeframe chart. It is designed to help identify hidden volume activity that may not be visible when aggregating candles.
This indicator is conceptually similar to a volume profile — but instead of showing distribution across price levels, it visualizes volume clusters within the structure of a sloped trend or time-based aggregation.
Key Features:
✅ Automatically detects high-volume candles on a user-defined lower timeframe
✅ Marks the price level of volume spikes using weighted average price (VWAP) within higher timeframe bars
✅ Supports both manual threshold and auto mode (which highlights top X% of volume candles in a selected range)
✅ Fully adjustable timeframe and date range
✅ Displays either a point or an area at the spike location or together
How It Works:
You define a Lower Timeframe (e.g. 1-minute) and optionally a threshold or use the auto mode to dynamically calculate it from past data.
On higher timeframes (e.g. 5-min, 15-min), the indicator looks inside each bar, finds all volume spikes, and plots the volume-weighted average price of those spikes.
If you are on the same timeframe as the LTF, it simply highlights candles with volume exceeding the threshold.
Use Cases:
Spotting hidden volume clusters inside trending moves
Validating support/resistance levels with underlying volume
Filtering false breakouts using intra-bar volume
Enhancing scalping and intraday setups by visualizing internal structure
Notes:
The indicator ignores future-looking data (lookahead=off) and only processes completed bars.
If the chart’s timeframe is lower than the selected LTF, the indicator will automatically disable itself.
Works best with aggregated symbols, such as futures or cryptocurrencies with high resolution data.

Z-Score Volume with CVD ConfirmationZ-Score Volume with CVD Confirmation is a volume-based confluence tool that enhances traditional volume analysis by combining Z-Score volume anomalies with Cumulative Volume Delta (CVD) confirmation. This indicator helps traders identify unusual volume activity that aligns with directional order flow, offering a cleaner signal for potential breakout or reversal scenarios.
🔍 Key Features:
Z-Score Calculation: Measures how extreme current volume is relative to its recent average, highlighting statistically significant surges or drops.
CVD Confirmation: Uses Cumulative Volume Delta candles (open/high/low/close) to assess buying vs. selling pressure in lower timeframes.
Bar Color Logic:
Green: High Z-Score volume confirmed by CVD bullish candle
Red: High Z-Score volume confirmed by CVD bearish candle
Other color bands show progressively strong or weak volume outliers
Real Volume Bar Heights: Volume bars retain true scale while color reflects underlying order flow strength and direction.
💡 Use Cases:
Breakout validation: Confirm price range breaks when volume surge is supported by CVD direction
Fade setups: Detect unsustainable high-volume moves lacking CVD support
Trend continuation: Spot momentum when both Z-Score and CVD align in the direction of the trend
⚙️ How to Use:
Adjust the Z-Score length to define how far back to measure average and deviation.
Select your anchor timeframe (typically 1D) and a lower timeframe for CVD calculations (e.g., 1-minute).
Use color-coded volume bars to assess volume significance and directional flow at a glance.
Add the standard volume indicator to the chart so one can compare the difference between the standard volume indicator and the Z-Score Volume with CVD Confirmation script. Useful at specific price levels and exiting ranges or not.

Manual VAH/VAL LevelsManual VAH/VAL Levels is a utility indicator that lets traders manually display the Value Area High (VAH) and Value Area Low (VAL) from the prior trading day, based on a Fixed Range Volume Profile tool.
This script is designed to:
Draw horizontal lines at the manually input VAH and VAL levels
Label each line with the corresponding price, aligned clearly to the right of the chart
Display levels only during the regular trading session for focused market context
Maintain a clean chart appearance with transparent label backgrounds
💡 How to Use:
Apply TradingView's Fixed Range Volume Profile tool to the prior day's session
Manually enter the VAH and VAL values into the script settings
The script will draw and label these levels dynamically during the NY market session
This tool is ideal for:
Traders using volume-based key levels for intraday decision-making
Contextualizing price action near areas of prior day value
Confluence analysis when paired with opening range, CVD, or breakout systems

Squeeze & Breakout Confirmation StrategyThis strategy focuses on identifying periods of low volatility (Bollinger Band Squeeze) and then confirming the direction of the subsequent breakout with momentum, volume, and candle strength.
Concepts Applied: Bollinger Bands (Squeeze), RSI (Momentum), Market Volume (Conviction), Candle Size (Strength)
Buy Signal:
Bollinger Band Squeeze: Look for a period where the Bollinger Bands contract significantly, indicating low volatility and consolidation. The bands should be very close to the price action.
RSI Breakout: After the squeeze, wait for the price to break decisively above the upper Bollinger Band. Simultaneously, the RSI should break above 60 (or even 70), indicating strong bullish momentum.
Volume Surge: The breakout candle should be accompanied by a significant increase in trading volume, ideally above its recent average, confirming strong buying interest.
Strong Bullish Candle: The breakout candle itself should be a large, bullish candle (e.g., a strong green candle with a small upper wick or a bullish engulfing pattern), demonstrating buyer conviction.
Sell Signal (Short):
Bollinger Band Squeeze: Look for a period where the Bollinger Bands contract significantly.
RSI Breakdown: After the squeeze, wait for the price to break decisively below the lower Bollinger Band. Simultaneously, the RSI should break below 40 (or even 30), indicating strong bearish momentum.
Volume Surge: The breakdown candle should be accompanied by a significant increase in trading volume, ideally above its recent average, confirming strong selling interest.
Strong Bearish Candle: The breakdown candle itself should be a large, bearish candle (e.g., a strong red candle with a small lower wick or a bearish engulfing pattern), demonstrating seller conviction.

BTC Transaction Indicator Name: "Bitcoin On-Chain Volume & Dynamic Parabolic Curve Signals"
Purpose:
This indicator is designed for Bitcoin traders and long-term holders. It combines the analysis of Bitcoin's on-chain transaction volume with price action to generate "Whale" and "Bear" signals. Additionally, it features a unique dynamic parabolic curve that acts as a visual support line, adapting its visibility based on price interaction with a key Exponential Moving Average (EMA).
Key Components:
On-Chain Volume Analysis:
Utilizes Estimated Transaction Volume (ETRAV) data from the Bitcoin blockchain.
Calculates fast and slow Simple Moving Averages (SMAs) of this volume.
Identifies volume trends (up/down) and significant volume increases/decreases.
Employs fixed thresholds (2,500,000 for low volume and 25,000,000 for high volume) to define key activity levels, similar to how historical on-chain analysis defined accumulation and distribution zones.
Price Action Analysis:
Calculates fast and slow SMAs of the price.
Detects price trends (up/down), recoveries, and declines based on these price SMAs.
"Whale" and "Bear" Signals:
Whale Signals (Buy-side): Generated when there's an upward volume trend, significant volume increase, and a downward price trend followed by price recovery. These indicate potential accumulation phases.
Bear Signals (Sell-side): Generated when there's a downward volume trend, significant volume decrease, and an upward price trend followed by price decline. These indicate potential distribution phases.
Visuals: Both types of signals are plotted as small, colored circles directly on the price chart, with corresponding text labels ("Whale," "Buy," "Bear," "Sell," "Price Recovering," "Price Declining").
Dynamic Parabolic Curve:
Concept: A green parabolic (exponential) curve that serves as a dynamic visual support line.
Activation: The curve starts drawing automatically only when the price crosses over the EMA 500 (Exponential Moving Average of 500 periods). The curve's starting point is set at a user-defined percentage below the EMA 500 value at that exact crossover point.
Visibility: The curve remains visible and continues its trajectory only as long as the price stays above the EMA 500.
Deactivation: The curve disappears instantly if the price falls below or equals the EMA 500. It will only reappear if the price crosses above the EMA 500 again.
Customization: The curve's steepness (Tasa Crecimiento Curva) and its initial distance from the EMA 500 (Inicio Curva % por debajo de EMA500) are adjustable.
Dynamic Label: A "Parabólico" text label is plotted near the center of the active curve segment, with an adjustable vertical offset to ensure it stays visually appealing below the curve.
What is PLOTTED on the chart:
The small, colored circle signals for Whale/Buy and Bear/Sell activity.
The green dynamic parabolic curve.
What is NOT PLOTTED:
EMA 200, EMA 500 lines (though they are calculated internally for logic).
Raw volume data or volume Moving Averages (these are only used for signal calculation, not plotted).
Ideal for:
Bitcoin traders and investors focused on long-term trends and cycle analysis, who want visual cues for accumulation/distribution phases based on on-chain activity, complemented by a unique, dynamically appearing parabolic support curve.
Important Notes:
Relies on the availability of external on-chain data (QUANDL:BCHAIN) within TradingView.
Functions best on a daily timeframe for optimal on-chain data relevance.

CirclesCircles - Support & Resistance Levels
Overview
This indicator plots horizontal support and resistance levels based on W.D. Gann's mathematical approach of dividing 360 degrees by 2 and by 3. These divisions create natural price magnetism points that have historically acted as significant support and resistance levels across all markets and timeframes.
How It Works
360÷2 Levels (Blue): 5.63, 11.25, 33.75, 56.25, 78.75, etc.
360÷3 Levels (Red): 7.5, 15, 30, 37.5, 52.5, 60, 75, etc.
Both Levels (Yellow): 22.5, 45, 67.5, 90, 112.5, 135, 157.5, 180 - These are "doubly strong" as they appear in both calculations
Key Features
Auto-Scaling: Automatically adjusts for any price range (from $0.001 altcoins to $100K+ Bitcoin)
Manual Scaling: Choose from 0.001x to 1000x multipliers or set custom values
Full Customization: Colors, line widths, styles (solid/dashed/dotted)
Historical View: Option to show all levels regardless of current price
Clean Display: Adjustable label positioning and line extensions
Use Cases
Identify potential reversal zones before price reaches them
Set profit targets and stop losses at key mathematical levels
Confirm breakouts when price decisively moves through major levels
Works on all timeframes and all markets (stocks, crypto, forex, commodities)
Gann Theory
W.D. Gann believed that markets move in mathematical harmony based on geometric angles and time cycles. These 360-degree divisions represent natural balance points where price often finds support or resistance, making them valuable for both short-term trading and long-term analysis.
Perfect for traders who use:
Support/Resistance trading
Fibonacci levels
Pivot points
Mathematical/geometric analysis
Multi-timeframe analysis

Out of the Noise Intraday Strategy with VWAP [YuL]This is my (naive) implementation of "Beat the Market An Effective Intraday Momentum Strategy for S&P500 ETF (SPY)" paper by Carlo Zarattini, Andrew Aziz, Andrea Barbon, so the credit goes to them.
It is supposed to run on SPY on 30-minute timeframe, there may be issues on other timeframes.
I've used settings that were used by the authors in the original paper to keep it close to the publication, but I understand that they are very aggressive and probably shouldn't be used like that.
Results are good, but not as good as they are stated in the paper (unsurprisingly?): returns are smaller and Sharpe is very low (which is actually weird given the returns and drawdown ratio), there are also margin calls if you enable margin check (and you should).
I have my own ideas of improvements which I will probably implement separately to keep this clean.

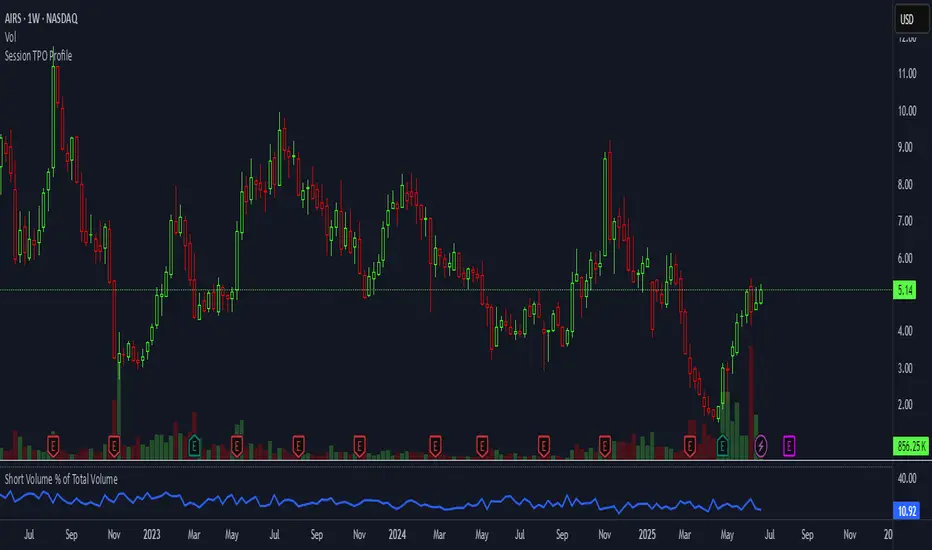
Short Volume % of Total VolumeShort Volume % of Total Volume
This indicator plots the daily short volume as a percentage of total volume for a specific U.S. stock. The short volume is sourced from FINRA’s reported short sale data and is compared against the stock’s total trading volume for the same day.
📊 Use Cases:
Monitor short-selling pressure over time.
Identify spikes in short volume % that may signal increased bearish positioning.
Use in conjunction with price action to gauge sentiment shifts or potential short squeezes.
⚠️ Note: FINRA data reflects activity from FINRA-regulated trading venues only and may not represent full market-wide short activity.
Rolling VWAP LevelsRolling VWAP Levels Indicator
Overview
Dynamic horizontal lines showing rolling Volume Weighted Average Price (VWAP) levels for multiple timeframes (7D, 30D, 90D, 365D) that update in real-time as new bars form.
Who This Is For
Day traders using VWAP as support/resistance
Swing traders analyzing multi-timeframe price structure
Scalpers looking for mean reversion entries
Options traders needing volatility bands for strike selection
Institutional traders tracking volume-weighted fair value
Risk managers requiring dynamic stop levels
How To Trade With It
Mean Reversion Strategies:
Buy when price is below VWAP and showing bullish divergence
Sell when price is above VWAP and showing bearish signals
Use multiple timeframes - enter on shorter, confirm on longer
Target opposite VWAP level for profit taking
Breakout Trading:
Watch for price breaking above/below key VWAP levels with volume
Use 7D VWAP for intraday breakouts
Use 30D/90D VWAP for swing trade breakouts
Confirm breakout with move beyond first standard deviation band
Support/Resistance Trading:
VWAP levels act as dynamic support in uptrends
VWAP levels act as dynamic resistance in downtrends
Multiple timeframe VWAP confluence creates stronger levels
Use standard deviation bands as additional S/R zones
Risk Management:
Place stops beyond next VWAP level
Use standard deviation bands for position sizing
Exit partial positions at VWAP levels
Monitor distance table for overextended moves
Key Features
Real-time Updates: Lines move and extend as new bars form
Individual Styling: Custom colors, widths, styles for each timeframe
Standard Deviation Bands: Optional volatility bands with custom multipliers
Smart Labels: Positioned above, below, or diagonally relative to lines
Distance Table: Shows percentage distance from each VWAP level
Alert System: Get notified when price crosses VWAP levels
Memory Efficient: Automatically cleans up old drawing objects
Settings Explained
Display Group: Show/hide labels, font size, line transparency, positioning
Individual VWAP Groups: Color, line width (1-5), line style for each timeframe
Standard Deviation Bands: Enable bands with custom multipliers (0.5, 1.0, 1.5, 2.0, etc.)
Labels Group: Position (8 options including diagonal), custom text, price display
Additional Info: Distance table, alert conditions
Technical Implementation
Uses rolling arrays to maintain sliding windows of price*volume data. The core calculation function processes both VWAP and standard deviation efficiently. Lines are created dynamically and updated every bar. Memory management prevents object accumulation through automatic cleanup.
Best Practices
Start with 7D and 30D VWAP for most strategies
Add 90D/365D for longer-term context
Use standard deviation bands when volatility matters
Position labels to avoid chart clutter
Enable distance table during high volatility periods
Set alerts for key VWAP level breaks
Market Applications
Forex: Major pairs during London/NY sessions
Stocks: Large cap names with good volume
Crypto: Bitcoin, Ethereum, major altcoins
Futures: ES, NQ, CL, GC with continuous volume
Options: Use SD bands for strike selection and volatility assessment

LVN/HVN Auto Detection [PhenLabs]📊 PhenLabs - LVN/HVN Auto Detection
Version: PineScript™ v6
📌 Description
The PhenLabs LVN/HVN Auto Detection indicator is an advanced volume profile analysis tool that automatically identifies Low Volume Nodes (LVN) and High Volume Nodes (HVN) across multiple trading sessions. This sophisticated indicator analyzes volume distribution patterns to pinpoint critical support and resistance levels where price is likely to react, providing traders with high-probability zones for entries, exits, and risk management.
Unlike traditional volume indicators that only show current activity, this tool builds comprehensive volume profiles from historical sessions and intelligently filters the most significant levels. It combines real-time volume analysis with dynamic level detection, offering both visual bubbles for immediate volume activity and persistent horizontal lines that act as ongoing support/resistance references.
🚀 Points of Innovation
Multi-Session Volume Profile Analysis - Automatically calculates and analyzes volume profiles across the last 5 trading sessions
Intelligent Level Separation Logic - Prevents overlapping signals by maintaining minimum separation between LVN and HVN levels
Dynamic Timeframe Adaptation - Automatically adjusts session lengths based on chart timeframe for optimal level detection
Real-Time Activity Bubbles - Shows volume activity strength through different bubble sizes at key levels
Persistent Line Management - Creates horizontal lines that extend until price crosses them, providing ongoing reference points
Dual Threshold System - Independent percentage-based thresholds for both LVN and HVN identification
🔧 Core Components
Volume Profile Engine : Builds 20-row volume profiles for each analyzed session, distributing volume across price levels
Level Identification Algorithm : Uses percentage-based thresholds to classify volume distribution patterns
Separation Logic : Ensures minimum distance between conflicting levels, prioritizing HVN when overlap occurs
Line Management System : Tracks active support/resistance lines and removes them when price crosses through
Volume Activity Monitor : Compares current volume to 13-period moving average for activity classification
🔥 Key Features
Customizable Thresholds : LVN threshold (5-35%, default 20%) and HVN threshold (65-95%, default 80%) for precise level filtering
Volume Activity Multiplier : Adjustable volume threshold (0.5+, default 1.5) for bubble and line creation sensitivity
Flexible Display Modes : Choose between Lines only, Bubbles only, or Both for optimal chart clarity
Smart Level Separation : Minimum separation percentage (0.1-2%, default 0.5%) prevents conflicting signals
Color Customization : Independent color controls for LVN (red) and HVN (blue) elements
Performance Optimization : Processes every 15 bars with maximum 500 active lines for smooth operation
🎨 Visualization
Colored Bubbles : Three sizes (large, medium, small) indicate volume activity strength at key levels
Horizontal Lines : Persistent support/resistance lines with width corresponding to volume activity
Dual Color System : Semi-transparent red for LVN areas, semi-transparent blue for HVN zones
Information Tooltip : Optional table showing usage guidelines and optimization tips
📖 Usage Guidelines
Volume Thresholds
LVN Threshold
○ Default: 20.0%
○ Range: 5.0-35.0%
○ Description: Price levels with volume below this percentage are marked as LVNs. Lower values create fewer, more significant levels. Typical range 15-25% works for most instruments.
HVN Threshold
○ Default: 80.0%
○ Range: 65.0-95.0%
○ Description: Price levels with volume above this percentage are marked as HVNs. Higher values create fewer, stronger levels. Range 75-85% is optimal for most trading.
Display Controls
Volume Threshold
○ Default: 1.5
○ Range: 0.5+
○ Description: Multiplier for volume significance (High=2+threshold, Medium=1+threshold, Low=0+threshold). Higher values require more volume for signals.
✅ Best Use Cases
Swing Trading : Identify key levels for position entries and exits over multiple days
Scalping : Use bubbles for immediate volume activity confirmation at critical levels
Risk Management : Place stops beyond LVN levels where price moves quickly
Breakout Trading : Monitor HVN levels for potential breakout or rejection scenarios
Multi-Timeframe Analysis : Combine with higher timeframe levels for confluence
⚠️ Limitations
Timeframe Sensitivity : Lower timeframes may produce too many levels; higher timeframes recommended for cleaner signals
Volume Data Dependency : Accuracy depends on reliable volume data from your data provider
Historical Analysis : Uses past volume data which may not predict future price behavior
Performance Impact : High number of active lines may affect chart performance on slower devices
💡 What Makes This Unique
Automated Session Analysis : No manual drawing required - automatically analyzes multiple sessions
Intelligent Filtering : Advanced separation logic prevents overlapping and conflicting signals
Adaptive Processing : Adjusts to different timeframes automatically for optimal level detection
Dual Visualization System : Combines persistent lines with real-time activity indicators
🔬 How It Works
1. Volume Profile Construction :
Analyzes the last 5 trading sessions with dynamic session length based on timeframe
Divides each session’s price range into 20 equal levels for volume distribution analysis
2. Level Classification :
Calculates volume percentage at each price level relative to session maximum
Identifies LVN levels below threshold and HVN levels above threshold
3. Signal Generation :
Creates bubbles when volume activity exceeds thresholds at identified levels
Draws horizontal lines that persist until price crosses through them
💡 Note : For optimal results, increase your chart timeframe if you see too many levels. The indicator performs best on 15-minute and higher timeframes where volume patterns are more meaningful and less noisy.

US30 Stealth StrategyOnly works on US30 (CAPITALCOM) 5 Minute chart
📈 Core Concept:
This is a trend-following strategy that captures strong market continuations by entering on:
The 3rd swing in the current trend,
Confirmed by a volume-verified engulfing candle,
With adaptive SL/TP and position sizing based on risk.
🧠 Entry Logic:
✅ Trend Filter
Uses a 50-period Simple Moving Average (SMA).
Buy only if price is above SMA → Uptrend
Sell only if price is below SMA → Downtrend
✅ Swing Count Logic
For buy: Wait for the 3rd higher low
For sell: Wait for the 3rd lower high
Uses a 5-bar lookback to detect highs/lows
This ensures you’re not buying early — but after trend is confirmed with structure.
✅ Engulfing Candle Confirmation
Bullish engulfing for buys
Bearish engulfing for sells
Candle must engulf previous bar completely (body logic)
✅ Volume Filter
Current candle volume must be greater than the 20-period volume average
Ensures trades only occur with institutional participation
✅ MA Slope Filter
Requires the slope of the 50 SMA over the last 3 candles to exceed 0.1
Avoids chop or flat trends
Adds momentum confirmation to the trade
✅ Session Filter (Time Filter)
Trades only executed between:
2:00 AM to 11:00 PM Oman Time (UTC+4)
Helps avoid overnight chop and illiquidity
📊 Position Sizing & Risk Management
✅ Smart SL (Adaptive Stop Loss)
SL is based on full size of the signal candle (including wick)
But if candle is larger than 25 points, SL is cut to half the size
This prevents oversized risk from long signals during volatile moves.

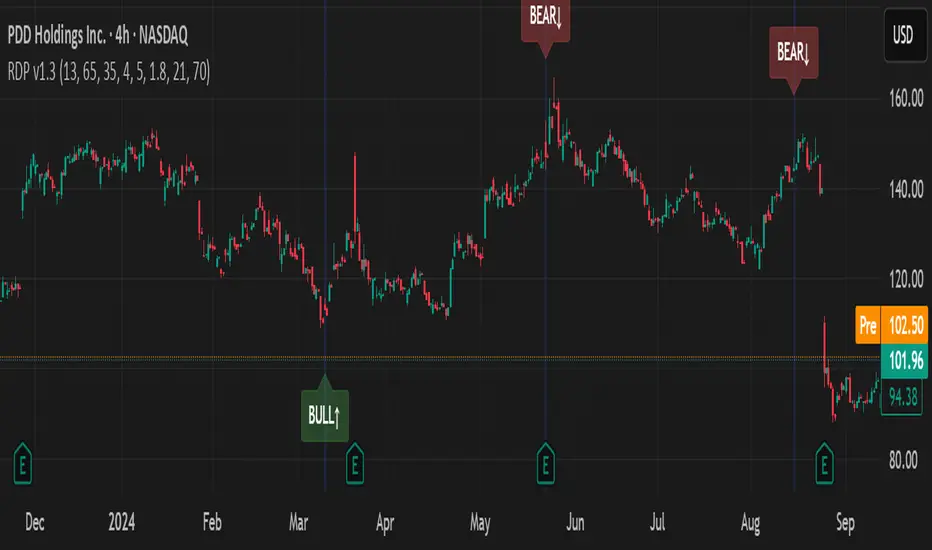
RSI Divergence Pro+ VolumeRSI Divergence Pro+ Volume
What It Does:
RSI Divergence Pro+ Volume is a non-repainting indicator that helps traders spot potential bullish and bearish reversal zones using a classic technical analysis concept—RSI divergence—combined with advanced volume confirmation. The script highlights moments when price and RSI disagree, filtering for signals only when there is a significant volume spike, which helps reduce false positives in quiet or illiquid markets.
How It Works:
Bullish Divergence: Triggered when price makes a lower low but RSI forms a higher low, suggesting possible exhaustion in selling pressure.
Bearish Divergence: Triggered when price makes a higher high but RSI forms a lower high, signaling potential buying exhaustion.
Volume Confirmation: Signals only appear when trading volume exceeds a dynamic threshold (based on a user-defined moving average and multiplier), making alerts more reliable.
Visual Features: Customizable labels and optional gradient highlights mark the exact bars where divergence with volume confirmation occurs, making signals easy to see.
Alert System: Built-in alerts for both bullish and bearish divergences so traders can receive instant notifications.
How to Use:
Apply the script to any timeframe or liquid asset (15m–4H recommended for best results).
Watch for green “BULL↑” labels below bars (bullish divergence) and red “BEAR↓” labels above bars (bearish divergence).
Blue/violet background highlights confirm volume-verified signals.
Combine with your own risk management and confirmation tools for trade entries/exits.
Adjust lookback and volume settings to match your asset and style.
Originality & Usefulness:
This indicator stands out by combining traditional RSI divergence with advanced volume filtering, giving more credible and actionable reversal alerts. All logic is non-repainting and calculated on closed bars only. Settings are fully grouped and customizable, with professional visuals for clarity.
Limitations & Disclaimers:
Not every divergence results in a major reversal—use with other analysis.
More effective in trending or volatile markets; may produce more false signals in choppy/range conditions.
Signals are generated on bar close and do not repaint.
No indicator is a substitute for proper trading discipline and risk management.
80% Rule Indicator (ETH Session + SVP Prior Session)I created this script to show the 80% opportunity on chart if setting lines up.
"80% rule: Open outside the vah or Val. Spend 30 mins outside there then break back inside spend 15 mins below or above depending which way u broke. Then come back and retest the vah/val and take it to the poc as a first target with the final target being the other Val/vah "
📌 Script Summary
The "80% Rule Indicator (ETH Session + SVP Prior Session)" overlays your chart with prior session value area levels (VAH, VAL, and POC) calculated from extended-hours 30-minute data. It tracks when the price reenters the value area and confirms 80% Rule setups during your chosen trading session. You can optionally trigger alerts, show/hide market sessions, and fine-tune line appearance for a clean, modular workflow.
⚙️ Options & Settings Breakdown
- Use 24-Hour Session (All Markets)
When checked, the indicator ignores time zones and tracks signals during a full 24-hour period (0000-0000), helpful if you're outside U.S. trading hours or want consistent behavior globally.
- Market Session
Dropdown to select one of three key market zones:
- New York (09:30–16:00 ET)
- London (08:00–16:30 local)
- Tokyo (09:00–15:00 local)
Used to gate entry signals during relevant hours unless you choose the 24-hour option.
- Show PD VAH/VAL/POC Lines
Toggle to show or hide prior day’s levels (based on the 30-min extended session). Turning this off removes both the lines and their white text labels.
- Extend Lines Right
When enabled, the VAH/VAL/POC lines extend into the current day’s session. If disabled, they appear only at their anchor point.
- Highlight Selected Session
Adds a soft blue background to help visualize the active session you selected.
- Enable Alert Conditions
Allows TradingView alerts to be created for long/short 80% Rule entries.
- Enable Audible Alerts
Plays an in-chart sound with a popup message (“80% Rule LONG” or “SHORT”) when signals trigger. Requires the chart to be active and sounds enabled in TradingView.

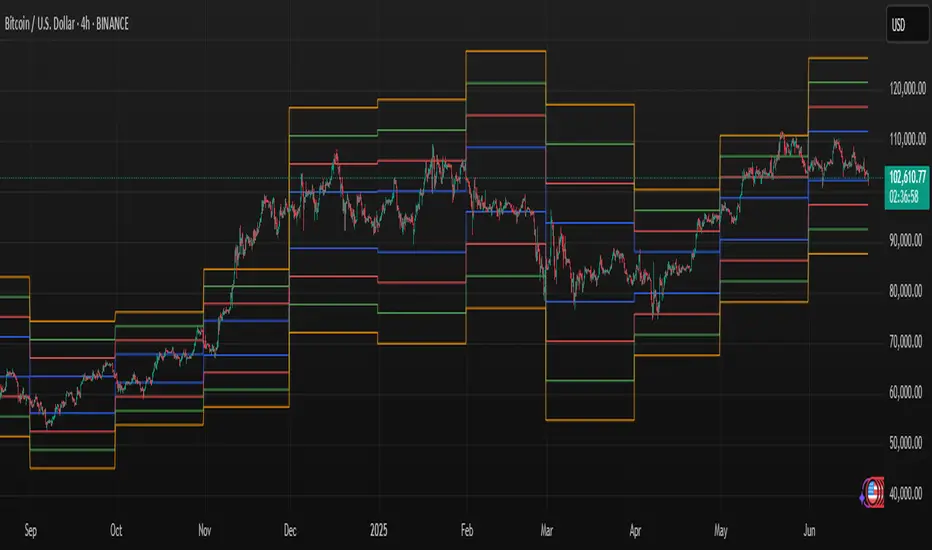
Volume Zones IndicatorVolume Zones Indicator — VWAP with Dynamic Monthly Volume Zones
This indicator is an enhanced version of the classic VWAP (Volume Weighted Average Price), designed to create clear monthly zones around VWAP based on average price range (ATR) and volume activity.
The core idea is to highlight key zones where price is more likely to reverse or consolidate, based on where significant trading volume occurs.
How does it work?
VWAP is calculated over the last N days (set by the lookbackPeriod input).
Four zones are plotted above and below VWAP, spaced using a multiple of ATR.
Each zone has its own color for clarity:
Blue — closest to VWAP
Red — second band
Green — third band
Orange — outer band (potential breakout or exhaustion zone)
If the current volume exceeds the moving average of volume, it is highlighted directly on the chart. This helps detect accumulation or distribution moments more easily.
What does the trader see?
You see horizontal colored bands on the chart that update at the start of each new month. These zones:
Remain fixed throughout the month
Automatically adjust based on recent volume and volatility
Act as dynamic support/resistance levels
Best used for:
Mean reversion strategies — identifying pullbacks toward value areas
Support and resistance mapping — automatic SR zones based on price/volume behavior
Breakout filtering — when price reaches zone 3 or 4, trend continuation or reversal is likely
Adding volume context to price action — works well with candlestick and pattern analysis
Settings
Lookback Period (Days): VWAP and volume smoothing length
Volume Area Threshold %: Reserved for future functionality
Works on any timeframe; best suited for 4H timeframe.
Zones are calculated and fixed monthly for clean visual context
Combines price structure with actual volume flow for more reliable decision-making
Breakout Confirmation🔍 Indicator Name: Breakout Confirmation (Body + Volume)
📌 Purpose:
This indicator is designed to detect high-probability breakout setups based on price structure and volume strength. It identifies moments when the market breaks through a key support or resistance level, confirmed by two consecutive strong candles with large real bodies and high volume.
⚙️ How It Works
1. Support and Resistance Detection
The indicator uses pivot points to identify potential horizontal support and resistance levels.
A pivot high or pivot low is considered valid if it stands out over a configurable number of candles (default: 50).
Only the most recent valid support and resistance levels are tracked and displayed as horizontal lines on the chart.
2. Breakout Setup
The breakout condition is defined as:
First Candle (Breakout Candle):
Large body (compared to the recent body average)
High volume (compared to the recent volume average)
Must close beyond a resistance or support level:
Close above resistance (bullish breakout)
Close below support (bearish breakout)
Second Candle (Confirmation Candle):
Also must have a large body and high volume
Must continue in the direction of the breakout (i.e., higher close in bullish breakouts, lower close in bearish ones)
3. Signal Plotting
If both candles meet the criteria, the indicator plots:
A green triangle below the candle for bullish breakouts
A red triangle above the candle for bearish breakouts
📈 How to Interpret the Signals
✅ Green triangle below a candle:
Indicates a confirmed bullish breakout.
The price has closed above a recent resistance level with strength.
The trend may continue higher — possible entry for long positions.
🔻 Red triangle above a candle:
Indicates a confirmed bearish breakout.
The price has closed below a recent support level with strength.
Potential signal to enter short or exit long positions.
⚠️ The plotted horizontal lines show the last key support and resistance levels. These are the zones being monitored for breakouts.
📊 How to Use It
Timeframe: Works best on higher timeframes (1H, 4H, Daily), but can be tested on any chart.
Entry: Consider entries after the second candle confirms the breakout.
Stop Loss:
For longs: Below the breakout candle or the broken resistance
For shorts: Above the breakout candle or broken support
Take Profit:
Based on previous structure, risk:reward ratios, or using trailing stops.
Filter with Trend or Other Indicators (optional):
You can combine this with moving averages, RSI, or market structure for confluence.
🛠️ Customization Parameters
lengthSR: How many candles to look back for identifying support/resistance pivots.
volLength: Length of the moving average for volume and body size comparison.
bodyMultiplier: Multiplier threshold to define a “large” body.
volMultiplier: Multiplier threshold to define “high” volume.
✅ Ideal For:
Price action traders
Breakout traders
Traders who use volume analysis
Anyone looking to automate the detection of breakout + confirmation setups

Wavelet-Trend ML Integration [Alpha Extract]Alpha-Extract Volatility Quality Indicator
The Alpha-Extract Volatility Quality (AVQ) Indicator provides traders with deep insights into market volatility by measuring the directional strength of price movements. This sophisticated momentum-based tool helps identify overbought and oversold conditions, offering actionable buy and sell signals based on volatility trends and standard deviation bands.
🔶 CALCULATION
The indicator processes volatility quality data through a series of analytical steps:
Bar Range Calculation: Measures true range (TR) to capture price volatility.
Directional Weighting: Applies directional bias (positive for bullish candles, negative for bearish) to the true range.
VQI Computation: Uses an exponential moving average (EMA) of weighted volatility to derive the Volatility Quality Index (VQI).
Smoothing: Applies an additional EMA to smooth the VQI for clearer signals.
Normalization: Optionally normalizes VQI to a -100/+100 scale based on historical highs and lows.
Standard Deviation Bands: Calculates three upper and lower bands using standard deviation multipliers for volatility thresholds.
Signal Generation: Produces overbought/oversold signals when VQI reaches extreme levels (±200 in normalized mode).
Formula:
Bar Range = True Range (TR)
Weighted Volatility = Bar Range × (Close > Open ? 1 : Close < Open ? -1 : 0)
VQI Raw = EMA(Weighted Volatility, VQI Length)
VQI Smoothed = EMA(VQI Raw, Smoothing Length)
VQI Normalized = ((VQI Smoothed - Lowest VQI) / (Highest VQI - Lowest VQI) - 0.5) × 200
Upper Band N = VQI Smoothed + (StdDev(VQI Smoothed, VQI Length) × Multiplier N)
Lower Band N = VQI Smoothed - (StdDev(VQI Smoothed, VQI Length) × Multiplier N)
🔶 DETAILS
Visual Features:
VQI Plot: Displays VQI as a line or histogram (lime for positive, red for negative).
Standard Deviation Bands: Plots three upper and lower bands (teal for upper, grayscale for lower) to indicate volatility thresholds.
Reference Levels: Horizontal lines at 0 (neutral), +100, and -100 (in normalized mode) for context.
Zone Highlighting: Overbought (⋎ above bars) and oversold (⋏ below bars) signals for extreme VQI levels (±200 in normalized mode).
Candle Coloring: Optional candle overlay colored by VQI direction (lime for positive, red for negative).
Interpretation:
VQI ≥ 200 (Normalized): Overbought condition, strong sell signal.
VQI 100–200: High volatility, potential selling opportunity.
VQI 0–100: Neutral bullish momentum.
VQI 0 to -100: Neutral bearish momentum.
VQI -100 to -200: High volatility, strong bearish momentum.
VQI ≤ -200 (Normalized): Oversold condition, strong buy signal.
🔶 EXAMPLES
Overbought Signal Detection: When VQI exceeds 200 (normalized), the indicator flags potential market tops with a red ⋎ symbol.
Example: During strong uptrends, VQI reaching 200 has historically preceded corrections, allowing traders to secure profits.
Oversold Signal Detection: When VQI falls below -200 (normalized), a lime ⋏ symbol highlights potential buying opportunities.
Example: In bearish markets, VQI dropping below -200 has marked reversal points for profitable long entries.
Volatility Trend Tracking: The VQI plot and bands help traders visualize shifts in market momentum.
Example: A rising VQI crossing above zero with widening bands indicates strengthening bullish momentum, guiding traders to hold or enter long positions.
Dynamic Support/Resistance: Standard deviation bands act as dynamic volatility thresholds during price movements.
Example: Price reversals often occur near the third standard deviation bands, providing reliable entry/exit points during volatile periods.
🔶 SETTINGS
Customization Options:
VQI Length: Adjust the EMA period for VQI calculation (default: 14, range: 1–50).
Smoothing Length: Set the EMA period for smoothing (default: 5, range: 1–50).
Standard Deviation Multipliers: Customize multipliers for bands (defaults: 1.0, 2.0, 3.0).
Normalization: Toggle normalization to -100/+100 scale and adjust lookback period (default: 200, min: 50).
Display Style: Switch between line or histogram plot for VQI.
Candle Overlay: Enable/disable VQI-colored candles (lime for positive, red for negative).
The Alpha-Extract Volatility Quality Indicator empowers traders with a robust tool to navigate market volatility. By combining directional price range analysis with smoothed volatility metrics, it identifies overbought and oversold conditions, offering clear buy and sell signals. The customizable standard deviation bands and optional normalization provide precise context for market conditions, enabling traders to make informed decisions across various market cycles.

Prev Week POC Buy/Sell Signals
Hi, I’m Edward. I created a straightforward strategy for swing traders (4hr or 8hr timeframe users). This strategy is for traders that are not interested to look at charts all day long, 2 times a day max, but still be profitable.
The indicator:
Print a buy signal when the price closes above the previous week's Point of Control (POC).
Stay in the trade until the price closes below the previous week's POC, then print a sell signal.
The indicator calculates the weekly POC using a basic volume profile method, then tracks the previous week's POC for signals.
Previous week POC is valid from Monday to Thursday. By close of business on Thursday, the current week trend and POC should be well established and should be used make buy or sell decisions. Enjoy!

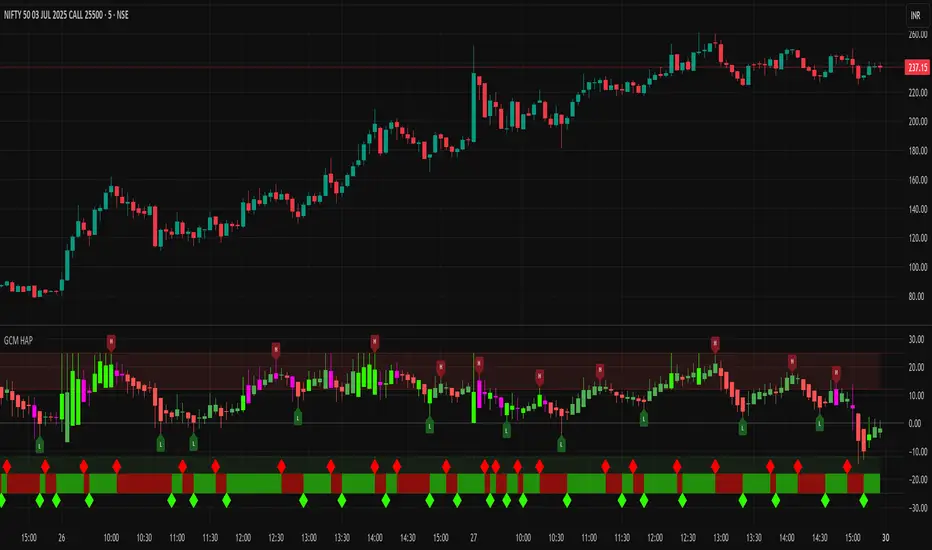
GCM Heikin Ashi with PivotsTitle: GCM Heikin Ashi with Pivots
Description:
Overview
This indicator provides a powerful combination of trend visualization, precise reversal signals, and volume confirmation in a clean, customizable sub-chart. It is designed to help traders identify trend momentum using Heikin Ashi candles, pinpoint confirmed swing highs and lows (pivots), and spot surges in buying pressure with our unique Volume Rate-of-Change (VROC) highlighter.
The key feature of this script is its non-repainting pivot signals. A pivot high or low is only confirmed and plotted after a specific number of subsequent bars have closed, ensuring the signals are reliable and do not change after they appear.
Key Features
Heikin Ashi Sub-Chart: Displays smoothed Heikin Ashi candles in a separate pane to clearly visualize trend strength and direction without cluttering the main price chart.
Non-Repainting Pivot Signals: Uses ta.pivothigh and ta.pivotlow to identify confirmed swing points. The signals will not repaint or move once they are printed on the chart.
Smart Volume Spike Analysis (VROC): A Heikin Ashi candle will be highlighted in a distinct bright green (#2dff00) when the volume increases significantly on a bullish price candle. This "volume-confirmed" candle can signal strong conviction behind a move.
Complete Label Customization: Take full control over the look and feel of your signals:
Label Mode: Choose between "High & Low" (H/L) or "Buy & Sell" (B/S) to match your trading terminology.
Custom Colors: Set unique colors for both the high and low pivot labels.
Label Style: Select from various shapes like boxes, circles, diamonds, or squares.
Label Size: Adjust the size of the labels from Tiny to Huge for perfect visibility.
Adjustable Pivot Sensitivity: Fine-tune the pivot detection algorithm by setting the number of bars required to the left (strength) and right (confirmation) of a pivot point.
How to Use & Interpret the Signals
Assess the Trend with Heikin Ashi:
A series of green HA candles with little to no lower wicks indicates strong bullish momentum.
A series of red HA candles with little to no upper wicks indicates strong bearish momentum.
Look for Volume Confirmation:
A bright green highlighted candle signals a surge in buying pressure (VROC spike). This adds significant weight to bullish moves and can act as a leading indicator for a new leg up.
Identify Entry/Exit Points with Pivot Labels:
An "L" or "B" label marks a confirmed swing low. This is a potential buying opportunity, especially if it is followed by green Heikin Ashi candles and, ideally, a bright green VROC spike candle.
An "H" or "S" label marks a confirmed swing high. This is a potential selling/shorting opportunity, especially as HA candles turn red.
Example Strategy (High-Confluence)
A powerful way to use this indicator is to look for a sequence of events:
Wait for a "Buy" (B) or "Low" (L) signal to appear, confirming a bottom has likely formed.
Wait for the first bright green VROC spike candle to appear after the signal. This confirms that buyers are stepping in with conviction.
Consider an entry based on this high-confluence setup, using the swing low as a potential stop-loss area.
Settings Explained
Pivot Detection:
Left Bars (Strength): Number of bars to the left of a pivot. A higher number finds more significant pivots.
Right Bars (Confirmation): Number of bars to the right required to confirm a pivot. This creates a lag for reliability.
Volume Spike Detection (VROC):
Enable Volume Spike Highlighting: Turn the bright green candle highlight on or off.
VROC Length: The lookback period for calculating the volume's rate of change.
VROC Threshold %: The percentage volume must increase to trigger a highlight.
Label Customization:
Label Text Mode: Choose between "High & Low" or "Buy & Sell".
Label Color, Style, and Size: Full cosmetic control for the pivot labels.
Final Note
This indicator is a tool to aid in technical analysis and should not be used as a standalone trading system. Always use it in conjunction with other analysis methods, proper risk management, and a sound trading plan.
Enjoy!
SHA Multi Pivot Points -v1.0.0🔎Using Pivot Points in Trading
Traders use PPs to help determine predefined support and resistance levels to guide their trading strategies. In addition, traders identify potential price reversals, trend direction, and breakout opportunities:
Trend identification: PPs act as a reference level to gauge market sentiment. If the price opens above the PP and remains above it, traders interpret this as an uptrend. Conversely, if the price opens below the pivot point and stays below, it suggests a downtrend.
Support and resistance determination: Pivot levels are natural barriers where price reactions frequently occur. Traders may enter long positions near support levels, expecting a price bounce, or if the price approaches resistance levels, traders may consider shorting the asset.
Breakout trading: When the price breaks above resistance or support, it may indicate strong momentum for further movement.
Reversal identification: Traders also look for failed breakouts or price rejections at pivot levels to anticipate reversals.
Trading strategy combinations: Traders can improve accuracy by combining PPs with other technical analysis indicators.
1. Camarilla Pivot Points
📌 Overview:
Developed by Nick Scott in 1989, Camarilla Pivot Points are designed for short-term, intraday trading. Unlike traditional pivots, Camarilla levels are tighter and more responsive, making them useful in volatile markets.
📐 Key Levels:
It generates eight levels:
- Resistance: Initial Level (R1), Mid-range Level (R2), Sell Reversal Level (R3), Breakout Level (R4)
- Support: Initial Level (S1), Mid-range Level (S2), Buy Reversal Level (S3), Breakout Level (S4)
✅ How to Use:
- S1/R1 + RSI or volume divergence to confirm weak momentum and early reversals.
- S2/R2 with price action patterns to enter early on major moves before L3/H3 get tested.
- S3/R3: Mean-reversion zones → price often reverses.
- Break of S4/R4: Strong breakout → trend-following signal.
- Combine with volume or candlestick confirmation for entries.
🔹 2. Floor (Standard) Pivot Points
📌 Overview:
This is the most traditional pivot method, widely used by floor traders. It’s symmetrical and provides a clear central pivot point with equally spaced support and resistance levels.
📐 Key Levels:
- Povit Points : Average price (PPs)
- Resistance : First price ceiling (R1), Stronger ceiling (R2), Extreme resistance (R3)
- Support : First price floor (S1), Stronger floor (S2), Extreme support (S3)
✅ How to Use:
- Above PPs = bullish bias; Below PPs = bearish bias.
- S1/R1 are most used for intraday targets.
- S2–S3/R2–R3 indicate potential extreme moves.
- Often used in combination with momentum indicators.
🔹 3. Woodie Pivot Points
📌 Overview:
Woodie’s pivot formula gives double weight to the closing price, emphasizing the most recent session's sentiment.
📐 Key Levels:
- Povit Points : Weighted average (PPs)
- Resistance : First price ceiling (R1), Stronger resistance (R2)
- Support : First price floor (S1), Stronger support (S2)
✅ How to Use:
- Works best in fast-moving markets.
- PPs acts as a momentum-based balance level.
- Good for scalpers and momentum traders.
🔹 4. Fusion Pivot Points
📌 Overview:
This method differs significantly — it calculates only one support and one resistance level, adjusting based on the relationship between the open and close.
📐 Key Levels:
- Povit Points : Single directional (PPs)
- Resistance : Potential ceiling (R)
- Support : Potential floor (S)
✅ How to Use:
- Not symmetrical → more responsive to price behavior.
- Best for breakout or reversal strategies.
- Use when you're expecting directional momentum.
🔹 5. Classic Pivot Points (Traditional)
📌 Overview:
Also known as Standard or Traditional Pivot Points, this is the default method used by most charting platforms. It offers a balanced and simple framework.
📐 Key Levels:
- Povit Points : Central price level (PPs)
- Resistance : First ceiling (R1), Stronger resistance (R2), Extreme resistance (R3)
- Support : First floor (S1), Stronger floor (S2), Extreme support (S3)
✅ How to Use:
- PPs is the market’s equilibrium point.
- Helps define market structure, bias, and trade zones.
- Combine with order blocks, RSI, or MACD for confirmation.
📊 Summary Comparison :
1. Camarilla Pivot Points
- Focus : Mean Reversion & Breakouts
- Best Use : Scalping, Day Trading
2. Floor Pivot Points
- Focus : General Support/Resistance
- Best Use : Intraday, Swing
3. Woodie Pivot Points
- Focus : Recent Close Emphasis
- Best Use : Momentum Trading
4. Fusion Pivot Points
- Focus : Trend/Breakout
- Best Use : Directional Breakouts
5. Classic Povit Points
- Focus : Market Structure
- Best Use : General Use
⚠️ Disclaimer
The information and tools provided in this script are for educational and informational purposes only. They do not constitute financial advice, investment recommendations, or a solicitation to buy or sell any financial instrument.
Trading in the financial markets involves risk of loss and is not suitable for every investor. You are solely responsible for your trading decisions. Always do your own research, use proper risk management, and consult a licensed financial advisor before making any financial decisions.

Timeshifter Triple Timeframe Strategy w/ SessionsOverview
The "Enhanced Timeshifter Triple Timeframe Strategy with Session Filtering" is a sophisticated trading strategy designed for the TradingView platform. It integrates multiple technical indicators across three different timeframes and allows traders to customize their trading Sessions. This strategy is ideal for traders who wish to leverage multi-timeframe analysis and session-based trading to enhance their trading decisions.
Features
Multi-Timeframe Analysis and direction:
Higher Timeframe: Set to a daily timeframe by default, providing a broader view of market trends.
Trading Timeframe: Automatically set to the current chart timeframe, ensuring alignment with the trader's primary analysis period.
Lower Timeframe: Set to a 15-minute timeframe by default, offering a granular view for precise entry and exit points.
Indicator Selection:
RMI (Relative Momentum Index): Combines RSI and MFI to gauge market momentum.
TWAP (Time Weighted Average Price): Provides an average price over a specified period, useful for identifying trends.
TEMA (Triple Exponential Moving Average): Reduces lag and smooths price data for trend identification.
DEMA (Double Exponential Moving Average): Similar to TEMA, it reduces lag and provides a smoother trend line.
MA (Moving Average): A simple moving average for basic trend analysis.
MFI (Money Flow Index): Measures the flow of money into and out of a security, useful for identifying overbought or oversold conditions.
VWMA (Volume Weighted Moving Average): Incorporates volume data into the moving average calculation.
PSAR (Parabolic SAR): Identifies potential reversals in price movement.
Session Filtering:
London Session: Trade during the London market hours (0800-1700 GMT+1).
New York Session: Trade during the New York market hours (0800-1700 GMT-5).
Tokyo Session: Trade during the Tokyo market hours (0900-1800 GMT+9).
Users can select one or multiple sessions to align trading with specific market hours.
Trade Direction:
Long: Only long trades are permitted.
Short: Only short trades are permitted.
Both: Both long and short trades are permitted, providing flexibility based on market conditions.
ADX Confirmation:
ADX (Average Directional Index): An optional filter to confirm the strength of a trend before entering a trade.
How to Use the Script
Setup:
Add the script to your TradingView chart.
Customize the input parameters according to your trading preferences and strategy requirements.
Indicator Selection:
Choose the primary indicator you wish to use for generating trading signals from the dropdown menu.
Enable or disable the ADX confirmation based on your preference for trend strength analysis.
Session Filtering:
Select the trading sessions you wish to trade in. You can choose one or multiple Sessions based on your trading strategy and market focus.
Trade Direction:
Set your preferred trade direction (Long, Short, or Both) to align with your market outlook and risk tolerance. You can use this feature to gauge the market and understand the possible directions.
Tips for Profitable and Safe Trading:
Recommended Timeframes Combination:
LT: 1m , CT: 5m, HT: 1H
LT: 1-5m , CT: 15m, HT: 4H
LT: 5-15m , CT: 4H, HT: 1W
Backtesting:
Always backtest the strategy on historical data to understand its performance under various market conditions.
Adjust the parameters based on backtesting results to optimize the strategy for your specific trading style.
Risk Management:
Use appropriate risk management techniques, such as setting stop-loss and take-profit levels, to protect your capital.
Avoid over-leveraging and ensure that you are trading within your risk tolerance.
Market Analysis:
Combine the script with other forms of market analysis, such as fundamental analysis or market sentiment, to make well-rounded trading decisions.
Stay informed about major economic events and news that could impact market volatility and trading sessions.
Continuous Monitoring:
Regularly monitor the strategy's performance and make adjustments as necessary.
Keep an eye on the results and settings for real-time statistics and ensure that the strategy aligns with current market conditions.
Education and Practice:
Continuously educate yourself on trading strategies and market dynamics.
Practice using the strategy in a demo account before applying it to live trading to gain confidence and understanding.

Volume Weighted Regression ChannelThis indicator constructs a volume-weighted linear regression channel over a custom time range.
It’s conceptually similar to a Volume Profile, but instead of projecting horizontal value zones, it builds a tilted trend channel that reflects both price direction and volume concentration.
🧠 Core Features:
Volume-weighted points: Each candle contributes to the regression line proportionally to its volume — heavier candles shift the channel toward high-activity price zones.
Linear regression line: Shows the trend direction within the selected time interval.
±σ boundaries: Outer bands represent the standard deviation of price (also volume-weighted), highlighting statistical dispersion.
Fully customizable: Adjustable line styles, widths, and channel width (sigma multiplier).
Time window control: Select any start and end time to define the regression interval.
📊 Why use this instead of Volume Profile?
While Volume Profile shows horizontal distributions of traded volume, this indicator is ideal when:
You want to understand how volume clusters affect trend direction, not just price levels.
You're analyzing time-dependent flow rather than static price zones.
You're looking for a dynamic volume-adjusted channel that moves with the market's structure.
It’s especially useful in identifying volume-supported trends, hidden pullback zones, and statistical extremes.
⚙️ Notes:
Works on any timeframe and instrument.
Does not repaint.
Does not require volume profile data feeds — uses standard volume and hl2.
Mark4ex vWapMark4ex VWAP is a precision session-anchored Volume Weighted Average Price (VWAP) indicator crafted for intraday traders who want clean, reliable VWAP levels that reset daily to match a specific market session.
Unlike the built-in continuous VWAP, this version anchors each day to your chosen session start and end time, most commonly aligned with the New York Stock Exchange Open (9:30 AM EST) through the market close (4:00 PM EST). This ensures your VWAP reflects only intraday price action within your active trading window — filtering out irrelevant overnight moves and providing clearer mean-reversion signals.
Key Features:
Fully configurable session start & end times — adapt it for NY session or any other market.
Anchored VWAP resets daily for true session-based levels.
Built for the New York Open Range Breakout strategy: see how price interacts with VWAP during the volatile first 30–60 minutes of the US market.
Plots a clean, dynamic line that updates tick-by-tick during the session and disappears outside trading hours.
Designed to help you spot real-time support/resistance, intraday fair value zones, and liquidity magnets used by institutional traders.
How to Use — NY Open Range Breakout:
During the first hour of the New York session, institutional traders often define an “Opening Range” — the high and low formed shortly after the bell. The VWAP in this zone acts as a dynamic pivot point:
When price is above the session VWAP, bulls are in control — the level acts as a support floor for pullbacks.
When price is below the session VWAP, bears dominate — the level acts as resistance against bounces.
Breakouts from the opening range often test the VWAP for confirmation or rejection.
Traders use this to time entries for breakouts, retests, or mean-reversion scalps with greater confidence.
⚙️ Recommended Settings:
Default: 9:30 AM to 4:00 PM New York time — standard US equities session.
Adjust hours/minutes to match your target market’s open and close.
👤 Who is it for?
Scalpers, day traders, prop traders, and anyone trading the NY Open, indices like the S&P 500, or highly liquid stocks during US cash hours.
🚀 Why use Mark4ex VWAP?
Because a properly anchored VWAP is a trader’s real-time institutional fair value, giving you better context than static moving averages. It adapts live to volume shifts and helps you follow smart money footprints.
This indicator will reconfigure every day, anchored to the New York Open, it will also leave historical NY Open VWAP for study purpose.