Fair Value Gap Profiles [AlgoAlpha]🟠 OVERVIEW
This script draws and manages Fair Value Gap (FVG) zones by detecting unfilled gaps in price action and then augmenting them with intra-gap volume profiles from a lower timeframe. It is designed to help traders find potential areas where price may return to fill liquidity voids, and to provide extra detail about volume distribution inside each gap to assess strength and likely mitigation. The script automatically tracks each gap, updates its state over time, and can show which gaps are still unfilled or have been mitigated.
🟠 CONCEPTS
A Fair Value Gap is a zone between candles where no trades occurred, often seen as an inefficiency that price later revisits. The script checks each bar to see if a bullish (low above 2-bars-ago high) or bearish (high below 2-bars-ago low) gap has formed, and measures whether the gap’s size exceeds a threshold defined by a volatility-adjusted multiplier of past gap widths (to only detect significantly large gaps). Once a qualified gap is found, it gets recorded and visualized with a box that can stretch forward in time until filled. To add more context, a mini volume profile is built from a lower timeframe’s price and volume data, showing how volume is distributed inside the gap. The lowest-volume subzone is also highlighted using a sliding window scan method to visualise the true gap (area with least trading activity)
🟠 FEATURES
Visual gap boxes that appear automatically when bullish or bearish fair value gaps are detected on the chart.
Color-coded zones showing bullish gaps in one color and bearish gaps in another so you can easily see which side the gap favors.
Volume profile histograms plotted inside each gap using data from a lower timeframe, helping you see where volume concentrated inside the gap area.
Highlight of the lowest-volume subzone within each gap so you can spot areas price may target when filling the gap.
Dynamic extension of the gap boxes across the chart until price comes back and fills them, marking them as mitigated.
Customizable colors and transparency settings for gap boxes, profiles, and low-volume highlights to match your chart style.
Alerts that notify you when a new gap is created or when price fills an existing gap.
🟠 USAGE
This indicator helps you find and track unfilled price gaps that often act as magnets for price to revisit. You can use it to spot areas where liquidity may rest and plan entries or exits around these zones.
The colored gap boxes show you exactly where a fair value gap starts and ends, so you can anticipate potential pullbacks or continuations when price approaches them.
The intra-gap volume profile lets you gauge whether the gap was created on strong or thin participation, which can help judge how likely it is to be filled. The highlighted lowest-volume subzone shows where price might accelerate once inside the gap.
Traders often look for entries when price returns to a gap, aiming for a reaction or reversal in that area. You can also combine the mitigation alerts with your trade management to track when gaps have been closed and adjust your bias accordingly. Overall, the tool gives a clear visual reference for imbalance zones that can help structure trades around supply and demand dynamics.
Volume

Buy sell Trend VolumeThis indicator analyzes the flow of volume and price changes to identify potential trends.
Understanding Volume Indicator: A Comprehensive Guide
Introduction. The volume indicator is a vital tool investors and traders use to understand the liquidity and market activity in trading.

Absorption DetectorABSORPTION DETECTOR -
The Absorption Detector identifies institutional order flow by detecting "absorption" patterns where smart money quietly accumulates or distributes positions by absorbing retail order flow. This creates high-probability support and resistance zones for trading. This is an approximation only and does not read any footprint data.
WHAT IS ABSORPTION?
Absorption occurs when institutions take the opposite side of retail trades, creating specific candlestick patterns with high volume and significant wicks. The indicator identifies two main patterns:
SELLING ABSORPTION (P-Pattern): Red zones above candles where institutions sell into retail buying pressure, creating resistance levels. Look for high volume candles with large upper wicks that close in the lower half.
BUYING ABSORPTION (B-Pattern): Green zones below candles where institutions buy from retail selling pressure, creating support levels. Look for high volume candles with large lower wicks that close in the upper half.
KEY FEATURES
- Automatic detection of institutional absorption patterns
- Dynamic support and resistance zone creation
- Customizable styling for all visual elements
- Historic zone display for backtesting analysis
- Strength-based filtering to show only high-probability setups
- Real-time alerts for new absorption patterns
- Professional info panel with key statistics
- Multi-timeframe compatibility
MAIN SETTINGS
Volume Threshold (1.2): Minimum volume surge required compared to average. Higher values = fewer but stronger signals.
Minimum Volume (2500): Absolute volume floor to prevent signals during low-volume periods.
Min Wick Size (0.2): Minimum wick size as ATR multiple. Ensures significant rejection occurred.
Minimum Strength (1.5): Combined volume and wick strength filter. Higher values = higher quality signals.
Show Historic Zones (OFF): Enable to see all historical zones for backtesting. Disable for better performance.
Zone Extension (20): How many bars to project zones forward for anticipating future reactions.
TRADING APPROACH
ZONE REACTION STRATEGY: Wait for price to approach absorption zones and trade the bounce or rejection. Use the zones as dynamic support and resistance levels.
BREAKOUT STRATEGY: Trade decisive breaks of strong absorption zones with proper risk management. Failed zones often lead to strong moves.
CONFLUENCE TRADING: Combine absorption zones with other technical analysis for highest probability setups. Look for alignment with trend lines, Fibonacci levels, and key support/resistance.
RISK MANAGEMENT: Always use stop losses beyond the absorption zones. Target minimum 1:2 risk-reward ratios. Position size appropriately based on zone strength.
OPTIMIZATION GUIDE
For Conservative Trading (fewer, higher quality signals):
- Volume Threshold: 1.5
- Minimum Strength: 2.0
- Min Wick Size: 0.3
For Aggressive Trading (more signals, requires careful filtering):
- Volume Threshold: 1.1
- Minimum Strength: 1.0
- Min Wick Size: 0.15
BEST PRACTICES
Markets: Works best on liquid instruments with good volume - major forex pairs, popular stocks, liquid futures, and established cryptocurrencies.
Timeframes: Effective on all timeframes from 1-minute scalping to daily swing trading. Adjust settings based on your timeframe and trading style.
Confirmation: Never trade absorption signals in isolation. Always combine with trend analysis, market structure, and proper risk management.
Session Timing: Be aware of market sessions and avoid trading during low liquidity periods or major news events.
Backtesting: Use the historic zones feature to validate performance on your chosen market and timeframe before live trading.
CUSTOMIZATION
The indicator offers complete visual customization including zone colors, border styles, label appearances, and info panel positioning. All colors can be adapted to match your chart theme and personal preferences.
Alert system provides both basic and custom message alerts for real-time notifications of new absorption patterns.
PERFORMANCE NOTES
Default settings are optimized for most markets and timeframes. For best performance on older charts, keep "Show Historic Zones" disabled unless specifically backtesting.
The indicator maintains excellent performance even with extensive historical analysis enabled, handling up to 500 zones and 100 labels for comprehensive backtesting.

Universal ATR Grid from Entry Price with AlertsUniversal ATR Grid from Entry Price with Alerts
This Pine Script v6 indicator creates a dynamic price grid based on a user-defined entry price and ATR for selected instruments (SOLUSDT, XRPUSDT, DOGEUSDT, PEPEUSDT, WIFUSDT).
Users can customize the entry price, ATR, number of levels (up to 5), and step multiplier per instrument.
The grid shows long (green) and short (red) levels around the entry price (gray), with labels offset right.
Lines extend from labels to the current bar, updating dynamically.
Alerts trigger on breakouts of long, short, and entry levels. Instrument names can be modified in the script.

Silver Bullet ICT – Sweep + FVG + OB🧠 Silver Bullet ICT – Sweep + FVG + OB (Smart Money Tool)
✅ Works on:
NASDAQ / US100
SPX500 / DAX / FX majors
BTC/USD and other crypto
Any asset with high liquidity and volatility during the New York PM session
📊 Strategy Flow:
“We observe what the 4H candle at 16:00 CET produces – then execute the trade on the 5-minute chart if a sweep is confirmed.”
🎯 Logic Breakdown:
Session Timeframe:
Defined between 16:00–17:00 CET – configurable in settings.
Wait for Sweep:
A liquidity grab above previous high (or below previous low) during session.
Marked with triangle (▲ red for high, ▼ green for low).
Confirmed Signal:
A candle closes against the sweep direction.
Volume (optional) is above 20-SMA.
Triggers BUY (green label) or SELL (red label).
Entry Execution:
After the first 4H candle closes at 16:00 CET, look for a confirmed signal on 5-minute chart.
Rozegranie sygnału tylko, gdy zamknie się świeca potwierdzająca sweep.
Confluence:
OB (Order Blocks) and FVG (Fair Value Gaps) help refine targets and context.
Additional box is drawn to visualize session range.
🕊️ Notes:
Does not repaint sweep confirmations
Built-in alerts for sweep and entry signals
Customizable volume filter, box visuals, and session times

Tiny Candle + High Volume DetectorTiny Candle + High Volume Detector
This simple indicator highlights candles with:
A very small body (user-defined % of the close)
A significant volume spike (volume > X times average)
📊 Use this to spot:
Compression zones before breakout
Smart money absorption
Hidden accumulation
⚙️ Adjustable Parameters:
Max Body Size (% of close)
Volume Spike Multiplier
Volume SMA Period
🔔 Alerts are included.
Works on all timeframes and instruments. Best used in trending or consolidating environments to detect buildup before expansion.

Volume MA Crossover SignalsDisplay the 10-day Simple Moving Average volume in red .
Display the 20-day Simple Moving Average volume in orange.

Volume Scanner (Spikes & Drops) [Context]
💡 In many trading strategies, volume is used as a filter — but not all volume matters.
What really counts are moments when volume suddenly spikes or drops — these are the bars where something important might be happening: a large player enters the market, a fakeout occurs, or a trend shift begins.
🎯 What this indicator does:
This script highlights only the most significant volume anomalies, filtering out the noise and focusing on real movement:
🔺 Green background = Volume Spike (sudden increase)
🔻 Red background = Volume Drop (sudden decrease)
📊 Optional contextual filter:
Enable price context to show signals only when volume shifts occur alongside a breakout of recent high/low.
Fully customizable: control the strength of spikes/drops, the lookback period, and the minimum gap between signals.
📦 Great for:
Adding a clean volume filter to price action strategies
Quickly spotting key volume bars in real time
Works on any timeframe and market (crypto, forex, stocks, indices)

Momentum Trading StrategyThis is a Trend Following Momentum Strategy, where i used EMA, ADX, RSI, VWAP to take trade with Trend and initiate trade when Momentum builds up.
The Default target is 1:2

Average Dollar VolumeSimply displays the average daily dollar volume in the top right corner of the chart.

VW Delta DivergenceThis indicator compares multiple Volume Weighted Moving Averages (VWMA) against the VWAP to highlight momentum shifts and potential divergences in price action. It gives traders a unique perspective by measuring volume-sensitive delta values, smoothing optionality, and tracking divergences between price and indicator behavior.
⚙️ How to Use
1. Setup & Interpretation
• Add the indicator to your chart and set your desired VWMA lengths (–). These define how sensitive the deltas are to price and volume fluctuations.
• The indicator plots the average delta between VWMA and VWAP. A positive value indicates that VWMA is above VWAP, suggesting bullish momentum; a negative value suggests bearish sentiment.
2. Visualization Features
• Color-coded average delta line:
• 🟣 Fuchsia when delta is positive (bullish bias)
• 🧊 Aqua when delta is negative (bearish bias)
• Optional histogram mode for visualizing delta strength
• Dynamic opacity scaling helps highlight the intensity of divergence
3. Divergence Detection
• Regular bullish divergence:
• Price forms a lower low
• Average delta forms a higher low
• Regular bearish divergence:
• Price forms a higher high
• Average delta forms a lower high
• These divergences are marked with green ⬆️ and red ⬇️ triangle shapes
4. Additional Momentum Signal
• A 10-period SMA overlays the delta to hint at momentum shifts
• If the SMA crosses the delta, the script triggers an alert condition titled “Momentum Shift Alert”

WVAD with Gap Compensation**Indicator Name:** WVAD with Gap Compensation
**Purpose:** Enhances the classic Williams Vix Fix (WVAD) by incorporating the impact of price gaps (jump ups/downs) in its calculation.
**Key Features:**
1. **Gap Detection:** Automatically identifies significant gaps (default: >0.5% from prior bar's high/low).
2. **Gap Compensation:** Adjusts the WVAD calculation by adding the gap size to the daily price change.
3. **Dynamic Weighting:** Applies a multiplier (1.2x or 1.5x) to the WVAD value on days with medium/large gaps (based on ATR).
4. **Visualization:**
- Plots the enhanced WVAD line (blue) and optionally the original WVAD (gray circles).
- Marks gap events with colored arrows (green ▲ for gap up, red ▼ for gap down) and connects the gap's impact with dashed lines.
- Includes a zero line for reference.
**Use Cases:**
- Gauges the true strength of money flow by accounting for gaps.
- Identifies potential trend shifts around gap events.
- Filters noise by focusing on significant gaps.
**Parameters:**
- `Accumulation Period`: Number of days to sum WVAD (default: 12).
- `Gap Threshold (%)`: Minimum gap size to trigger compensation (default: 0.5%).
- `Show Original WVAD`: Toggles display of the classic WVAD.
**Version:** Pine Script® v6

Aggregated Open Interest🔰 Aggregated Open Interest — Multi-Exchange + Base/USD Denomination Control
By
This indicator was created to aggregate all available Open Interest (OI) data on TradingView across major crypto futures exchanges, providing a complete, real-time view of leveraged capital flow in the market.
It includes a powerful denomination toggle:
Base Denomination (default): shows OI in terms of the base asset (e.g., BTC, ETH)
USD Denomination: converts all OI values into USD using the real-time price
📦 Aggregates Open Interest from:
Binance (USDT, USD, and USDC contracts)
BitMEX (USD and USDT contracts)
Kraken (USD contracts)
OKX (USDT and USD contracts)
🆕 This script is designed to be updated continuously as TradingView adds new exchanges or instruments with _OI data. Any new OI source will be added in future updates automatically.
🧠 How to use it:
This indicator works on any chart — spot, perpetual, or otherwise — including BTC, ETH, altcoins, etc.
The OI data is pulled directly from supported futures contracts using request.security() — regardless of the current chart type.
🔍 Why Open Interest matters:
🔺 Rising OI with price: indicates new positions (breakouts or trend continuation)
🔻 Falling OI after strong move: suggests liquidations or profit taking
🔄 Divergences between price and OI (e.g., price up but OI down) often signal trend exhaustion
🧠 Use OI candles to analyze how leverage evolved within each bar (not just at the close)
💥 Spikes in OI wicks may reflect aggressive shorting or margin pressure
⚙️ Features:
✅ Aggregates OI from multiple exchanges
⚖️ Toggle between Base and USD denomination
📊 Real Open Interest Candlesticks (OHLC)
🧩 Modular: turn individual exchanges on/off
🛠️ Fully compatible with any crypto symbol, including spot and perp charts
Note: The indicator does not require you to apply it to a futures contract. It works on any symbol. The Open Interest data is fetched from _OI contracts internally, using request.security().
Telegram :
t.me

Volume-Confirmed Price Momentum# **Volume-Confirmed Price Momentum (VCPM) Indicator**
## **🔍 Overview**
Introducing the **Volume-Confirmed Price Momentum (VCPM)**, a sophisticated dual-metric indicator designed to identify high-probability momentum moves by analyzing the relationship between price action and volume dynamics. This indicator combines correlation analysis with volume strength validation to filter out weak signals and highlight institutional-backed movements.
---
## **⚙️ Core Mechanics**
**Price-Volume Correlation Engine:**
- Calculates real-time correlation between price movements and volume
- Configurable lookback period (default: 8 bars)
- Option to use price changes or absolute values
- Correlation range: -1.0 (perfect negative) to +1.0 (perfect positive)
**Volume Strength Analyzer:**
- Compares current volume against its moving average (default: 128 periods)
- Normalizes volume ratio to 0-1 scale for consistent interpretation
- Identifies when volume significantly exceeds historical norms
---
## **📊 Signal Generation**
### **🟢 Bullish Confirmation Signal**
**Trigger:** Positive correlation > 0.6 + Volume ratio > 0.5
- Price and volume moving in harmony upward
- Above-average volume confirms the move
- Indicates strong institutional buying interest
### **🔴 Bearish Confirmation Signal**
**Trigger:** Negative correlation < -0.6 + Volume ratio > 0.5
- Price declining with increasing volume
- Suggests distribution or institutional selling
- High-confidence bearish momentum
---
## **🎯 Trading Applications**
**Breakout Validation:**
Filter false breakouts by requiring volume confirmation before entering positions.
**Trend Continuation:**
Identify when existing trends have strong volume backing for continuation plays.
**Distribution Detection:**
Spot potential tops when price struggles despite high volume (negative correlation).
**Entry Timing:**
Built-in alert system notifies when both conditions align for optimal entry points.
---
## **🔧 Customization Features**
- **Correlation Period:** Adjust sensitivity (2-500 bars)
- **Volume Averaging:** Modify volume comparison timeframe
- **Alert Thresholds:** Fine-tune correlation and volume ratio triggers
- **Visual Options:** Toggle volume histogram display
- **Price Source:** Choose from OHLC or custom sources
---
## **💡 Why VCPM Works**
Traditional momentum indicators often generate false signals during low-volume periods. VCPM solves this by requiring **dual confirmation**: price momentum must be supported by corresponding volume activity. This approach:
- Reduces whipsaws and false breakouts
- Identifies institutional participation
- Provides higher conviction trade setups
- Works across all timeframes and markets
---
## **📈 Best Use Cases**
✅ **Crypto markets** (high volatility, volume-driven)
✅ **Stock breakouts** (earnings, news events)
✅ **Forex majors** (during high-impact news)
✅ **Futures trading** (momentum confirmation)
---
## **⚠️ Important Notes**
- Works best in liquid markets with consistent volume data
- Combine with support/resistance levels for enhanced accuracy
- Consider market context (trending vs. ranging conditions)
- Not recommended for extremely low-volume periods
---
## **🚀 Getting Started**
1. Add VCPM to your chart as a sub-panel indicator
2. Configure correlation threshold (start with 0.6)
3. Set volume ratio threshold (start with 0.5)
4. Enable alerts for automated signal detection
5. Backtest on your preferred timeframe and instrument
---
**Ready to enhance your momentum trading with volume confirmation? Try VCPM and experience the difference institutional-backed signals can make in your trading results.**
*Available in Pine Script v6 - Compatible with all TradingView accounts*

Aggregated VolumeHow to Read the “Aggregated Volume” Signal
This indicator combines normalized volume, short-term volume bursts, pivot levels, VWAP, and a 200-period EMA to give you a multi-dimensional view of trading activity. Here’s how to interpret each component and synthesize them into actionable insights.
1. Custom Volume Signal (vSignal)
• Calculation
• vSignal = Sum of over bars, divided by the current price.
• A rising vSignal means more volume is being traded per unit of price, signaling growing interest relative to price level.
• Plot styling
• Bars are lime when (bullish volume days)
• Bars are orange when (bearish volume days)
How to read it
• Trend confirmation: Increasing lime bars alongside rising price suggests buyers in control.
• Warning sign: Rising orange bars on a down move indicate accelerating selling pressure.
• Divergence:
• Price making new highs while vSignal stalls or drops → potential top.
• Price making new lows while vSignal holds → potential bottom.
2. Short-Term Volume Bursts
Three semi-transparent histograms show how much the last 2, 5, and 10-bar raw volumes exceed (or fall below) the current vSignal:
• Blue = vol(2) – vSignal
• Green = vol(5) – vSignal
• Red = vol(10) – vSignal
If a colored bar sits above zero, that lookback’s volume is surging relative to the longer-term average (vSignal).
How to read it
• Clustered bursts:
• Blue + Green + Red above zero → strong, broad-based volume surge.
• Great for confirming breakouts and shakeouts.
• Isolated burst:
• Only Blue (> 0) on a small range bar → might be a false breakout or intrabar squeeze.
• Only Red (> 0) on a wide range → institutional involvement; act with caution.
3. Pivot Volume Levels (v & t)
• Every 21 bars, the script finds the highest and lowest vSignal values and plots them as shaded price levels:
• Magenta area = recent vSignal high (resistance)
• Cyan area = recent vSignal low (support)
How to read it
• Rejection/Break:
• Price approaches magenta zone and stalls → sellers defending that volume high.
• Break above magenta with high vSignal → likely sustained rally.
• Support flip:
• Cyan zone hold → buyers stepping in at heavy-volume lows.
• Break below cyan with rising vSignal → bearish conviction.
4. Midline Cross (Volume Equilibrium)
• A 10-bar SMA of
• Drawn as a faint white cross on price
How to read it
• Above midline → overall volume bias is skewed bullish.
• Below midline → bearish volume bias.
Crossovers of vSignal through this midline can signal shifts in underlying conviction.
5. VWAP & 200-Period EMA Overlays
• VWAP (transparent red if above price, green if below)
• EMA(200) plotted as aqua circles
How to read them
• VWAP tells you the intraday “value area.”
• Price above VWAP + rising vSignal = intraday buyers in charge.
• Price below VWAP + rising vSignal = aggressive sellers.
• EMA(200) gives you the longer-term trend.
• Above EMA200 = bullish regime
• Below EMA200 = bearish regime
6. Putting It All Together: Example Scenarios
1. Bullish Entry
• Price > EMA200 & VWAP is green
• vSignal rising in lime
• All three short-term bursts above zero
• Price near or breaking the magenta pivot with volume confirmation
2. Bearish Entry
• Price < EMA200 & VWAP is red
• vSignal rising in orange
• Two-bar burst (blue) spikes on a down bar
• Price failing at magenta pivot or breaking cyan support
3. Divergence Play
• Price makes new high, but vSignal peaks lower than last high → look for a reversal.
• Price drops to new low, but vSignal stays above its last low → prepare for a bounce.
By combining these layers—normalized volume, burst indicators, pivot levels, VWAP, and EMA—you get a clear map of where volume is clustering, which lets you anticipate support/resistance, gauge real interest, and spot potential reversals or breakouts with greater confidence.

Market Entropy Strategy V2.5This strategy is an updated version of a market entropy-based trading system. It removes EMA dependencies and introduces two indicators:
1. **Volatility Momentum Index (VMI)**: Measures volatility acceleration for timing entries (from calm to active phases) and exits (at peak chaos).
2. **Volume-Weighted Price Center (VWPC)**: A volume-weighted trend filter using typical price to determine overall market direction.
The strategy enters trades on transitions from low volatility ("calm") to increasing activity, filtered by trend direction. Exits occur when volatility reaches a high "chaos" threshold. It supports long, short, or both directions, with configurable parameters for optimization.
Backtest results depend on market conditions; use with caution and combine with your own analysis. No guarantees of performance.

day trading check indicatorDay Trading Check Indicator
By Trades per Minute · Creator: Trader Malik
Overview
The Day Trading Check Indicator is an on‐chart status panel that gives you a quick “go/no-go” snapshot of four key metrics—MACD, VWAP, Float, and Bearish Sell-Off—directly in TradingView’s top-right corner. It’s designed for fast decision-making during high-velocity intraday sessions, letting you instantly see whether each metric is “bullish” (green) or “bearish” (red), plus live float data.
What It Shows
Column Description
Metric The name of each metric: MACD, VWAP, Float, Bearish Sell-Off
Status/Value A color-coded status (“GREEN”/“RED” or “YES”/“NO”) or the float value formatted in K/M/B
Metrics & Calculations
MACD (1-Minute)
Calculation: Standard MACD using EMA (12) – EMA (26) with a 9-period signal line, all fetched from the 1-minute timeframe via request.security().
Status:
GREEN if MACD ≥ Signal
RED if MACD < Signal
VWAP (Session-Anchored)
Calculation: Built-in session VWAP (ta.vwap(close)) resets each new trading session.
Status:
GREEN if current price ≥ VWAP
RED if current price < VWAP
Float
Calculation: Retrieves syminfo.shares_outstanding_float (total float), then scales it into thousands (K), millions (M), or billions (B), e.g. “12.3 M.”
Display: Always shown as the absolute float value, white on semi-transparent black.
Bearish Sell-Off
Calculation: Checks the last five 1-minute bars for any “high-volume down” candle (volume above its 20-bar SMA and close < open).
Status:
YES if at least one such bar occurred in the past 5 minutes
NO otherwise
Key Features
Dynamic Table: Automatically shows only the metrics you enable via the Display Options group.
Size Selector: Choose Small, Medium, or Large text for easy visibility.
Clean Styling: Distinct header row with custom background, consistent row shading, centered status text, and a subtle gray border.
Lightweight Overlay: No cluttering plots—just a concise status panel in the corner.
Published by Trader Malik / Trades per Minute
Version: Pine Script v5

Neuracap Gap AnalysisThe Neuracap Gap Analysis indicator is a comprehensive tool designed to identify and track price gaps, special candlestick patterns, and high-volume breakout signals. It combines multiple trading strategies into one powerful indicator for gap trading, pattern recognition, and momentum analysis.
🎯 What This Indicator Does
1. Gap Detection & Tracking
Automatically identifies price gaps (up and down)
Tracks gap fills with visual boxes that extend until closed
Manages gap history with customizable limits
Color-coded visualization (Green = Gap Up, Red = Gap Down)
2. Upside Tasuki Gap Pattern
Identifies the bullish continuation pattern
Colors candles yellow when pattern is detected
Confirms trend continuation signals
3. Episodic Pivot Detection
High-volume breakout identification
EMA filter ensures signals only in uptrends
Strong momentum confirmation
Fuchsia-colored candles with arrow markers
🔍 How to Use for Trading
📈 Gap Trading Strategy
Gap Up Trading:
Wait for gap up (green box appears)
Check volume - Higher volume = stronger signal
Entry options:
Aggressive: Enter at market open
Conservative: Wait for pullback to gap level
Stop loss: Below the gap fill level
Target: Previous resistance or 2:1 risk/reward
Gap Down Trading:
Identify gap down (red box appears)
Look for bounce opportunities
Entry: When price shows reversal signs
Stop: Below recent lows
Target: Gap fill level
💫 Tasuki Gap Strategy
Yellow candle indicates bullish continuation
Confirms uptrend is likely to continue
Entry: On next candle after pattern
Stop: Below the gap low
Target: Next resistance level
🚀 Episodic Pivot Strategy
Fuchsia candle + arrow = High probability breakout
All conditions met:
Price above EMA 20, 50, 200
High volume (2x+ average)
Strong price move (4%+)
Entry: At close or next open
Stop: Below EMA 20 or recent swing low
Target: Measured move or next resistance
📊 Reading the Visual Signals
Gap Boxes
🟢 Green Box: Gap up - potential bullish continuation
🔴 Red Box: Gap down - potential bounce or bearish continuation
Box extends until gap is filled
Box disappears when gap closes
Candle Colors
🟡 Yellow: Tasuki gap pattern (bullish continuation)
🟪 Fuchsia: Episodic pivot (high-volume breakout)
⬜ Normal: No special pattern detected
Arrows & Markers
⬆️ Triangle Arrow: Episodic pivot confirmation
💡 Trading Tips & Best Practices
✅ Do's
Combine with trend analysis - Trade gaps in direction of trend
Check volume - Higher volume = more reliable signals
Use multiple timeframes - Confirm on higher timeframes
Risk management - Always set stop losses
Wait for confirmation - Don't chase, let signals develop
❌ Don'ts
Don't trade all gaps - Focus on high-quality setups
Avoid low volume - Weak volume = unreliable signals
Don't ignore trend - Counter-trend trading is risky
Don't overtrade - Quality over quantity
Don't ignore context - Consider market conditions
⚠️ Risk Management
Position sizing: Risk 1-2% per trade
Stop losses: Always define before entry
Target levels: Set realistic profit targets
Market conditions: Avoid trading in choppy markets
📈 Performance Optimization
For Conservative Traders:
Increase minimum gap size to 1%
Set volume multiplier to 3.0x
Only trade episodic pivots in strong uptrends
Wait for gap fill confirmation
For Aggressive Traders:
Decrease minimum gap size to 0.3%
Set volume multiplier to 1.5x
Trade both gap types
Enter on pattern confirmation
🚨 Alert Setup
The indicator provides alerts for:
Gap Up Detected
Gap Down Detected
Upside Tasuki Gap
Episodic Pivot
Recommended: Enable all alerts and filter manually based on your strategy.
📝 Summary
This indicator excels at identifying high-probability trading opportunities through gap analysis, pattern recognition, and momentum confirmation. Use it as part of a complete trading system with proper risk management for best results.


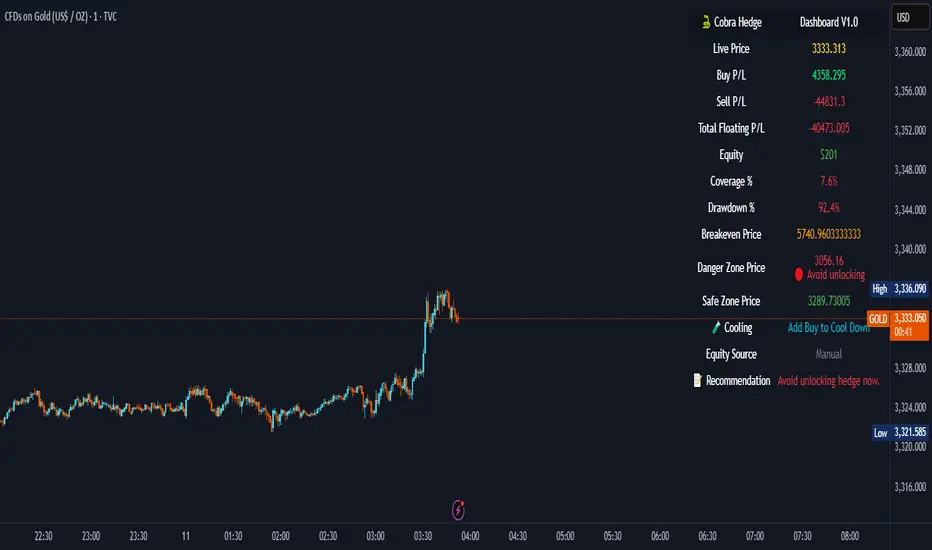
Cobra Hedge Dashboard – V1.0 Final Master🧠 Cobra Hedge Dashboard – V1.0 Final Master
V1.0 | Smart Risk Filter for Open Hedge Positions
📝 (Description):
Cobra Hedge Dashboard is built specifically for traders managing open hedge positions. It provides a real-time view of directional pressure, smart zones, and price behavior to help make informed decisions such as:
When to partially close hedge orders
When to reverse positions based on flow & exhaustion
Which side (Buy or Sell) currently has momentum
Detecting price reaching critical zones (Supply/Demand)
Measuring volume strength to avoid fake exits
🔍 Ideal for traders already in the market — this dashboard is not an entry signal system, but a tool to manage hedge exits and exposure.
Built-in calculations include:
VWAP and EMA cross-pressure
Directional flow meter
Auto Supply & Demand Zones
Volume spikes and breakout strength
Best used on 1m–15m charts.
Open-source for transparency and improvement.
COBRA X Mastermind – Ultimate Smart Panel✅ COBRA X Mastermind – Ultimate Smart Panel
COBRA X Mastermind – Ultimate Panel | Structure, Volume, Signals & Smart Entry
📝 (Description):
COBRA X Mastermind is a precision smart panel for reading market structure, detecting high-quality entries and visualizing critical components in one screen:
Detect Break of Structure (BoS) and CHoCH with context
Auto-mark Order Blocks and Fair Value Gaps (FVGs)
Volume Spike & VWAP alignment for smart trend confirmation
Directional bias from EMA + Dynamic Flow analysis
Hidden divergence detection to anticipate trap moves
Built-in Signal Strength meter with real-time TP/SL suggestion
Each row in the panel reflects a real-time reading of price action, structure, volume, and entry risk.
🔍 How to use it:
Look for a valid signal only when structure + volume + divergence are in agreement. Use the panel strength bar to validate setups.
This script is open-source and optimized for 1m and 5m charts, especially on Gold and FX pairs.
Clean, non-repainting, and built for professional scalpers.

ds-Volume with Flags & Alerts v1.2ds-Volume with Flags & Alerts: User & Training Guide
1. Summary of Features
This indicator is a powerful, all-in-one tool designed to give you a deep and customizable view of market volume. By analyzing volume in multiple ways, it helps you spot unusual activity, confirm trends, and identify potential reversals.
How It Helps a Trader:
Spotting Institutional Activity: The core purpose of the Volume Flags (using either the Multiplier or Standard Deviation method) is to highlight bars with exceptionally high volume. These spikes often signal the entry or exit of large institutional players. A high-volume up-bar can confirm bullish conviction, while a high-volume down-bar can signal significant selling pressure.
Identifying Climactic Events: The HVE (Highest Volume Ever) and HV1 (Highest Volume - 1 Year) labels automatically pinpoint the most significant volume events on the chart. A "blow-off top" at the end of a long uptrend or a "capitulation" event at a market bottom is almost always accompanied by an HVE or HV1 bar. These are critical moments to watch for potential trend reversals.
Gauging Buying vs. Selling Pressure: The Up/Down Volume Ratio gives you a more nuanced view than volume alone. A ratio consistently above 1.2 suggests that buyers are more aggressive, while a ratio below 0.8 suggests sellers are in control. Watching this ratio can help you confirm the strength of a trend or spot divergences where price is rising but the ratio is falling (a potential warning sign).
Visual Confirmation & Customization: With options to color both the volume bars and the main price bars, you can get instant visual confirmation of these events without having to look away from the price action. The ability to toggle features on and off keeps your chart clean and focused on what matters most to you.
Actionable Alerts: The comprehensive alert system ensures you don't miss a key event. You can be notified of everything from a new all-time high volume bar to a subtle shift in the Up/Down Volume Ratio, allowing you to react to market changes in real-time.
2. User-Changeable Options
This indicator is highly customizable. Here is a breakdown of every setting available in the "Inputs" tab.
General Settings
MA Length: The lookback period for the simple moving average (the gray area plot) of the volume.
Volume Flags
Color Price Bars with Flags: If checked, the main price bars on your chart will be colored when a high or low volume flag condition is met.
Color Volume Bars with Flags: If checked, the volume bars in the indicator pane will be colored for flag conditions.
Flag Calculation Method: This is a crucial setting.
Multiplier (Default): Identifies high volume based on a simple multiple of the average volume (e.g., volume is 1.4x its average). It's simple and intuitive.
Standard Deviation: Identifies high volume based on how statistically unusual it is compared to its recent behavior. This method is more adaptive to changing market volatility.
Daily/Weekly Lookback (Multiplier): Sets the lookback period for calculating the average volume when using the "Multiplier" method.
Daily/Weekly High-Vol Multiplier: Sets the multiplier for a high volume event (e.g., 1.4).
STDEV Length (Daily/Weekly): Sets the lookback period for calculating the average and standard deviation when using the "Standard Deviation" method.
STDEV Threshold (Daily/Weekly): Sets the number of standard deviations above the average required to trigger a high volume flag (e.g., 2.0).
Daily/Weekly Low-Vol Multiplier: Sets the threshold for a low volume event (e.g., 0.5 means volume is less than 50% of its average). This is always based on the multiplier method.
Ratios & Stats
Up/Down Ratio Daily/Weekly Lookback: Sets the lookback period for calculating the sum of up volume and down volume for the ratio.
Ratio Calculation Method:
Close vs. Open: Defines an "up volume" bar as one where the close is higher than the open.
Close vs. Previous Close (Default): Defines an "up volume" bar as one where the close is higher than the previous bar's close. This is a common standard.
Up Ratio Arrow Threshold: If the U/D Ratio exceeds this value, a green "up" arrow will appear.
Show Up Ratio Arrow: Toggles the visibility of the green "up" arrow.
Down Ratio Arrow Threshold: If the U/D Ratio falls below this value, a red "down" arrow will appear.
Show Down Ratio Arrow: Toggles the visibility of the red "down" arrow.
