BTC Spot Aggregated Volume + 20EMAThe purpose of this indicator is to provide a more comprehensive view of Bitcoin's spot market activity by combining volume data from several sources.
1. Fetches and aggregates spot volume data for BTC from the following exchanges:
Binance (BTCUSDT)
Coinbase (BTCUSD)
Kraken (BTCUSD)
Bitfinex (BTCUSD)
Bitstamp (BTCUSD)
KuCoin (BTCUSDT)
Gate.io (BTCUSDT)
OKX (BTCUSDT)
Huobi (BTCUSDT)
2. Calculates a 20-period EMA on the aggregated volume to smooth out the data and identify volume trends.
This indicator is particularly useful for traders who want a broader view of real BTC spot market activity, rather than relying on a single exchange's data, which might be misleading or incomplete. By averaging across major exchanges, the indicator helps reduce noise and gives a more accurate picture of volume trends.
Volume

Easy MA SignalsEasy MA Signals
Overview
Easy MA Signals is a versatile Pine Script indicator designed to help traders visualize moving average (MA) trends, generate buy/sell signals based on crossovers or custom price levels, and enhance chart analysis with volume-based candlestick coloring. Built with flexibility in mind, it supports multiple MA types, crossover options, and customizable signal appearances, making it suitable for traders of all levels. Whether you're a day trader, swing trader, or long-term investor, this indicator provides actionable insights while keeping your charts clean and intuitive.
Configure the Settings
The indicator is divided into three input groups for ease of use:
General Settings:
Candlestick Color Scheme: Choose from 10 volume-based color schemes (e.g., Sapphire Pulse, Emerald Spark) to highlight high/low volume candles. Select “None” for TradingView’s default colors.
Moving Average Length: Set the MA period (default: 20). Adjust for faster (lower values) or slower (higher values) signals.
Moving Average Type: Choose between SMA, EMA, or WMA (default: EMA).
Show Buy/Sell Signals: Enable/disable signal plotting (default: enabled).
Moving Average Crossover: Select a crossover type (e.g., MA vs VWAP, MA vs SMA50) for signals or “None” to disable.
Volume Influence: Adjust how volume impacts candlestick colors (default: 1.2). Higher values make thresholds stricter.
Signal Appearance Settings:
Buy/Sell Signal Shape: Choose shapes like triangles, arrows, or labels for signals.
Buy/Sell Signal Position: Place signals above or below bars.
Buy/Sell Signal Color: Customize colors for better visibility (default: green for buy, red for sell).
Custom Price Alerts:
Custom Buy/Sell Alert Price: Set specific price levels for alerts (default: 0, disabled). Enter a non-zero value to enable.
Set Up Alerts
To receive notifications (e.g., sound, popup, email) when signals or custom price levels are hit:
Click the Alert button (alarm clock icon) in TradingView.
Select Easy MA Signals as the condition and choose one of the four alert types:
MA Crossover Buy Alert: Triggers on MA crossover buy signals.
MA Crossover Sell Alert: Triggers on MA crossover sell signals.
Custom Buy Alert: Triggers when price crosses above the custom buy price.
Custom Sell Alert: Triggers when price crosses below the custom sell price.
Enable Play Sound and select a sound (e.g., “Bell”).
Set the frequency (e.g., Once Per Bar Close for confirmed signals) and create the alert.
Analyze the Chart
Moving Average Line: Displays the selected MA with color changes (green for bullish, red for bearish, gray for neutral) based on price position relative to the MA.
Buy/Sell Signals: Appear as shapes or labels when crossovers or custom price levels are hit.
Candlestick Colors: If a color scheme is selected, candles change color based on volume strength (high, low, or neutral), aiding in trend confirmation.
Why Use Easy MA Signals?
Easy MA Signals is designed to simplify technical analysis while offering advanced customization. It’s ideal for traders who want:
A clear visualization of MA trends and crossovers.
Flexible signal generation based on MA crossovers or custom price levels.
Volume-enhanced candlestick coloring to identify market strength.
Easy-to-use settings with tooltips for beginners and pros alike.
This script is particularly valuable because it combines multiple features into one indicator, reducing chart clutter and providing actionable insights without overwhelming the user.
Benefits of Easy MA Signals
Highly Customizable: Supports SMA, EMA, and WMA with adjustable lengths.
Offers multiple crossover options (VWAP, SMA10, SMA20, etc.) for tailored strategies.
Custom price alerts allow precise targeting of key levels.
Volume-Based Candlestick Coloring: 10 unique color schemes highlight volume strength, helping traders confirm trends.
Adjustable volume influence ensures adaptability to different markets.
Flexible Signal Visualization: Choose from various signal shapes (triangles, arrows, labels) and positions (above/below bars).
Customizable colors improve visibility on any chart background.
Alert Integration: Built-in alert conditions for crossovers and custom prices support sound, email, and app notifications.
Easy setup for real-time trading decisions.
User-Friendly Design: Organized input groups with clear tooltips make configuration intuitive.
Suitable for beginners and advanced traders alike.
Example Use Cases
Swing Trading with MA Crossovers:
Scenario: A trader wants to trade Bitcoin (BTC/USD) on a 4-hour chart using an EMA crossover strategy.
Setup:
Set Moving Average Type to EMA, Length to 20.
Set Moving Average Crossover to “MA vs SMA50”.
Enable Show Buy/Sell Signals and choose “arrowup” for buy, “arrowdown” for sell.
Select “Emerald Spark” for candlestick colors to highlight volume surges.
Usage: Buy when the EMA20 crosses above the SMA50 (green arrow appears) and volume is high (dark green candles). Sell when the EMA20 crosses below the SMA50 (red arrow). Set alerts for real-time notifications.
Scalping with Custom Price Alerts:
Scenario: A day trader monitors Tesla (TSLA) on a 5-minute chart and wants alerts at specific support/resistance levels.
Setup:
Set Custom Buy Alert Price to 150.00 (support) and Custom Sell Alert Price to 160.00 (resistance).
Use “labelup” for buy signals and “labeldown” for sell signals.
Keep Moving Average Crossover as “None” to focus on price alerts.
Usage: Receive a sound alert and label when TSLA crosses 150.00 (buy) or 160.00 (sell). Use volume-colored candles to confirm momentum before entering trades.
When NOT to Use Easy MA Signals
High-Frequency Trading: Reason: The indicator relies on moving averages and volume, which may lag in ultra-fast markets (e.g., sub-second trades). High-frequency traders may need specialized tools with real-time tick data.
Alternative: Use order book or market depth indicators for faster execution.
Low-Volatility or Sideways Markets:
Reason: MA crossovers and custom price alerts can generate false signals in choppy, range-bound markets, leading to whipsaws.
Alternative: Use oscillators like RSI or Bollinger Bands to trade within ranges.
This indicator is tailored more towards less experienced traders. And as always, paper trade until you are comfortable with how this works if you're unfamiliar with trading! We hope you enjoy this and have great success. Thanks for your interested in Easy MA Signals!

Sweep Reversal 5M PRO – by [TuNombre]🔹 **Sweep Reversal 5M PRO – by ** 🔹
This indicator is built to detect high-probability *Institutional Sweeps* using Swing Failure Patterns (SFP), fully filtered with Smart Money Concepts (SMC) logic and volume confirmation.
✅ Identifies key liquidity grabs
✅ Confirms with strong impulse candle + increasing volume
✅ Filters out false signals (doji, weak zones, low volume)
✅ Optimized for the 5-minute timeframe (5M)
✅ Compatible with push alerts to your mobile
---
**How to use it:**
1. Wait for a “BUY” or “SELL” signal on the chart
2. Only enter if the next candle confirms with momentum
3. Place a tight stop just beyond the sweep
4. Recommended Take Profit: 1:1 minimum / 2:1 ideal
---
💡 Inspired by institutional trading (SMC, ICT-style setups)
🔒 Developed by – private or team-based use
📲 Activate alerts to get real-time trade opportunities on your phone
---
⚠️ This script does not repaint.
Built for serious traders who want precision, not noise.

Volume Weighted Median Price (VWMP)The volume is indeed crucial for confirming price moves and understanding market conviction. While many traders are familiar with VWAP (Volume Weighted Average Price), this indicator introduces a lesser-known but powerful cousin: the Volume Weighted Median Price (VWMP).
What is VWMP?
Unlike VWAP, which calculates the average price weighted by volume over a period, VWMP identifies the median price level weighted by volume.
Think of it this way: If you line up all the trades within a specific lookback period, sorted by price, and then start accumulating the volume traded at each price level, the VWMP is the price level where 50% of the total volume occurred below it, and 50% occurred above it.
It essentially finds the "middle ground" of trading activity based on where the bulk of the volume actually traded, not just the average price.
Key Difference: VWMP vs. VWAP
VWAP: Volume Weighted Average Price. Sensitive to outliers (single large trades at extreme prices can skew the average).
VWMP: Volume Weighted Median Price. More robust to outliers. It represents the price that splits the period's volume distribution in half.
Because it uses the median, VWMP can sometimes provide a more stable or representative level of the "typical" price where significant volume is changing hands, especially in volatile markets or when large, anomalous trades occur.
How to Interpret and Use VWMP in trading
The VWMP plots as a line on your chart, similar to a moving average or VWAP. Here are a few ways traders might use it:
Dynamic Support and Resistance:
Like VWAP, the VWMP line can act as a dynamic level of interest.
Watch how price interacts with the VWMP. Consistent acceptance above VWMP might suggest bullish control and potential support.
Consistent rejection or acceptance below VWMP might indicate bearish control and potential resistance.
Trend Filter / Confirmation:
Uptrend: Look for price consistently staying above the VWMP line. Pullbacks to the VWMP that hold could offer entry opportunities.
Downtrend: Look for price consistently staying below the VWMP line. Rallies to the VWMP that fail could present shorting opportunities.
Use it to filter trades: Only take long trades if price is above VWMP, and short trades if below.
Mean Reversion Potential (Use with Caution):
When price extends significantly far away from the VWMP, some traders might look for potential reversion back towards this volume-based median level.
Important: This should not be used in isolation. Always look for confirmation from other indicators (like RSI, Stochastics, or candlestick patterns) before trading counter-trend reversions.
Confluence with Other Indicators:
VWMP works best when combined with other analysis tools.
Look for confluence: Does the VWMP align with a key Fibonacci level, a standard moving average, or a prior support/resistance zone? This confluence strengthens the level's potential significance.
Considerations
Lookback Period: The length input is crucial. A shorter period makes VWMP more responsive to recent action; a longer period makes it smoother and reflects longer-term volume distribution. Experiment to find what suits your timeframe and trading style.
Lagging Nature: Like all indicators based on past data, VWMP is inherently lagging. It reflects past volume distribution, not the future.
Market Context: Its effectiveness can vary depending on the market conditions (trending vs. ranging) and the asset being traded.

VolVolVolVol: Volatility & Volume
The indicator consists of 3 oscillating components that are all represented on a positive/negative percentage scale.
Direction : Green/Red shaded area
Smoothened distance between Close and EMA of Close relative to StDev of Close
Intensity : Turquoise line
If direction = bullish: Smoothened distance between Low and EMA of Low relative to StDev of Low
If direction = bearish: Smoothened distance between High and EMA of High relative to StDev of High
Momentum : Fuchsia line
Double exponential average of bullish closing volume - bearish closing volume
The indicator provides the following signals on the candlestick charts based on the above components' movements.
Bullish position signals: Below candles
Bearish position signals: Above candles
Entry signal : Increase in all 3 factors or sharp increase in Intensity + Momentum
Add signal : Trend slowdown because of volume drop or retracement following a temporary consolidation
Exit signal : Increase in Intensity and Momentum against the prevailing trend direction
There may be simultaneous Bullish and Bearish signals. These should be treated as hedges for existing positions.

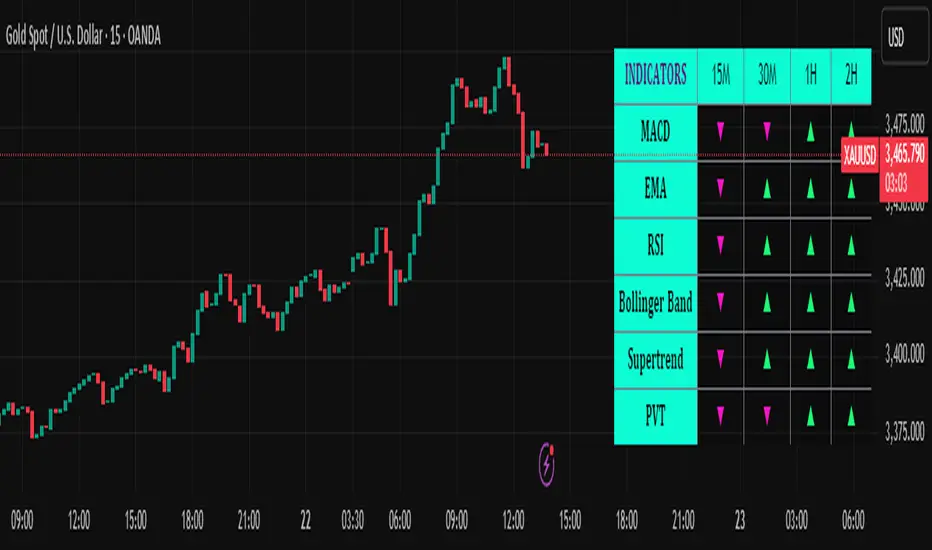
Trend Matrix Multi-Timeframe Dashboard(TechnoBlooms)Trend Matrix Multi-Timeframe Dashboard is a Minimalist Multi-Timeframe Trend Analyzer with Smart Indicator Integration. Trend Matrix MTF Dashboard is a clean, efficient, and visually intuitive trend analyzer built for traders who value simplicity without compromising on technical depth.
This dashboard empowers you to track trend direction across multiple timeframes using a curated set of powerful technical indicators—all from one compact visual panel. The design philosophy is simple: eliminate clutter, highlight trend clarity, and accelerate your decision-making process.
Key Features
✅ Minimalist Design with Maximum Insight
A compact dashboard view designed for clean charts and focused trading
Optimized layout shows everything you need—nothing you don’t
✅ Multi-Timeframe Access at a Glance
Instantly read the trend direction of selected indicators on multiple timeframes (e.g., 15m, 1h, 4h, 1D)
Customize the timeframe stack to fit scalping, intraday, swing, or positional strategies
✅ Robust Technical Indicators Built In
Each one is hand-picked for trend reliability:
MACD – Momentum and crossover confirmation
RSI – Overbought/oversold and directional shift
EMA – Dynamic support/resistance and trend bias
Bollinger Bands – Volatility structure and trend containment
PVT – Volume-Weighted Trend Confirmation
Supertrend – Price-following trend tracker
✅ Live Updates & Lightweight Performance
Built to update efficiently on every bar close
Minimal performance impact even with multiple timeframes active
By offering multi-timeframe (MTF) access to proven trend-following indicators, Trend Matrix helps you confidently align with the market’s dominant direction—without jumping between charts or analyzing indicators one by one.
This indicator offers customizable settings. The trader can choose the input parameters timeframes as per the choice.
Trend Matrix Multi-Timeframe Dashboard helps traders to identify trend based on technical indications. Trader can refer this while taking trading decisions.
🧠 Ideal For
Scalpers who need higher timeframe confirmation
Swing traders identifying clean entries aligned with the macro trend
Trend followers seeking clarity before committing capital
Price action & SMC traders validating market structure setups
Beginners who want a high-level trend guide without messy indicators
TDO & Hit Rates by Weekday (5 min)Purpose
Tracks how often the next NY session “hits” the previous day’s True Day Open (TDO) level, separately for sessions that open above vs. below TDO, and breaks the statistics down by weekday (Mon–Fri) plus an overall summary.
Key Features
True Day Open (TDO) Plot
Captures the prior day’s 23:00 CT close price as the TDO.
Plots it as a continuous yellow line across your chart.
Session Labeling
At the end of each NY session (08:30–15:00 CT), places a small “TDO” label at the TDO price to confirm visually where it lay during that day.
Hit‑Count Logic
For each 5 min bar in the NY session, checks if the bar’s high ≥ TDO ≥ low (i.e. the TDO level was “hit”).
Classifies each session by whether its opening price (first 5 min bar) was above or below the TDO.
Weekday Statistics Table
Displays in the bottom‑left of your main chart window.
Rows: Header, Mon, Tue, Wed, Thu, Fri, All.
Columns:
% Hit Above: % of “above‑TDO” sessions that saw at least one hit
% Hit Below: % of “below‑TDO” sessions that saw at least one hit
Automatically updates in real time as new sessions complete.
Inputs & Settings
Data Resolution: Default = 5 min; use any intraday timeframe you like (1, 3, 15 min, etc.).
Extended Hours: Make sure your chart’s Extended Session (overnight) is enabled so the 23:00 CT bar exists.
Overlay: Draws directly on your price chart (no separate pane).
How to Use
Add to Chart: Paste the Pine v5 code into TradingView’s editor and apply to your ES (or other) futures chart.
Enable Overnight Bars: In Chart Settings → Symbol/Session → include Extended Hours.
Select Timeframe: Set the chart (or the indicator’s “Data Resolution” input) to 5 min (or your preferred intraday).
Read the Table:
Each weekday row shows how reliable TDO touches have been historically, separately for “above” and “below” opens.
The bottom “All” row summarizes combined performance.
What You Learn
Edge Analysis: Do sessions opening above TDO tend to test that level more often than those opening below (or vice versa)?
Day‑of‑Week Bias: Are certain weekdays more prone to TDO retests?
Overall Confidence: The “All” row lets you see your full-sample hit‑rate on both sides.

Options Volume ProfileOptions Volume Profile
Introduction
Unlock institutional-level options analysis directly on your charts with Options Volume Profile - a powerful tool designed to visualize and analyze options market activity with precision and clarity. This indicator bridges the gap between technical price action and options flow, giving you a comprehensive view of market sentiment through the lens of options activity.
What Is Options Volume Profile?
Options Volume Profile is an advanced indicator that analyzes call and put option volumes across multiple strikes for any symbol and expiration date available on TradingView. It provides a real-time visual representation of where money is flowing in the options market, helping identify potential support/resistance levels, market sentiment, and possible price targets.
Key Features
Comprehensive Options Data Visualization
Dynamic strike-by-strike volume profile displayed directly on your chart
Real-time tracking of call and put volumes with custom visual styling
Clear display of important value areas including POC (Point of Control)
Value Area High/Low visualization with customizable line styles and colors
BK Daily Range Identification
Secondary lines marking significant volume thresholds
Visual identification of key strike prices with substantial options activity
Value Area Cloud Visualization
Configurable cloud overlays for value areas
Enhanced visual identification of high-volume price zones
Detailed Summary Table
Complete breakdown of call and put volumes per strike
Percentage analysis of call vs put activity for sentiment analysis
Color-coded volume data for instant pattern recognition
Price data for both calls and puts at each strike
Custom Strike Selection
Configure strikes above and below ATM (At The Money)
Flexible strike spacing and rounding options
Custom base symbol support for various options markets
Use Cases
1. Identifying Key Support & Resistance
Visualize where major options activity is concentrated to spot potential support and resistance zones. The POC and Value Area lines often act as magnets for price.
2. Analyzing Market Sentiment
Compare call versus put volume distribution to gauge directional bias. Heavy call volume suggests bullish sentiment, while heavy put volume indicates bearish positioning.
3. Planning Around Institutional Activity
Volume profile analysis reveals where professional traders are positioning themselves, allowing you to align with or trade against smart money.
4. Setting Precise Targets
Use the POC and Value Area High/Low lines as potential profit targets when planning your trades.
5. Spotting Unusual Options Activity
The color-coded volume table instantly highlights anomalies in options flow that may signal upcoming price movements.
Customization Options
The indicator offers extensive customization capabilities:
Symbol & Data Settings : Configure base symbol and data aggregation
Strike Selection : Define number of strikes above/below ATM
Expiration Date Settings : Set specific expiry dates for analysis
Strike Configuration : Customize strike spacing and rounding
Profile Visualization : Adjust offset, width, opacity, and height
Labels & Line Styles : Fully configurable text and visual elements
Value Area Settings : Customize POC and Value Area visualization
Secondary Line Settings : Configure the BK Daily Range appearance
Cloud Visualization : Add colored overlays for enhanced visibility
How to Use
Apply the indicator to your chart
Configure the expiration date to match your trading timeframe
Adjust strike selection and spacing to match your instrument
Use the volume profile and summary table to identify key levels
Trade with confidence knowing where the real money is positioned
Perfect for options traders, futures traders, and anyone who wants to incorporate institutional-level options analysis into their trading strategy.
Take your trading to the next level with Options Volume Profile - where price meets institutional positioning.

Volume-Price Momentum IndicatorVolume-Price Momentum Indicator (VPMI)
Overview
The Volume-Price Momentum Indicator (VPMI), developed by Kevin Svenson , is a powerful technical analysis tool designed to identify strong bullish and bearish momentum in price movements, driven by volume dynamics. By analyzing price changes and volume surges over a user-defined lookback period, VPMI highlights potential trend shifts and continuation patterns through a smoothed histogram, optional labels, and background highlights. Ideal for traders seeking to capture momentum-driven opportunities, VPMI is suitable for various markets, including stocks, forex, and cryptocurrencies.
How It Works
VPMI calculates the difference between volume-weighted buying and selling pressure based on price changes over a specified lookback period. It amplifies signals during high-volume periods, applies smoothing to reduce noise, and uses momentum checks to detect sustained trends.
Indicator display:
A histogram that oscillates above (bullish) or below (bearish) a zero line, with brighter colors indicating stronger momentum and faded colors for weaker signals.
Optional labels ("Bullish" or "Bearish") to mark significant momentum shifts.
Optional background highlights to visually emphasize strong trend conditions.
Alerts to notify users when strong bullish or bearish momentum is detected.
Key Features
Customizable Settings:
Adjust the lookback period, volume threshold, momentum length, and smoothing to suit your trading style.
Volume Sensitivity:
Emphasizes price movements during high-volume surges, enhancing signal reliability.
Momentum Detection: Uses linear regression and momentum change to confirm sustained trends, reducing false signals.
Visual Clarity:
Offers a clear histogram with color-coded signals, plus optional labels and backgrounds for enhanced chart readability.
Alerts:
Configurable alerts for strong momentum signals, enabling timely trade decisions.
Inputs and Customization
Lookback Period (Default: 9):
Sets the number of bars to analyze price changes. Higher values smooth signals but may lag.
Volume Threshold (Default: 1.4):
Defines the volume level (relative to a 20-period SMA) that qualifies as a surge, amplifying signals.
High Volume Multiplier (Default: 1.5):
Boosts histogram values during high-volume periods for stronger signals.
Histogram Smoothing Length (Default: 4):
Controls the EMA smoothing applied to the histogram, reducing noise.
Momentum Check Length (Default: 4):
Sets the period for momentum trend analysis (recommended to be less than Lookback Period).
Momentum Threshold (Default: 6):
Defines the minimum momentum change required for strong signals.
Show Labels (Default: Off):
Toggle to display "Bullish" or "Bearish" labels on significant momentum shifts.
Show Backgrounds (Default: Off):
Toggle to highlight chart backgrounds during strong momentum periods.
Bullish/Bearish Colors:
Customize colors for bullish (default: green) and bearish (default: red) signals.
Faded Transparency (Default: 40):
Adjusts the transparency of weaker signals for visual distinction.
How to Use
Interpret Signals:
Above Zero (Green):
Indicates bullish momentum. Bright green suggests strong, sustained buying pressure.
Below Zero (Red):
Indicates bearish momentum. Bright red suggests strong, sustained selling pressure.
Faded Colors:
Weaker momentum, potentially signaling consolidation or trend exhaustion.
Enable Visuals:
Turn on "Show Labels" and "Show Backgrounds" in the settings for additional context on strong momentum signals.
Set Alerts:
Use the built-in alert conditions ("Strong Bullish Momentum" or "Strong Bearish Momentum") to receive notifications when significant trends emerge.
Combine with Other Tools:
Pair VPMI with support/resistance levels, trendlines, or other indicators (e.g., RSI, MACD) for confirmation.
Best Practices
Timeframe:
VPMI works on all timeframes, but shorter timeframes (e.g., 5m, 15m) may produce more signals, while longer timeframes (e.g., 1h, 4h, 1D) offer higher reliability.
Market Conditions:
Most effective in trending markets. In choppy or sideways markets, consider increasing the smoothing length or momentum threshold to filter noise.
Risk Management:
Always use VPMI signals in conjunction with a robust trading plan, including stop-losses and position sizing.
Limitations
Lagging Nature:
As a momentum indicator, VPMI may lag in fast-moving markets due to smoothing and lookback calculations.
False Signals:
In low-volume or ranging markets, signals may be less reliable. Adjust the volume threshold or momentum settings to improve accuracy.
Customization Required:
Optimal settings vary by asset and timeframe. Experiment with inputs to align with your trading strategy.
Why Use VPMI?
VPMI offers a unique blend of volume and price momentum analysis, making it a versatile tool for traders seeking to identify high-probability trend opportunities. Its customizable inputs, clear visuals, and alert capabilities empower users to tailor the indicator to their needs, whether for day trading, swing trading, or long-term analysis.
Get Started
Apply VPMI to your chart, tweak the settings to match your trading style, and start exploring momentum-driven opportunities. For questions or feedback, consult TradingView’s community forums or documentation. Happy trading!

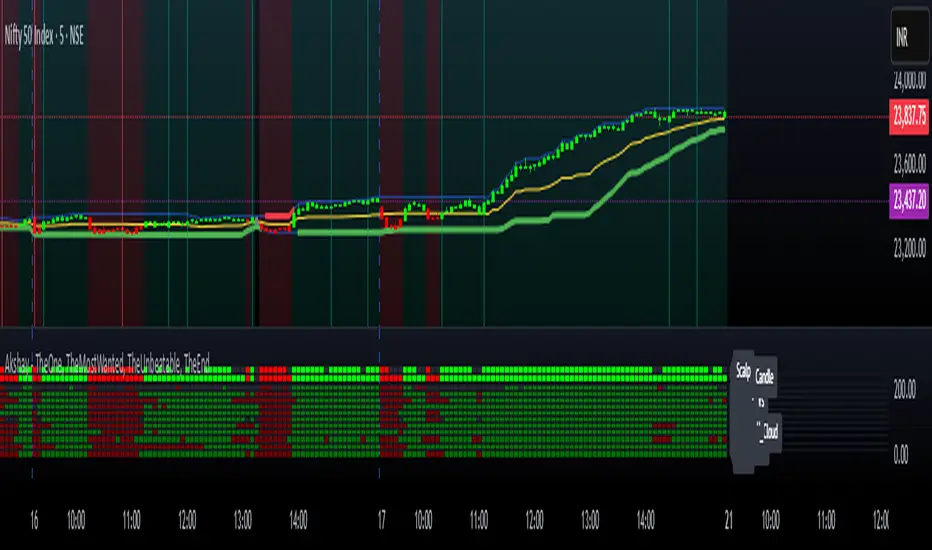
Akshay - TheOne, TheMostWanted, TheUnbeatable, TheEnd➤ All-in-One Solution (❌ No repaint):
This Technical Chart contains, MA24 Condition, Supertrend Indicator, HalfTrend Signal, Ichimoku Cloud Status, Parabolic SAR (P_SAR), First 5-Minute Candle Analysis (ORB5min), Volume-Weighted Moving Average (VWMA), Price-Volume Trend (PVT), Oscillator Composite, RSI Condition, ADX & Trend Strength.
Technicals don't lie.
🚀 Overview and Key Features
Comprehensive Multi-Indicator Approach:
The script is built to be an all-in-one technical indicator on TradingView. It integrates several well-known indicators and overlays—including Supertrend, HalfTrend, Ichimoku Cloud, various moving averages (EMA, SMA, VWMA), oscillators (Klinger, Price Oscillator, Awesome Oscillator, Chaikin Oscillator, Ultimate Oscillator, SMI Ergodic Oscillator, Chande Momentum Oscillator, Detrended Price Oscillator, Money Flow Index), ADX, and Donchian Channels—to create a composite picture of market sentiment.
Signal Generation and Alerts:
It not only calculates these indicators but also aggregates their output into “Master Candle” signals. Vertical lines are drawn on the chart with corresponding alerts to indicate potential buy or sell opportunities based on robust, combined conditions.
Visual Layering:
Through the use of colored histograms, custom candle plots, trend lines, and background color changes, the script offers a multi-layered visual representation of data, providing clarity about both short-term signals and overall market trends.
⚙️ How It Works and Functionality
MA24 Condition:
Uses the 24-period moving average as a proxy; if the price is above it, the bar is colored green, and red if below, with neutrality when conditions aren’t met.
Supertrend Indicator:
Evaluates price relative to the Supertrend level (calculated via ATR), coloring green when price is above it and red when below.
HalfTrend Signal:
Determines trend shifts by comparing the current close to a calculated trend level; green indicates an upward trend, while red suggests a downtrend.
Ichimoku Cloud Status:
Analyzes the relationship between the Conversion and Base lines; a bullish (green) signal is given when price is above both or the Conversion line is higher than the Base line.
Parabolic SAR (P_SAR):
Colors the signal based on whether the current price is above (green) or below (red) the Parabolic SAR marker, indicating stop and reverse conditions.
First 5-Minute Candle Analysis (ORB5min):
Uses key levels from the first 5-minute candle; if price exceeds the candle’s low, VWAP, and MA, it’s bullish (green), otherwise bearish (red).
Volume-Weighted Moving Average (VWMA):
Compares the current price to volume-weighted averages; a price above these levels is shown in green, below in red.
Price-Volume Trend (PVT):
Determines bullish or bearish momentum by comparing PVT to its VWAP—green when above and red when below.
Oscillator Composite:
Aggregates signals from multiple oscillators; a majority of positive results turn it green, while negative dominance results in red.
RSI Condition:
Uses a simple RSI threshold of 50, with values above signifying bullish (green) momentum and below marking bearish (red) conditions.
ADX & Trend Strength:
Reflects overall trend strength through ADX and directional movements; a combination favoring bullish conditions colors it green, with red signaling bearish pressure.
Master Candle Overall Signal:
Combines multiple indicator outputs into one “Master” signal—green for a consensus bullish trend and red for a bearish outlook.
Scalp Signal Variation:
Focused on short-term price changes, this signal adjusts quickly; green indicates improving short-term conditions, while red signals a downturn.
📊 Visualizations and 🎨 User Experience (❌ no repaint)
Dynamic Histograms & Bar Plots:
Each indicator is represented as a colored bar (with added vertical offsets) to facilitate easy comparison of their respective bullish or bearish contributions.
Clear Color-Coding & Labels:
Green (e.g., GreenFluorescent) indicates bullish sentiment.
Red (e.g., RedFluorescent) indicates bearish sentiment.
Custom labels and descriptive text accompany each bar for clarity.
Interactive Charting:
The overall background color adapts based on the “Master Candle” condition, offering an instant read on market sentiment.
The current candlestick is overlaid with color cues to reinforce the indicator’s signal, enhancing the trading experience.
Real-Time Alerts:
Vertical lines appear on signal events (buy/sell triggers), complemented by alerts that help traders stay on top of actionable market moves.
Sharp lines:
The Sharp lines are plotted based upon the EMA5 cross over with the same market trend, marks this as good time to reentry.
🔧 Settings and Customization
Flexible Timeframe Input:
Users can select their preferred timeframe for analysis, making the indicator adaptable to intraday or longer-term trading styles.
Customizable Indicator Parameters:
➤ Supertrend: Adjust ATR length and multiplier factors.
➤ HalfTrend: Tweak amplitude and channel deviation settings.
➤ Ichimoku Cloud & Oscillators: Fine-tune the conversion/base lines and oscillator lengths to match individual trading strategies.
Visual Customization:
The script’s color schemes and plotting styles can be altered as needed, giving users the freedom to tailor the interface to their taste or existing chart setups.
🌟 Uniqueness of the Concept
Integrated Multi-Indicator Synergy:
Combines a diverse range of trend, momentum, and volume-based indicators into a single cohesive system for a holistic market view.
Master Candle Aggregation:
Consolidates numerous individual signals into a "Master Candle" that filters out noise and provides a clear, consensus-based trading signal.
Layered Visual Feedback:
Uses color-coded histograms, adaptive background cues, and dynamic overlays to deliver a visually intuitive guide to market sentiment at a glance.
Customization and Flexibility:
Offers adjustable parameters for each indicator, allowing users to tailor the system to fit diverse trading styles and market conditions.
✅ Conclusion:
Robust Trading Tool & Non-Repainting Reliability:
This versatile technical analysis tool computes an extensive range of indicators, aggregates them into a stable, non-repainting “Master Candle” signal, and maintains consistent, verifiable outputs on historical data.
Holistic Market Insight & Consistent Signal Generation:
By combining trend detection, momentum oscillators, and volume analysis, the indicator delivers a comprehensive snapshot of market conditions and generates dependable signals across varying timeframes.
User-Centric Design with Rich Visual Feedback:
Customizable settings, clear color-coded outputs, adaptive backgrounds, and real-time alerts work together to provide actionable, transparent feedback—enhancing the overall trading experience.
A Unique All-in-One Solution:
The integrated approach not only simplifies complex market dynamics into an easy-to-read visual guide but also empowers systematic traders with a powerful, adaptable asset for accurate decision-making.
❤️ Credits:
Pine Script™ User Manual
Supertrend
Ichimoku Cloud
Parabolic SAR
Price Volume Trend (PVT)
Average Directional Index (ADX)
Volume Oscillator
HalfTrend
Donchian Trend
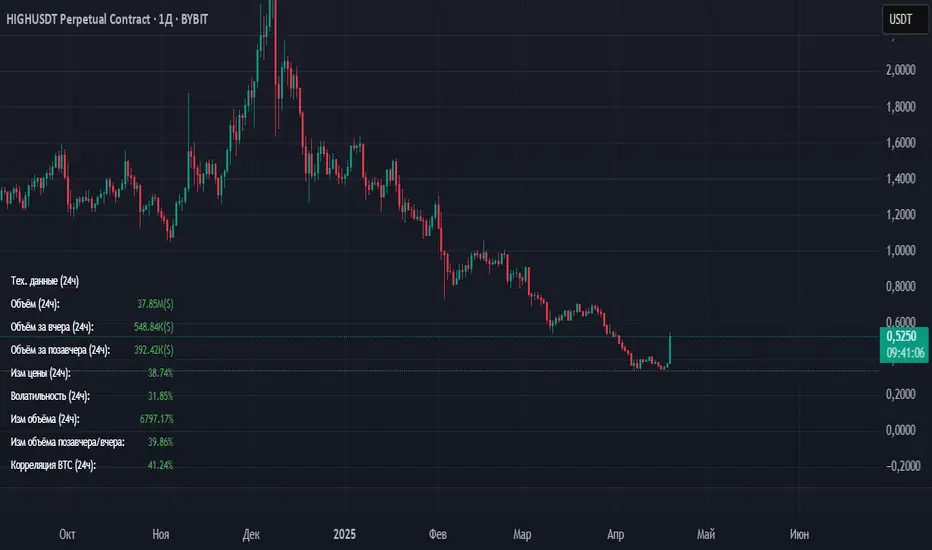
Volume_volatility_24)📊 TechData24h (24h Technical Metrics)
This TradingView indicator displays and alerts on key daily metrics for the current trading instrument, including:
Volume (24h, Yesterday, Day Before Yesterday)
Price Change (%) over 24h
Volatility (%) over 24h
Volume Change (%) vs Yesterday and Day Before
Correlation with BTC (custom symbol & timeframe)
🔔 Custom Alerts:
You can define your own percentage thresholds for both positive and negative changes. Alerts will trigger when:
Price change exceeds or drops below a set threshold
Volatility crosses a threshold
Volume increases or decreases significantly
Correlation with BTC moves beyond limits
📋 Table Dashboard:
All selected metrics are shown in a 2-column dashboard at the bottom left of the chart, with color-coded values based on increase/decrease.
Apex Edge SMC Tactical Suite
🛰 Apex Edge SMC Tactical Suite
Apex Edge SMC Tactical Suite is a precision-engineered multi-signal tool designed for advanced traders who demand real-time edge detection, breakout identification, and smart volatility-based risk placement. Built to blend seamlessly into any price action, SMC, or momentum-based strategy.
🔧 Core Features:
📍 Entry Signals
Green & red arrows appear only when a candle meets strict "Power Candle" criteria:
High momentum breakout
Volume spike confirmation
OBV spike divergence
Trend & HTF filter optional
Volatility-adjusted stop placement
💥 Power Candles
Smart detection of explosive volume+range candles
Custom "fuel score" system ranks their momentum potential
Displays as either candle highlights or subtle labels
📊 Fuel Meter
RSI-based energy tracker with customizable threshold
Plots real-time bar strength on a mini histogram
🧠 Trap Detection + Reversals
Detects stop hunt wicks or "liquidity traps"
Shows reversal diamonds on potential reclaim setups
Built-in swing logic confirms trap reversals
🧮 HTF Filtering
Optional higher-timeframe trend filter via Hull MA
Keeps signals aligned with broader market direction
📦 TP/SL Zones
Risk is calculated using volatility clustering (recent swing zones)
TP auto-calculated using ATR-based expansion
🔔 Alerts Included:
✅ Power Candle Detection
✅ Long/Short Entry Alerts
✅ Exit Signal Alerts
✅ Trap Defense Alerts
✅ Trap Reversal Confirmations
🎯 Ideal For:
SMC / ICT traders
Breakout traders
Trend followers
Scalpers / intraday setups
Momentum + volume combo traders
⚠️ Tip: Best paired with clean chart layouts, market structure, or order block frameworks. Can be combined with internal/external liquidity sweep logic for extra confluence.
Feel free to play around with the code and if you're a professional coder (unlike me) then please tag me into any versions that you can make better. Enjoy!
Disclaimer - This script was created entirely with many hours using the assistance of ChatGPT

Market Session Boxes with Volume Delta [algo_aakash]This script highlights four key forex trading sessions — Tokyo, London, New York, and Sydney — by drawing color-coded boxes directly on the chart. For each session, it shows:
High and low of the session
Total volume traded
Volume delta (bullish vs bearish pressure)
Optional extension of session highs/lows into future candles
Cleanly labeled time range and stats
Users can:
Select which sessions to display
Customize session times (in UTC+0)
Choose colors per session
Toggle session labels and extension lines
Use Case: Designed to help intraday and short-term traders visualize market rhythm, liquidity zones, and session-based volatility. The volume delta metric adds an extra layer of sentiment analysis.
This tool works best on intraday timeframes like 15m, 30m, or 1H.
Disclaimer:
This indicator is for educational and visual analysis purposes. It does not constitute trading advice or guarantee results. Always conduct your own analysis before making trading decisions.

VPSRVP Sovereign Reign (VPSR) - Advanced Volume Profile Analysis
A sophisticated volume analysis tool that provides deep insights into market participation and momentum through an intuitive visual interface. This indicator helps traders identify significant market moves, potential reversals, and institutional activity.
Key Features:
1. Smart Volume Analysis
• Dynamic volume profiling
• Institutional participation detection
• Abnormal volume identification
• Real-time momentum tracking
2. Advanced Visual System
• Color-coded volume bars
• Adaptive cloud formation
• Reversal pattern detection
• Fake-out warning system
Visual Components:
1. Volume Bars
• Green: Bullish pressure with normal volume
• Purple: Bearish pressure with normal volume
• White: Significant bullish participation
• Pink: Significant bearish participation
• Orange: High-probability reversal zones
2. Dynamic Cloud
• White Cloud: Bullish control zone
• Purple Cloud: Bearish control zone
• Cloud density indicates participation strength
• Adaptive to market conditions
Signal Interpretation:
1. Normal Market Conditions
• Green/Purple bars show directional pressure
• Cloud color indicates dominant force
• Cloud height shows average participation
2. Significant Events
• White/Pink bars signal major moves
• Orange bars highlight potential reversals
• Cloud expansion shows increasing activity
• Cloud contraction indicates consolidation
Customization Options:
• Volume MA Length: Smoothing factor
• Abnormal Volume Threshold: Sensitivity
• Cloud Display: Toggle visualization
• Color scheme optimization
Best Practices:
1. Multiple Timeframe Analysis
• Start with higher timeframes
• Confirm on lower timeframes
• Watch for confluence
2. Volume Analysis
• Compare to historical levels
• Monitor abnormal spikes
• Track participation trends
3. Trade Management
• Use as confirmation tool
• Wait for clear signals
• Monitor fake-out warnings
• Combine with price action
Trading Applications:
1. Trend Analysis
• Identify strong moves
• Spot weakening trends
• Detect consolidation
2. Reversal Detection
• Spot potential turning points
• Identify fake-outs
• Monitor institutional activity
3. Risk Management
• Volume-based position sizing
• Stop loss placement
• Profit target selection
The VP Sovereign Reign indicator excels at:
• Identifying significant market moves
• Detecting institutional participation
• Warning of potential reversals
• Highlighting fake-outs
• Providing clear market context
Risk Warning:
This indicator is designed as a technical analysis tool and should be used as part of a complete trading strategy. Past performance does not guarantee future results. Always employ proper risk management techniques.
Note: For optimal results, use in conjunction with price action analysis and other complementary indicators.

Volume Range Profile with Fair Value (Zeiierman)█ Overview
The Volume Range Profile with Fair Value (Zeiierman) is a precision-built volume-mapping tool designed to help traders visualize where institutional-level activity is occurring within the price range — and how that volume behavior shifts over time.
Unlike traditional volume profiles that rely on fixed session boundaries or static anchors, this tool dynamically calculates and displays volume zones across both the upper and lower ends of a price range, revealing point-of-control (POC) levels, directional volume flow, and a fair value drift line that updates live with each candle.
You’re not just looking at volume anymore. You’re dissecting who’s in control — and at what price.
⚪ In simple terms:
Upper Zone = The upper portion of the price range, showing concentrated volume activity — typically where selling or distribution may occur
Lower Zone = The lower portion of the price range, highlighting areas of high volume — often associated with buying or accumulation
POC Bin = The bin (price level) with the highest traded volume in the zone — considered the most accepted price by the market
Fair Value Trend = A dynamic trend line tracking the average POC price over time — visualizing the evolving fair value
Zone Labels = Display real-time breakdown of buy/sell volume within each zone and inside the POC — revealing who’s in control
█ How It Works
⚪ Volume Zones
Upper Zone: Anchored at the highest high in the lookback period
Lower Zone: Anchored at the lowest low in the lookback period
Width is user-defined via % of range
Each zone is divided into a series of volume bins
⚪ Volume Bins (Histograms)
Each zone is split into N bins that show how much volume occurred at each level:
Taller = More volume
The POC bin (Point of Control) is highlighted
Labels show % of volume in the POC relative to the whole zone
⚪ Buy vs Sell Breakdown
Each volume bin is split by:
Buy Volume = Close ≥ Open
Sell Volume = Close < Open
The script accumulates these and displays total Buy/Sell volume per zone.
⚪ Fair Value Drift Line
A POC trend is plotted over time:
Represents where volume was most active across each range
Color changes dynamically — green for rising, red for falling
Serves as a real-time fair value anchor across changing market structure
█ How to Use
⚪ Identify Key Control Zones
Use Upper/Lower Zone structures to understand where supply and demand is building.
Zones automatically adapt to recent highs/lows and re-center volume accordingly.
⚪ Follow Institutional Activity
Watch for POC clustering near price tops or bottoms.
Large volumes near extremes may indicate accumulation or distribution.
⚪ Spot Fair Value Drift
The fair value trend line (average POC price) gives insight into market equilibrium.
One strategy can be to trade a re-test of the fair value trend, trades are taken in the direction of the current trend.
█ Understanding Buy & Sell Volume Labels (Zone Totals)
These labels show the total buy and sell volume accumulated within each zone over the selected lookback period:
Buy Vol (green label) → Total volume where candles closed bullish
Sell Vol (red label) → Total volume where candles closed bearish
Together, they tell you which side dominated:
Higher Buy Vol → Bullish accumulation zone
Higher Sell Vol → Bearish distribution zone
This gives a quick visual insight into who controlled the zone, helping you spot areas of demand or supply imbalance.
█ Understanding POC Volume Labels
The POC (Point of Control) represents the price level where the most volume occurred within the zone. These labels break down that volume into:
Buy % – How much of the volume was buying (price closed up)
Sell % – How much was selling (price closed down)
Total % – How much of the entire zone’s volume happened at the POC
Use it to spot strong demand or supply zones:
High Buy % + High Total % → Strong buying interest = likely support
High Sell % + High Total % → Strong selling pressure = likely resistance
It gives a deeper look into who was in control at the most important price level.
█ Why It’s Useful
Track where fair value is truly forming
Detect aggressive volume accumulation or dumping
Visually split buyer/seller control at the most relevant price levels
Adapt volume structures to current trend direction
█ Settings Explained
Lookback Period: Number of bars to scan for highs/lows. Higher = smoother zones, Lower = reactive.
Zone Width (% of Range): Controls how much of the range is used to define each zone. Higher = broader zones.
Bins per Zone: Number of volume slices per zone. Higher = more detail, but heavier on resources.
-----------------
Disclaimer
The content provided in my scripts, indicators, ideas, algorithms, and systems is for educational and informational purposes only. It does not constitute financial advice, investment recommendations, or a solicitation to buy or sell any financial instruments. I will not accept liability for any loss or damage, including without limitation any loss of profit, which may arise directly or indirectly from the use of or reliance on such information.
All investments involve risk, and the past performance of a security, industry, sector, market, financial product, trading strategy, backtest, or individual's trading does not guarantee future results or returns. Investors are fully responsible for any investment decisions they make. Such decisions should be based solely on an evaluation of their financial circumstances, investment objectives, risk tolerance, and liquidity needs.

Trading Sessions [BigBeluga]
This indicator brings Smart Money Concept (ICT) session logic to life by plotting key global trading sessions with volume and delta analytics. It not only highlights session ranges but also tracks their midpoints — which often act as intraday support/resistance levels.
🔵 KEY FEATURES
Visual session boxes: Plots boxes for Tokyo, London, New York, and Sydney sessions based on user-defined UTC+0 time ranges.
Volume & delta metrics: Displays total volume and delta volume (buy–sell difference) within each session.
Mid, High & Low Range Extension: Once a session ends, the high, low, and midpoint levels automatically extend — ideal for detecting SR zones.
Session labels: Each box includes a label with session name, time, volume, and delta for quick reference.
Custom session control: Enable or disable sessions individually and configure start/end times.
Clean aesthetics: Transparent shaded boxes with subtle borders make it easy to overlay without clutter.
Sessions Dashboard: Shows the time range of each session and tells you whether the session is currently active.
🔵 USAGE
Enable the sessions you want to monitor (e.g., New York or Tokyo) from the settings.
Use session volume and delta values to gauge the strength and direction of institutional activity.
Watch for price interaction with the extended range — it often acts as dynamic support/resistance after the session ends.
Overlay it with liquidity tools or breaker blocks for intraday strategy alignment.
🔵 EXAMPLES
Extended Future Range acted as resistance/support.
Delta value helped confirm bullish pressure during New York open.
Multiple sessions helped identify kill zone overlaps and high-volume turns.
Trading Sessions is more than just a visual scheduler — it's a precision tool for traders who align with session-based volume dynamics and ICT methodology. Use it to define high-probability zones, confirm volume shifts, and read deeper into the true intent behind market structure.

Volume & Price Counter**User Guide for Volume & Price Counter (Candle Structure)**
### 1. Introduction to Volume & Price Counter
The **Volume & Price Counter** (Candle Structure) is a momentum analysis indicator that helps identify which side—buyers or sellers—is dominating the market by counting candles based on the combination of volume and price movement.
The indicator classifies candles into 4 groups:
- **Volume Up, Price Up (Vol ↑ & Price ↑)** – Indicates strong buying pressure.
- **Volume Down, Price Up (Vol ↓ & Price ↑)** – Price is rising but buying momentum is weakening.
- **Volume Up, Price Down (Vol ↑ & Price ↓)** – Indicates strong selling pressure.
- **Volume Down, Price Down (Vol ↓ & Price ↓)** – Price is falling but selling momentum is weakening.
---
### 2. How the Indicator Works
The Volume & Price Counter calculates the number of each candle type over a specific time period to determine which side is currently in control:
- **Green Background**: When the total of (Vol ↑ & Price ↑) + (Vol ↓ & Price ↑) is greater than the total of (Vol ↑ & Price ↓) + (Vol ↓ & Price ↓) → Buyers are in control.
- **Red Background**: When the total of (Vol ↑ & Price ↓) + (Vol ↓ & Price ↓) is greater than the total of (Vol ↑ & Price ↑) + (Vol ↓ & Price ↑) → Sellers are in control.
---
### 3. How to Use the Indicator in Trading
**a) When the background is green**:
- The market is in an uptrend; consider buying during pullbacks to support zones.
- If the green background continues and the number of (Vol ↑ & Price ↑) candles dominates, the price may continue to rise.
- If the green background is present but there are many (Vol ↓ & Price ↑) candles, be cautious as buying strength may be fading.
**b) When the background is red**:
- The downtrend is prevailing; it's better to stay out or look for selling opportunities during pullbacks.
- If the red background continues with a high number of (Vol ↑ & Price ↓) candles, the price may continue to fall.
- If there are many (Vol ↓ & Price ↓) candles during a red background, selling pressure may be weakening—watch for reversal signals.
**c) When the background shifts from red to green**:
- This is a positive signal, indicating buyers are returning to the market.
- Additional volume confirmation is needed to validate a true uptrend.
**d) When the background shifts from green to red**:
- This warns of a potential trend reversal to the downside.
- If volume spikes during the red shift, consider closing long positions.
---
### 4. Combining Volume & Price Counter with Other Indicators
**Combine with support/resistance levels**:
If a green background appears at a strong support zone, it may signal a potential buying opportunity.

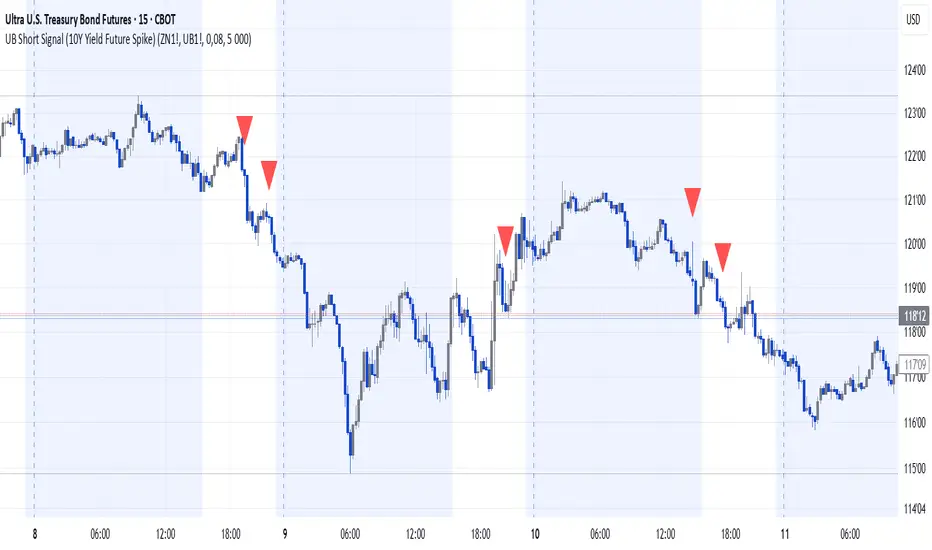
UB Short Signal (10Y Yield Future Spike)"This indicator identifies short opportunities on UB futures based on inverse correlation with 10Y Yield Futures. A macro trading tool to be used with additional confirmations."
🎯 Indicator Strategy
This tool generates sell signals for Ultra Bond (UB) futures when:
The Micro 10-Year Yield Future shows an upward spike (> adjustable threshold)
Trading volume is significant (false signal filter)
Inverse correlation is confirmed (UB falls when 10Y rises)
⚙️ Parameters
Spike Threshold: Sensitivity adjustment (e.g., 0.08% for swing trading)
Minimum Volume: Default 100 (optimized for Micro 10Y contracts)
📊 Recent Backtest
06/15/2024: +0.10% spike → UB dropped -0.3% within 15 minutes
06/18/2024: Valid signal post-CPI release
⚠️ Disclaimer
Analytical tool only – not financial advice
Must be combined with proper risk management
Money Flow Pulse💸 In markets where volatility is cheap and structure is noisy, what matters most isn’t just the move — it’s the effort behind it. Money Flow Pulse (MFP) offers a compact, color-coded readout of real-time conviction by scoring volume-weighted price action on a five-tier scale. It doesn’t try to predict reversals or validate trends. Instead, it reveals the quality of the move in progress: is it fading , driving , exhausting , or hollow ?
🎨 MFP draws from the traditional Money Flow Index (MFI), a volume-enhanced momentum oscillator, but transforms it into a modular “pressure readout” that fits seamlessly into any structural overlay. Rather than oscillating between extremes with little interpretive guidance, MFP discretizes the flow into clean, color-coded regimes ranging from strong inflow (+2) to strong outflow (–2). The result is a responsive diagnostic layer that complements, rather than competes with, tools like ATR and/or On-Balance Volume.
5️⃣ MFP uses a normalized MFI value smoothed over 13 periods and classified into a 5-tier readout of Volume-Driven Conviction :
🍆 Exhaustion Inflow — usually a top or blowoff; not strength, but overdrive (+2)
🥝 Active Inflow — supportive of trend continuation (+1)
🍋 Neutral — chop, coil, or fakeouts (0)
🍑 Selling Intent — weakening structure, possible fade setups (-1)
🍆 Exhaustion Outflow — often signals forced selling or accumulation traps (-2)
🎭 These tiers are not arbitrary. Each one is tuned to reflect real capital behavior across timeframes. For instance, while +1 may support continuation, +2 often precedes exhaustion — especially on the lower timeframes. Similarly, a –1 reading during a pullback suggests sell-side pressure is building, but a shift to –2 may mean capitulation is already underway. The difference between the two can define whether a move is tradable continuation or strategic exhaustion .
🌊 The MFI ROC (Rate of Change) feature can be toggled to become a volatility-aware pulse monitor beneath the derived MFI tier. Instead of scoring direction or structure, ROC reveals how fast conviction is changing — not just where it’s headed, but how hard it's accelerating or decaying. It measures the raw Δ between the current and previous MFI values, exposing bursts of energy, fading pressure, or transitional churn .
🎢 Visually, ROC appears as a low-opacity area fill, anchored to a shared lemon-yellow zero line. When the green swell rises, buying pressure is accelerating; when the red drops, flow is actively deteriorating. A subtle bump may signal early interest — while a steep wave hints at an emotional overreaction. The ROC value itself provides numeric insight alongside the raw MFI score. A reading of +3.50 implies strong upside momentum in the flow — often supporting trend ignition. A score of –6.00 suggests rapid deceleration or full exhaustion — often preceding reversals or failed breakouts.
・ MFI shows you where the flow is
・ ROC tells you how it’s behaving
😎 This blend reveals not just structure or intent — but also urgency . And in flow-based trading, urgency often precedes outcome.
🧩 Divergence isn’t delay — it’s disagreement . One of the most revealing features of MFP is how it exposes momentum dissonance — situations where price and flow part ways. These divergences often front-run pivots , traps , or velocity stalls . Unlike RSI-style divergence, which whispers of exhaustion, MFI divergence signals a breakdown in conviction. The structure may extend — but the effort isn’t there.
・ Price ▲ MFI ▼ → Effortless Markup : Often signals distribution or a grind into liquidity. Without rising MFI, the rally lacks true flow participation — a warning of fragility.
・ Price ▼ MFI ▲ → Absorption or Early Accumulation : Price breaks down, but money keeps flowing in — a hidden bid. Watch for MFI tier shifts or ROC bursts to confirm a reversal.
🏄♂️ These moments don’t require signal overlays or setup hunting. MFP narrates the imbalance. When price breaks structure but flow does not — or vice versa — you’re not seeing trend, you’re seeing disagreement, and that's where edge begins.
💤 MFP is especially effective on intraday charts where volume dislocations matter most. On the 1H or 15m chart, it helps distinguish between breakouts with conviction versus those lacking flow. On higher timeframes, its resolution softens — it becomes more of a drift indicator than a trigger device. That’s by design: MFP prioritizes pulse, not position. It’s not the fire, it’s the heat.
📎 Use MFP in confluence with structural overlays to validate price behavior. A ribbon expansion with rising MFP is real. A compression breakout without +1 flow is "fishy". Watch how MFP behaves near key zones like anchored VWAP, MAs or accumulation pivots. When MFP rises into a +2 and fails to sustain, the reversal isn’t just technical — it’s flow-based.
🪟 MFP doesn’t speak loudly, but it never whispers without reason. It’s the pulse check before action — the breath of the move before the breakout. While it stays visually minimal on the chart, the true power is in the often overlooked Data Window, where traders can read and interpret the score in real time. Once internalized, these values give structure-aware traders a framework for conviction, continuation, or caution.
🛜 MFP doesn’t chase momentum — it confirms conviction. And in markets defined by noise, that signal isn’t just helpful — it’s foundational.

Multi Timeframe Altered Money Flow Index by CoffeeShopCryptoMoney Flow Index is a long used tool in trading markets, understanding to where money is moving and most importantly when its going there.
One of the biggest challenges was the when part. Because seeing it on your current trading chart timeframe is easy but it gets difficult if youre attempting a top-down-analysis of market structure vs price performance.
The new formula presented by @CoffeeshopCrypto is a key solution to this timeframe analysis issue. Seems like I may have solved the "glitch-In-The-Matrix".
The issue was always setting a secondary MFI on your chart and telling the system you wanted to watch the 1 hour MFI from a 5 minute chart.
To do this you need to wait for 12 candles to close on your 5 minute chart before you can get a 1hour MFI value. The move may have already happend and you may be too late. If there was only a better faster way to see the changing values of the High Timeframe Money Flow Index in real time without changing chart times and losing place......oh wait.....there is one now!
This tool allows you to tell it what timeframe you are looking at,
and what you want to compare it to.
It runs the calculation in the background automatically to give you the real time values of your High Timeframe chart setting on the chart you are looking at.
How to trade Long
When both the LFT and HTF Money flow cross above ZERO, they are both in uptrend
How to trade Short
When both the LFT and HTF Money flow cross below ZERO, they are both in downtrend
What happens when Low timeframe is inside the high timeframe:
If High timeframe MFI is below zero but the LFT MFI is above it and still below zero, you have lost your short term downtrend. The opposite is true when the high timeframe MFI is above zero.
A strong constant comparative trend is when your low timeframe MFI is leading your High timeframe MFI.
Personal Settings:
In my usage, i find it best to multiply my trading chart timeframe by 3 and use that number as my high timeframe MFI setting
This works on ANY chart time you want. For example you are not locked to the standard built TradingView chart times.
If you trade on a 7 minute timeframe, you can set your HTF to 21.
7 * 3 = 21

VolumePrice Intensity AnalyzerVolumePrice Intensity Analyzer
The VolumePrice Intensity Analyzer is a Pine Script v6 indicator designed to measure market activity intensity through the trading value (Price * Volume, scaled to millions). It helps traders identify significant volume-price interactions, track trends, and gauge momentum by combining volume analysis with trend-following tools.
Features:
Volume-Based Analysis: Calculates Price * Volume in millions to highlight market activity levels.
Trend Identification: Plots 20-day and 50-day SMAs of the trading value to smooth fluctuations and reveal sustained trends.
Relative Strength: Displays the ratio of daily Price * Volume to the long-term SMA in a separate pane, helping traders assess activity intensity relative to historical averages.
Real-Time Metrics: A table shows the current Price * Volume and its ratio to the long SMA, updated continuously with bold text formatting (v6 feature).
Alerts: Triggers notifications for high trading values (when Price * Volume exceeds 1.5x the long SMA) and SMA crossovers (short SMA crossing above long SMA).
Visual Cues: Uses dynamic bar colors (teal for bullish, gray for bearish) and background highlights to mark significant market activity.
Customizable Inputs: Adjust SMA periods, scaling factor, and alert threshold via the settings panel, with tooltips for clarity (v6 feature).
Originality:
Unlike basic volume indicators, this tool combines Price * Volume with trend analysis (SMAs), relative strength (ratio plot), and actionable alerts. The real-time table and visual highlights provide a unique, at-a-glance view of market intensity, making it a valuable addition for volume and trend-focused traders.
Calculations:
Trading Value (P*V): (Close * Volume) * Scale Factor (default scale factor of 1e-6 converts to millions).
SMAs: 20-day and 50-day Simple Moving Averages of the trading value to identify short- and long-term trends.
Ratio: Daily Price * Volume divided by the 50-day SMA, plotted in a separate pane to show relative activity strength.
Bar Colors: Teal (RGB: 0, 132, 141) for bullish bars (close > open or close > previous close), gray for bearish or neutral bars.
Background Highlight: Light yellow (hex: #ffcb3b, 81% transparency) when Price * Volume exceeds the long SMA by the alert threshold.
Plotted Elements:
Short SMA P*V (M): Red line, 20-day SMA of Price*Volume in millions.
Long SMA P*V (M): Blue line, 50-day SMA of Price*Volume in millions.
Today P*V (M): Columns, daily Price*Volume in millions (teal/gray based on price action).
Daily V*P/Longer Term Average: Purple line in a separate pane, ratio of daily Price * Volume to the 50-day SMA.
Usage:
Spot High Activity: Look for Price * Volume columns exceeding the SMAs or spikes in the ratio plot to identify significant market moves.
Confirm Trends: Use SMA crossovers (e.g., short SMA crossing above long SMA) as bullish trend signals, or vice versa for bearish trends.
Monitor Intensity: The table provides real-time Price * Volume and ratio values, while background highlights signal high activity periods.
Versatility: Suitable for stocks, forex, crypto, or any market with volume data, across various timeframes.
How to Use:
Add the indicator to your chart.
Adjust inputs (SMA periods, scale factor, alert threshold) via the settings panel to match your trading style.
Watch for alerts, check the table for real-time metrics, and observe the ratio plot for relative strength signals.
Use the background highlights and bar colors to quickly spot significant market activity and price action.
This indicator leverages Pine Script v6 features like lazy evaluation for performance and advanced text formatting for better visuals, making it a powerful tool for traders focusing on volume, trends, and momentum.
Pivot Levels with EMA Trend📌 Trend Change Levels with EMA Trend
✨ Description:
This TradingView script identifies clean trend change levels based on 1-hour structure shifts and filters them to keep only those not invalidated. It follows the "Jake Ricci" method, each level is printed at the beginning of the candle that changes the trend, on a 1 hour chart. For precision, make sure to exclude after/pre market and only use the levels on regular hours charts.
It includes dynamic EMAs (9, 50, 200), intraday VWAP, the daily open level printed, and a visual trend label based on EMA(9) slope.
Designed for intermediate traders, it helps build bias, manage entries, and avoid false setups by focusing on clean, reactive levels that the market respects.
🔧 Core Logic:
On the 1H chart, the script compares current and previous closes to detect trend direction. If the trend flips (e.g., up to down), the open of the candle that caused the flip becomes a candidate level.
Only levels that remain untouched by future candle closes are plotted — this filters out “weak” levels that price already violated (which means, a candle closes after passing through the level).
These levels become key S/R zones and often act as reaction points during pullbacks, traps, and liquidity sweeps.
The idea is to check how the price reacts to those levels. Usually there's a clean retest of the level. After that, if the price continues in that direction, it tends to reach the following level.
🔹 Included Tools:
🟣 Trend Change Levels (1H):
Fixed horizontal lines based on confirmed shifts in trend, shown only when not broken.
📉 EMAs (9 / 50 / 200):
Visibility can be set per timeframe. Use for trend context.
📍 EMA Trend Label:
Shows \"UP\", \"DOWN\", or \"RANGE\" based on EMA(9) slope.
🔵 VWAP (Intraday Reset):
Real-time volume-weighted average price that resets daily. Useful for fair value zones and reversion plays.
🟠 Daily Open Line:
Plot of the current day’s open. Used for intraday directional bias. Usually: DO NOT take longs below the Open Print, DO NOT take shorts above it.
📊 ATR Table:
Displays current ATR multiplier on the chart. It's useful to understand if the market is expanding or not.
📈 How to Use It (Strategy):
1. Start on the 1H chart to generate levels.
Only the open of candles that reversed trend are considered — and only if future candles didn’t close through them. I suggest manually adding horizontal lines to mark again the levels, so that they stick to all the timeframes.
2. Use the trend label to decide your bias — \"UP\" for long setups, \"DOWN\" for shorts. Avoid trading against the slope.
3. Switch to the 5m chart and wait for price to approach a plotted level. These are often used for manipulation, retests, or clean reversals.
4. Look for confirmation: rejection candles, break-and-retest, strong engulfing candles, or traps above/below the level. ALWAYS check the price action around the level, along with the volume.
5. Check if VWAP or an EMA is near the level. If yes, the confluence strengthens the trade idea.
6. Use the ATR value to understand if the market is expanding (candles are bigger than the ATR). You don't want to stay in a slow and ranging trade.
✅ Example Entry Flow:
1. On the 1H chart, note a trend change level printed recently.
2. Check the current trend label — if it says \"UP,\" prefer longs.
3. Wait for price to retrace toward the level.
4. On the 5m, look for a bullish engulfing candle or trap setup at the level.
5. Check if VWAP and EMA(50) are near. If yes, execute the trade.
6. Set stop just under the low of the candle prior to your entry. Ideally, a retracing candle.
To be clear: imaging to be LONG, you wait for a retracement that should touch your level. You wait for a candle that resumes the LONG trend, enter when it breaks the high of the previous candle (sill in retracement), you place your stop under the candle prior to your entry.
Notes:
No repainting — levels only show up after confirmed shifts.
Removes broken levels for chart clarity and reliability.
Helps spot high-probability pullback zones and fakeouts.
Perfect confluence tool to support price action, SMC, or EMA strategies.
Works across multiple timeframes with customizable inputs.
👤 Ideal For:
Intraday traders looking for reactive entry points and direction confirmation.
Swing traders wanting to pinpoint continuation zones or reversal pivots.
🚨 Final Note: This indicator doesn’t generate buy/sell signals. It improves your trade filtering by identifying areas the market already respected and reacting to them with price action. Combine it with your own system , test it in replay, and use screenshots to document setups.
📌 If used with discipline, this becomes a precision tool — not a signal generator.

VWAP + EMA Retracement Indicator SwiftEdgeVWAP + EMA Retracement Indicator
Overview
The VWAP + EMA Retracement Indicator is a powerful and visually engaging tool designed to help traders identify high-probability buy and sell opportunities in trending markets. By combining the Volume Weighted Average Price (VWAP) with two Exponential Moving Averages (EMAs) and a unique retracement-based signal logic, this indicator pinpoints moments when the price pulls back to a key zone before resuming its trend. Its modern, AI-inspired visuals and customizable features make it both intuitive and adaptable for traders of all levels.
What It Does
This indicator generates buy and sell signals based on a sophisticated yet straightforward strategy:
Buy Signals: Triggered when the price is above VWAP, has recently retraced to the zone between two EMAs (default 12 and 21 periods), and a strong bullish candle closes above both EMAs.
Sell Signals: Triggered when the price is below VWAP, has retraced to the EMA zone, and a strong bearish candle closes below both EMAs.
Signal Filtering: A customizable cooldown period ensures that only the first signal in a sequence is shown, reducing noise while preserving opportunities for new trends.
Confidence Scores: Each signal includes an AI-inspired confidence score (0-100%), calculated from candle strength and price distance to VWAP, helping traders gauge signal reliability.
The indicator’s visuals enhance decision-making with dynamic gradient lines, a highlighted retracement zone, and clear signal labels, all customizable to suit your preferences.
How It Works
The indicator integrates several components that work together to create a cohesive trading tool:
VWAP: Acts as a dynamic support/resistance level, reflecting the average price weighted by volume. It filters signals to ensure buys occur in uptrends (price above VWAP) and sells in downtrends (price below VWAP).
Dual EMAs: Two EMAs (default 12 and 21 periods) define a retracement zone where the price is likely to consolidate before continuing its trend. Signals are generated only after the price exits this zone with conviction.
Retracement Logic: The indicator looks for price pullbacks to the EMA zone within a user-defined lookback window (default 5 candles), ensuring signals align with trend continuation patterns.
Candle Strength: Signals require strong candles (bullish for buys, bearish for sells) with a minimum body size based on the Average True Range (ATR), filtering out weak or indecisive moves.
Cooldown Mechanism: A unique feature that prevents signal clutter by allowing only the first signal within a user-defined period (default 3 candles), balancing responsiveness with clarity.
Confidence Score: Combines candle body size and price distance to VWAP to assign a score, giving traders an at-a-glance measure of signal strength without needing external analysis.
These components are carefully combined to capture high-probability setups while minimizing false signals, making the indicator suitable for both short-term and swing trading.
How to Use It
Add to Chart: Apply the indicator to a 15-minute chart (recommended) or your preferred timeframe.
Customize Settings:
VWAP Source: Choose the price source (default: hlc3).
EMA Periods: Adjust the fast and slow EMA periods (default: 12 and 21).
Retracement Window: Set how many candles to look back for retracement (default: 5).
ATR Period & Body Size: Define candle strength requirements (default: 14 ATR period, 0.3 multiplier).
Cooldown Period: Control the minimum candles between signals (default: 3; set to 0 to disable).
Candle Requirements: Toggle whether signals require bullish/bearish candles or entire candle above/below EMAs.
Visuals: Enable/disable gradient colors, retracement zone, confidence scores, and choose a color scheme (Neon, Light, or Dark).
Interpret Signals:
Buy: A green "Buy" label with a confidence score appears below the candle when conditions are met.
Sell: A red "Sell" label with a confidence score appears above the candle.
Use the confidence score to prioritize higher-probability signals (e.g., above 80%).
Trade Management: Combine signals with your risk management strategy, such as setting stop-loss below the retracement zone and targeting a 1:2 risk-reward ratio.
Why It’s Unique
The VWAP + EMA Retracement Indicator stands out due to its thoughtful integration of classic indicators with modern enhancements:
Balanced Signal Filtering: The cooldown mechanism ensures clarity without missing key opportunities, unlike many indicators that overwhelm with frequent signals.
AI-Inspired Confidence: The confidence score simplifies decision-making by quantifying signal strength, mimicking advanced analytical tools in an accessible way.
Elegant Visuals: Dynamic gradients, a highlighted retracement zone, and customizable color schemes (Neon, Light, Dark) create a sleek, futuristic interface that’s both functional and visually appealing.
Flexibility: Extensive customization options let traders tailor the indicator to their style, from conservative swing trading to aggressive scalping.
