MarketVision Screener█ OVERVIEW
• Screens 36 Assets at Once
• This Screener is Unique in that it turns my MarketVision series of Indicators Into a Complete Trading System
• To help you Automatically find Possible Turning Points in the Market the Following MarketVision Parameters are Displayed
o Linear Regression Direction and whether Price can be considered Over Bought / Sold according to the Linear Regression Channel (This works exceptionally well if used in confluence with manually drawn Fibonacci retracements)
o RSI value and Over / Very Over Bought / Sold condition
o Trend Meter – Shows Condition of the Trend Meter and its associated Trend / Money Flow Bar
o Wave Trend Crossing Condition taken from MarketVision B or Cipher B
o Wave Trend Divergences
o Super Trend Direction – Not a usual MarketVision parameter but it helps
• Furthermore you can choose where abouts on your chart you want the Screener displayed – this allows for multiple Screeners on one chart
█ HOW TO USE IT
• Look for Confluence between different parameters,
• For example Linear Regression Pointing Down and Price Over Bought according to both RSI and Linear Regression Channel, this is where you can look for maybe a Wave Trend cross down or a specific Candle Stick Pattern on you Chart with a Divergence
• Other confluences that work well are Trend Meter cross at the same time as a Wave Trend cross – Look for This Symbol "⯅ ⬱🡅⇶" or "⬱🡇⇶ ⯆"
• There are many possibilities the rest is up to you and your Trading Style / System
• Feel the Power
█ LIMITATIONS
• Can Not Set Alerts at This Stage – This is for a future Update or Script
• Slow Loading Time – As this is a rather long script Loading time is dependent on Internet Speed and your Computer Hardware
█ CREDITS
• Tradingview for the Pine Script Engine found under the hood of these amazing scripts
• QuantNomad and Others for their pioneering work making it possible to bring these sorts of advanced scripts to life
█ DISCLAIMER
• Not Financial Advice BUT
• Always use Proper Risk / Money Management – Never Risk more than you can Afford to Lose, Preferably not more than 1% - 2% of your Account
• Do Not FOMO or Revenge Trade
• Please remember that Past Performance may not be indicative of future results
Due to various factors, including changing market conditions, the strategy may no longer perform as well as in historical Back Testing
Wavetrend

OpenCipher AOpenCipher A is an open-source and free to use Overlay.
Features:
EMA Ribbons (Lengths: 5, 11, 15, 18, 21, 25, 29, 33)
Symbols ("Be careful" and "attention required" signals)
EMA Ribbons
The EMA RIbbons are a set of exponential moving averages. Blue and white ribbons = uptrend, gray ribbons = downtrend. The ribbons can act as support in uptrends and as resistance in downtrends.
Lengths and source of the ribbons are customizable.
Symbols
Green Dots: The green dot is a bullish symbol that appears whenever the EMA 11 crosses over EMA 33.
Red Cross: The red cross is a bearish symbol that appears whenever the EMA 5 crosses under EMA 11.
Blue Triangle: The blue triangle marks a possible trend reversal that appears whenever the EMA 5 crosses over EMA 25 while EMA 29 is below EMA 33.
Red Diamond: The red diamond is a bearish symbol that marks a potential local top whenever a bearish wavecross occurs (fast wave crosses under slow wave).
Yellow X: The yellow X is a warning signal that appears whenever a bearish wavecross occurs while the slow wave of the wavetrend is below -40 and the moneyflow is in the red (below zero).
Blood Diamond: The blood diamond is a bearish symbol that highlights whenever the red diamond and the red cross appear on the same candle.
Usage
Treat the symbols as signs that your attention might be required and don't trade based on them.

Trend MasterThis is a trend aggregator for confirmation and trend signals. It basically aggregates many buy/sell signals and confirmation and by combining them provides a strong buy/sell signal or trend confirmation.
The actual layout idea and trend confirmation is derived from Trend Meter and this indicator uses few other indicator, such as Chandelier Exit, WaveTrend, QQE Signals, Parabolic SAR and AlphaTrend. This indicator aggregates signal from different methods to find out more powerful and confirmed Trend and combines them into one Signal. It also uses Technical Ratings from TradingView team to filter out false signal, it tremendously opts out false signals and improve profitability.
The first seven dots are these
All 3 Trend Meters Now Align
MACD Crossover - Fast - 8, 21, 5
RSI 13: > or < 50
RSI 5: > or < 50
MA Crossover
MA Crossover
Chaikin Money Flow
Alphatrend
Technical Ratings
Then trend
Chandelier Exit
WaveTrend
QQE Signals
Parabolic Sar
All 3 Trend Meters aligns and A signal from trend i
Instructions
Change buy/sell policy based on market trend
Works on all TimeFrame but gives more accuracy on 4H, 1D.
Buy when green big dot appears at the bottom.
Sell when red big dot appears at the bottom.
Red/green dot at the top line appears when three trend meter is aligned and this is a good confirmation.
Any red/green dot below horizontal bars are trend signals.
Big red/green got at the bottom appears whenever there's a good confirmation from trend meter and a buy/sell signal comes from any trend signals.
Also look on the technical ratings bar, green means buy, red means sell and yellow means neutral.
Look for Support or Resistance Levels for price to be attracted to.
Find confluence with other indicators.
The more Trend meters are lit up the better.
Alert
01 Buy Signal = Strong Buy Signal
02 Sell Signal = Strong Sell Signal
03 Buy Signal = Strong Buy Signal
04 Sell Signal = Strong Sell Signal
Thanks to TradingView Technical Ratings authors, evergot, Lij_MC, KivancOzbilgic for their work. This indicator was heavily inspired from their work.

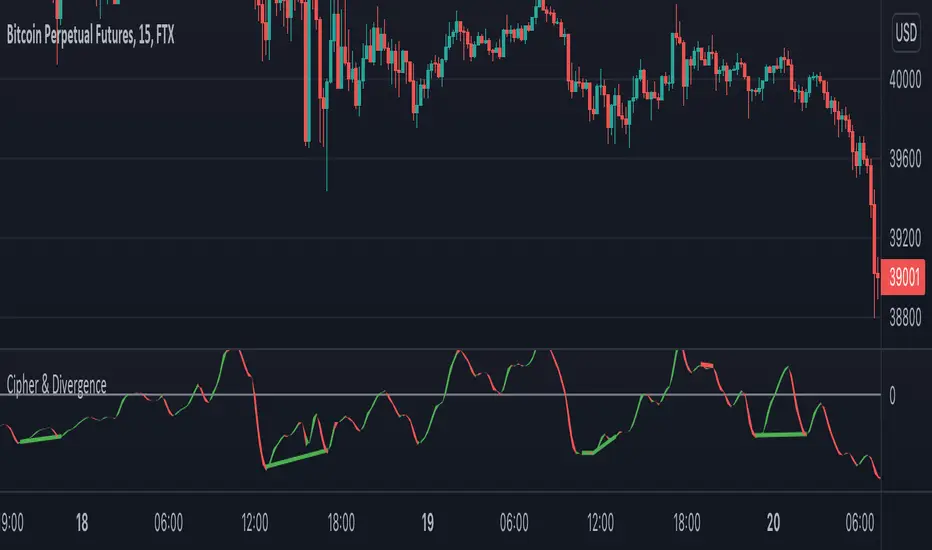
Cipher & DivergenceFor a long time I've been using complicated script with too much informations in it.
In this one I try to have just the bare minimum information to be able to analyse and find a potential reversal zone.
It is inspired from different wave trend / cipher script but has been tuned after months of backtest.
Extending the usage of the wave trend oscillator, which can be used with overbuy & oversell zone it might be better to wait for a confirmation of the movement. This confirmation can be identified by a pull back of the wave trend & price.
We can even confort ourself by waiting for reversal indicators.
Reversal may occurs after a divergence, wait for it, a cross of zero line followed by a PB to find your entry.
You can setup alert on bear / bull divergence but also when the wave trend cross the zero line to never miss a potential trade.
Huge thanks to LazyBear for his wave trend
And thanks vumanchu for his huge cipher script which was very useful for divergence finder
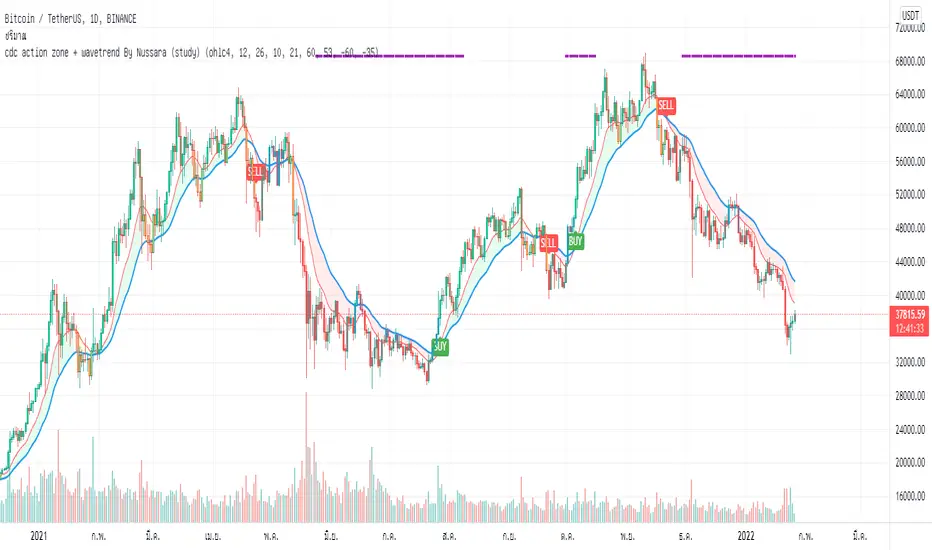
cdc action zone + wavetrend By Nussara (study)I previously shared strategy CDC action zone + WaveTrend By Nussara.
But some people say that the alarm is not connected to the robot trade (not 3commas robot trade) .
But for me, I used the strategy CDC action zone + WaveTrend By Nussara connect to 3commas robot trade with no problem at all.
However, I made a study script for those who want to connect to robot trade.
This version combines a famous indicator CDC Action zone V.2 and WaveTrend together.
When the WaveTrend cross below -35, it is an indication of oversold. The indicator will show a purple line on top until the WaveTrend is greater than 53.
Buy condition.
1. Purple line appears on the top indicator.
2. CDC Action zone - fast EMA crossover slow EMA .
Sell condition
1. CDC Action zone - fast EMA crossunder slow EMA .
This indicator is Suitable for a 1DAY time frame or more.
WhaleCrew VisionVision is an advanced momentum oscillator that visualizes momentum strength with overbought and oversold readings.
Features
Momentum Waves
Divergence Detection (regular and hidden divergences)
Detection for momentum shifts (detects higher lows/lower highs on the oscillator)
Detection for momentum stagnation
Moneyflow
Most important: Our Custom Strategy Builder
Custom Strategy Builder
The custom strategy builder is a framework that allows you to easily create custom strategies.
1. Configure long/short conditions
Pre-defined conditions for custom timeframes, under which you're looking to potentially enter a trade.
2. Configure trigger
Select a trigger (e.g. "Wave Cross" or "Wave Lower High") to generate labels/alerts for potential entries, whenever long/short conditions are met.
3. Configure Take Profit Conditions
Potential Take Profits are triggered by momentum stagnation.
4. Backtest your strategy
By using our open-source backtester script (published on our profile).
5. Trade responsibly
Manually review each signal/alert before taking any actions.
Note: The "Strategy Backtest" input section can also help you develop your strategy.
Usage
You can use this indicator to follow the trend, detect momentum shifts or memorize patterns.
Take a systematic approach by using our strategy builder.
Access to this indicator can be obtained through our website.

Time Segmented Volume, TSV Cipher + TSITHE IDEA:
TSV is a leading indicator based on the Volume, so it can be used to dectect price movements even before other indicators.
You can read about the Time Segmented Volume and the concept how to use it here:
From my observations, it seems like you can use this indicator in the similar way to "oscilators" as well.
So the idea is to use the signal and run in trough:
1) WaveTrend - to produce "green" and "red" dots.
2) TSI
Both oscillators produce two signals that when crossed might be a buy/sell signal.
Hope you like the idea.
WARNING: Use the indicator for your own risk, it was released for educational purposes.
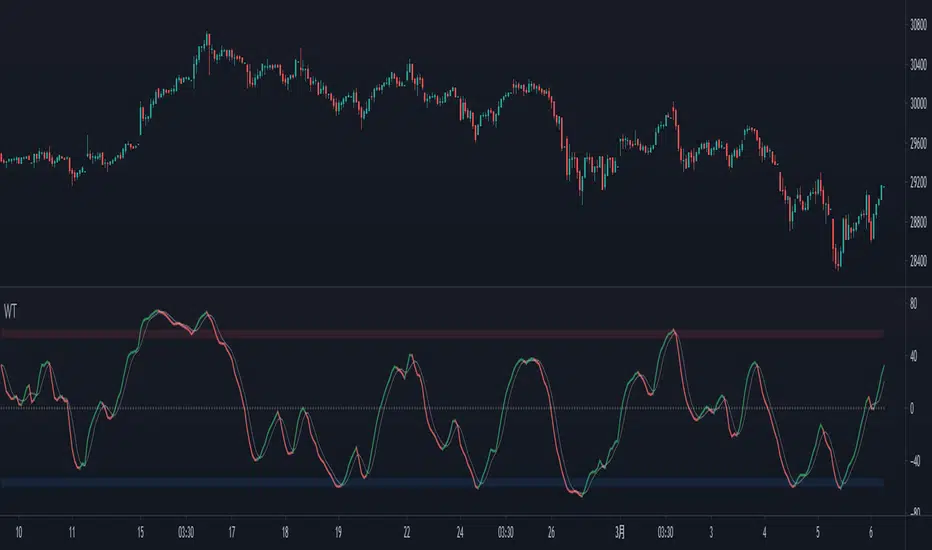
Wave Trend OscillatorThis is a very standard version of the Wave Trend Oscillator.
The Channel and Average values are displayed as lines, most people display them as areas.
The Channel and Average difference is displayed as a histogram, most people display it as a tiny noisy area.
I was unable to find a standard version of the Wave Trend Oscillator.
The colorful hyped up versions of this indicator made me feel like a clown while using them.
I have essentially copied the style of the MACD with this indicator, to keep things professional.
With this WTO, you can change the timeframe and source.
You can also change the histogram average length and multiplier, making it usable.
The typical way that people display the histogram is completely unusable and just for appearance.
Now it does a decent job showing when the momentum of the WTO's downward movement is slowing down, just like how the MACD histogram works.
This indicator is essentially a normalized MACD, though they are calculated differently.
The Wave Trend Oscillator is useful for spotting/monitoring changed in mid-trend momentum.
In my experience, divergence in this indicator is a strong signal.
If the MACD is too slow for you, then this is a great alternative; without all the extra fluff people usually add to it.

WaveTrend 4h/24mWaveTrend 4h/24m is a trading tool based on two WaveTrend timeframes.
For this script the WaveTrend calculations made by LazyBear were used. WaveTrend is a widely used indicator for finding direction of an asset.
The strategy is developed by Youtuber Jayson Casper. The main strategy on the 4 hour and 24 minute timeframes, this will be the default timeframes. Timeframes can be adjusted in the indicator interface.
With Jaysons' we wait for both timeframes to have last printed a green dot for longs, and both timeframes to have last printed a red dot for shorts. When this occurs a green diamond will be printed for longs, a red diamond for shorts.
Make sure to always use the chart from the smallest timeframe you're using, so by defaults use the 24 minute chart.
Features of the indicator:
- WaveTrend Timeframe 1 (Blue/Lightblue wave).
- WaveTrend Timeframe 2 (Blue/Purple line with filled background between the lines).
- VWAP (Yellow wave which is turned off by default)
- Green/Red Diamonds
What to look for?
This script is all about the Green and Red Diamonds.
A Green diamond will be printed when on both the 4 hour and 24 minute timeframe the last printed dot was a green dot.
A Red diamond will be printed when on both the 4 hour and 24 minute timeframe the last printed dot was a red dot.
What are the Green and Red Diamonds based on?
When both VWAP timeframes are ABOVE 0, a green diamond will be printed. This is equivalent to the last dot on both WaveTrend timeframes being a green dot.
When both VWAP timeframes are BELOW 0, a red diamond will be printed. This is equivalent to the last dot on both WaveTrend timeframes being a red dot.
Happy Trading!

Moving Average with Dynamic Color Gradient (WaveTrend Momentum)Similar scripts exist but I haven't seen one using WaveTrend and I haven't seen one that hand picks evenly divided colors between GREEN-YELLOW-RED.
The green is exact green, the yellow is exact yellow, and the red is exact red.
Not complicated, just useful.

ProProfits LongStrategy made ready for automated trading based on Wavetrend/VWAP/RSI.
Whenever a 18 minute timeframe wave reaches below -60 is followed by a 3 minute timeframe VWAP cross up, a long signal will be given.
Once an RSI cross on the 10 minute timeframe above 60 is followed by a red dot on the momentum waves on the 1 minute timeframe, a Take Profit signal will be given.
The timeframes are adjustable in the settings interface, so this automated strategy can be used with any timeframe combination for the Wavetrend/VWAP/RSI.
Always make sure to view the chart from the lowest timeframe you're using.

Binary ComboThis script combines Stochastic Divergence and WaveTrend Crosses.
Stochastic Divergence may be useful for seeing a shift in momentum before the price action reflects it.
WaveTrend gives us context to the short term trend.
You can combine these together to find good entries.

On-chart Wavetrend Divergence with PivotsThis is an OnChart WaveTrend Divergence Indicator with Pivots and Alerts
LazyBears WaveTrend Indicator or also known as "Market Cipher" is an Indicator that is based on Moving Averages, therefore its an "lagging indicator". Lagging indicators are best used in combination with leading indicators. In this script the "leading indicator" component are Daily, Weekly or Monthly Pivots. These Pivots can be used as dynamic Support and Resistance, Stoploss, Take Profit etc.
This indicator combination is best used in larger timeframes. For lower timeframes you might need to change settings to your liking.
What are those circles?
-These are the WaveTrend Divergences. Red for Regular-Bearish. Orange for Hidden-Bearish. Green for Regular-Bullish. Aqua for Hidden-Bullish.
Please keep in mind that this indicator is a tool and not a strategy, do not blindly trade signals, do your own research first! Use this indicator in conjunction with other indicators to get multiple confirmations.

MechaOscillatorWhat is MechaOscillator?
MechaOscillator was created as a companion to our main script MechaAlgo. Using MechaOscillator along with MechaAlgo will allow you to boost your overall understanding of any market, and make more informed decisions as a trader.
Feature List
Built-In Improved WaveTrend Oscillator
Buy & Sell Signals
Bullish and Bearish Divergences
Short and Long Term Trend Indicators
Trend Strength Indicator
Market State Indicator
Real Time Informational Dashboard
Bullish and Bearish Breakout Indicator
Many More Features to Come!
By using this script you acknowledge that MechaOscillator cannot guarantee you profit, and that this product was only created in attempt to benefit traders. You also acknowledge that past performance is not indicative of future results, and that the experience of other users or what you see online may not always be your experience.

MarketVision BWith Special Thanks to Everyone who has gone before me, and who have both allowed me given me permission to bring my version of Market Cipher to the World
Especially LazyBear for his amazing Wave Trend Oscillator and for Aevir, falconCoin, vumanchu, Crypto_Spike and others who have freely brought MarketCipher to the Tradingview Community
Also special mention to RicardoSantos for his Divergence script
MarketVision B - My take on MarketCipher B / Market Cipher B, Ive just put outlines on the Wave Trend to add to the Visual Appeal and Added a Trend Meter and a few more options for the Oscillators
Nice To Look At
Oscillator 1 Choose Between - RSI, MFI and Ultimate Oscillator
For Stochastics Choose Between Standard and RSI Stochastics and for the source you can choose On Balance Volume
Wave Trend
Money Flow
Trend Meter & Signals Bar
Divergences are marked, However they are easy to spot and it is better to train your eyes to spot them before the indicator marks them out
Lots of Alerts and Loads of ways to trade using MarketVision
PS: You can make this look like the original by adjusting the parameters in the menu

Simple Wave Trend Wave Trend Oscillator with minimal functionality.
- Change color by crossing
- Overboughtr and Oversold band
- Zero line
WaveTrend Simple Chart [NinjaDawgz]This is a chart version of my WaveTrend Simple Oscillator (). Its been adapted visualize most of the basic and intermediate interpretations, patterns and signals found in the Oscillator.
Quality of life and simplicity was the goal here... no need to squint at the oscillator and lookup at the bars, now the signals are plotted on the chart for easy interpretation. Additionally, a bunch of alert conditions have been created to help you know when signal occurs as soon as it occurs. I recommend using "on bar close" for any alerts as the signal is not true until the bar closes.
Personally, I only use the "Wave Reset MFI" signals but SMA and a combination of both SMA+MFI variations are coded there as well. Hide the variations you don't use to keep the chart clean.
Use this in conjunction with nearly any other form of analysis, especially Wave Theory, to get a powerful trading strategy. This is inherently biased to trading with momentum as its an easier and safer trade. Wave Bounce signals are reversal signals and can have brilliant timing but as with any attempt at picking tops and bottoms, you do get more false positives. Good money management and trade management will be extraordinarily helpful here, with most signals averaging approximately 1:3 risk/reward.
If you like this script let me know, I'd love to know how you use it with your own strategies :)

WaveTrend Oscillator v2 [Aspenforest]This is your regular WaveTrend Oscillator, which was originally scripted by LazyBear, but I updated the source code to Pine Script version 4, refactored the logic, and made the indicator more aesthetically pleasing.

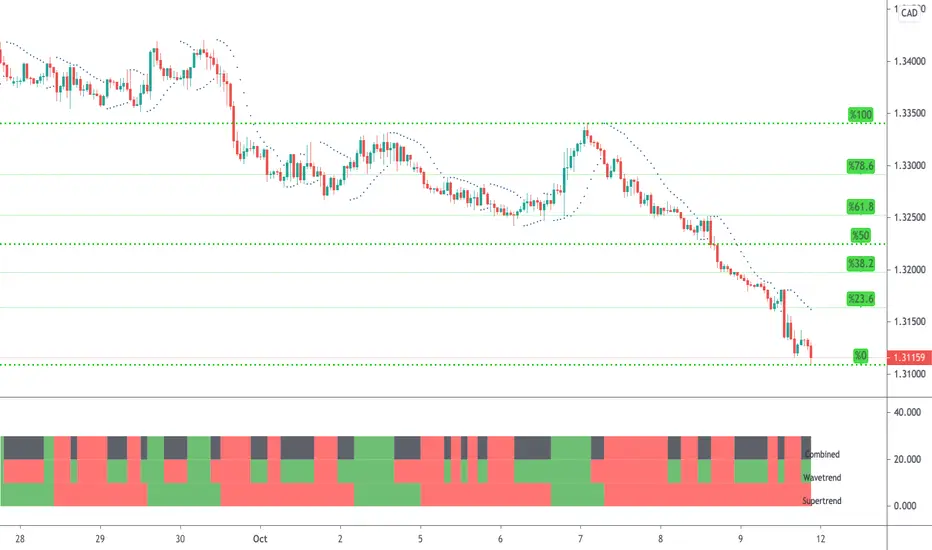
WaveTrend & Supertrend Comparison/CombinedThis compares two reasonably reliable strategies and shows where they are in agreement.
When the top line is GREEN - Then consider BUYing
When the top line is RED - Then consider SELLing
There are also alerts available.
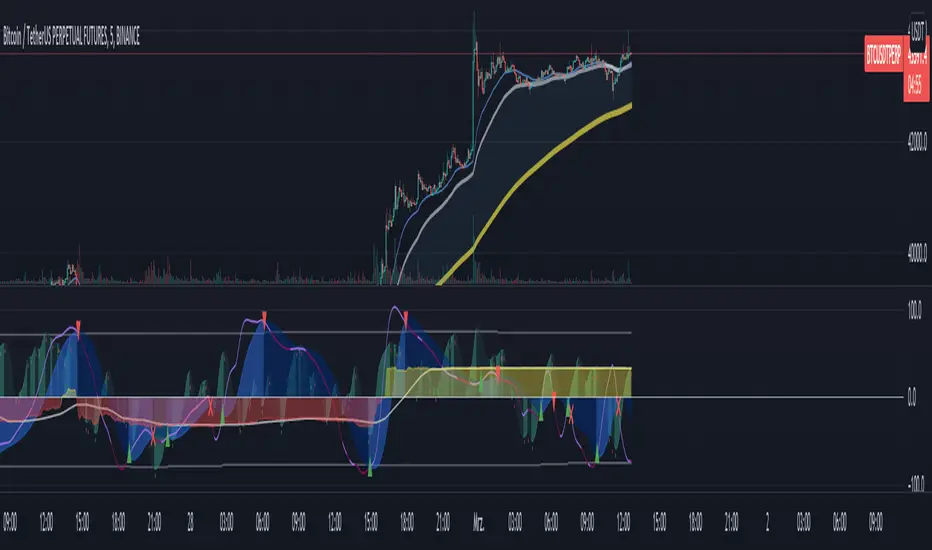
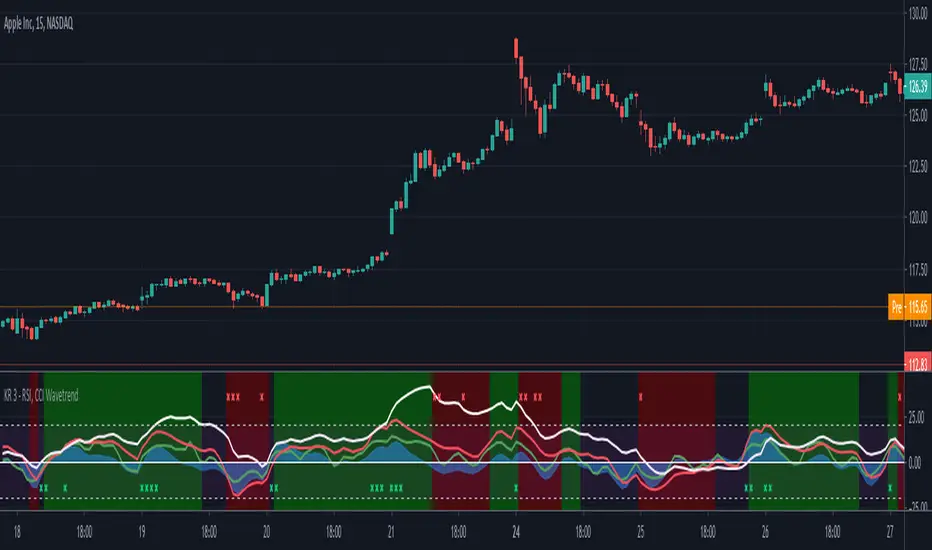
RSI, CCI WaveTrend God by Keiron RichieThis script uses Relative Strength Index ( RSI ), Commodity Channel Index ( CCI ) and WaveTrend (WT) together as an oscillator with an additional custom RSI rate of change indicator and buy/sell background color zones derived from a complex combination of these indicators.
The White line shows the moving average of RSI as an oscillator
The Green line is the fast Exponential Moving Average ( EMA ) of CCI & the Red line is the slow EMA of CCI .
The Blue area is the EMA of WaveTrend WT
How to read:
If the RSI , CCI or WT crosses above a programmed threshold and the other lines are also within a pre-defined buy range then the background will change to green for buy.
If the RSI , CCI or WT crosses below a programmed threshold and the other lines are also within a pre-defined sell range then the background will change to red for sell.
Where requirements are not met, the background is neither green nor red.
There are also red and green indicator x’s at the top/bottom of the indicator. They show a drastic change in Relative strength within a short period. This often indicates an immediate buy or sell opportunity.
Buy, Sell, Exit Buy and Exit Sell alerts are included.
Use the link below to obtain access to this indicator.
WaveTrend+ Alerts [SystemAlpha]This is the alert companion of the WaveTrend+ Strategy . Instead of using just the normal crossovers, we use trend filters, trailing stop loss and take profit targets. WT+ Strategy was developed for crypto, forex and stocks for 15 minutes to daily timeframe. The main goal was to catch long term trends and ride them.
In this alert you have a choice of:
Trend Filters:
- Average Directional Index (ADX) – buy when price is trend is up and sell when trend is down.
- Moving Average (MA) – buy when price close above the defined moving average and sell when price close below moving average
- Parabolic SAR – buy when SAR is above price is above price and sell when SAR is below price.
- All - Use ADX, MA and SAR as filters
For MA Filter , you can use the “TF MA Type” and "TF MA Period" parameter to select Simple or Exponential Moving Average and length.
Stop Loss:
- Average True Range (ATR) – ATR % stop as trailing stop loss.
- Parabolic SAR (SAR) – Parabolic SAR adapted as trailing stop loss.
For ATR , you can use the “ATR Trailing Stop Multiplier” parameter to set an initial offset for trailing stop loss.
Take Profit Target:
- Average True Range (ATR) – ATR % stop as trailing stop loss.
- Standard % – Percent as target profit
For ATR , you can use the “ATR Take Profit Multiplier” parameter to set an initial offset for trailing stop loss.
Additional feature include:
- Regular and Hidden Divergence display and alerts
- Filter Overbought and Oversold
- Use WT Cross for Exit
TradingView Links:
WT+ Oscillator:
How to use:
1. Apply the script by browsing through Indicators --> Invite-Only scripts and select the indicator
2. Once loaded, click the gear (settings) button to select/adjust the parameters based on your preference.
3. Wait for the next BUY or SELL signal to enter the trade!
Disclaimer:
The indicator and signals generated do not constitute investment advice; are provided solely for informational purposes and therefore is not an offer to buy or sell a security; are not warranted to be correct, complete or accurate; and are subject to change without notice.

WaveTrend [LazyBear] vX by DGTDGT interpreted version of LazyBear's WaveTrend, visualizing on Price Chart
Original Author : LazyBear
Crosses above or below threshold are emphasized with bigger labels
- crosses above threshold : probable short indications with a bigger label and relativly small label for probable long indications
- crosses below threshold : probable long indications with a bigger label and relativly small label for probable short indications
All rest crosses within threshold boundaries with relatively small labels for both long and short probable indications

MultiWave v2 | CryptoProToolsThis is a release highly requested in our Discord server.
Finally we have an update / official release of our original MultiWave indicator
On top of the standard signals (displayed as the dots on chart) and alerts we now also have "trend signals" with various options (displayed as the triangles on chart).
These new trend signals still use the same multi wave algorithm but trigger differently for some quite nice results.
Also added the option for smoothing on all three wave plots. There are 10 levels of smoothing to choose from and each plot can be tuned with different levels of smoothing.
For access and further information about this or any of our other indicators please click the link to our website below.
