Auto Wyckoff Schematic [by DanielM]This indicator is designed to automatically detect essential components of Wyckoff schematics. This tool aims to capture the critical phases of liquidity transfer from weak to strong hands, occurring before a trend reversal. While the Wyckoff method is a comprehensive and a very nuanced approach, every Wyckoff schematic is unique, making it impractical to implement all its components without undermining the detection of the pattern. Consequently, this script focuses on the essential elements critical to identifying these schematics effectively.
Key Features:
Swing Detection Sensitivity:
The sensitivity of swing detection is adjustable through the input parameter. This parameter controls the number of past bars analyzed to determine swing highs and lows, allowing users to fine-tune detection based on market volatility and timeframes.
Pattern Detection Logic:
Accumulation Schematic:
Detects consecutive lower swing lows, representing phases like Selling Climax (SC) and Spring, which often precede a trend reversal upward. After the final low is identified, a higher high is detected to confirm the upward trend initiation.
Labeled Key Points:
SC: Selling Climax, marking the beginning of the accumulation zone.
ST: Secondary Test during the schematic.
ST(b): Secondary Test in phase B.
Spring: The lowest point in the schematic, signaling a final liquidity grab.
SOS: Sign of Strength, confirming a bullish breakout.
The schematic is outlined visually with a rectangle to highlight the price range.
Distribution Schematic:
Detects consecutive higher swing highs, which indicate phases such as Buying Climax (BC) and UTAD, often leading to a bearish reversal. After the final high, a lower low is detected to confirm the downward trend initiation.
Labeled Key Points:
BC: Buying Climax, marking the beginning of the distribution zone.
ST: Secondary Test during the schematic.
UT: Upthrust.
UTAD: Upthrust After Distribution, signaling the final upward liquidity grab before a bearish trend.
SOW: Sign of Weakness, confirming a bearish breakout.
The schematic is visually outlined with a rectangle to highlight the price range.
Notes:
Simplification for Practicality: Due to the inherent complexity and variability of Wyckoff schematics, the indicator focuses only on the most essential features—liquidity transfer and key reversal signals.
Limitations: The tool does not account for all components of Wyckoff's method (e.g., minor phases or nuanced volume analysis) to maintain clarity and usability.
Unique Behavior: Every Wyckoff schematic is different, and this tool is designed to provide a simplified, generalized approach to detecting these unique patterns.
Wyckoffmethod

Wyckoff Springs [QuantVue]The Wyckoff Springs indicator is designed to identify potential bullish reversal patterns known as "springs" in the Wyckoff Method. A Wyckoff spring occurs when the price temporarily dips below a support level, then quickly rebounds, suggesting a false breakdown and a
potential buying opportunity.
How it works:
Pivot detection:
The indicator identifies pivot lows based on the specified pivot length.
These pivot points are stored and analyzed for potential spring patterns.
Volume and Range Checks:
If volume confirmation is enabled, the indicator checks if the current volume exceeds a threshold based on the average volume over the specified period.
The indicator ensures that the price undercuts the defined trading range before confirming a spring pattern.
Spring Identification
The indicator checks for price conditions indicative of a Wyckoff spring: a temporary dip below a pivot low followed by a close above it. The recovery must take place within 3 bars.
If these conditions are met, a spring label is placed below the bar.
Features:
Pivot Length:
The user can set the pivot length to match any style of trading.
Volume Confirmation:
An optional feature where the user can specify if volume confirmation is required for a spring signal.
Volume threshold can be set to determine what constitutes significant volume compared to the average volume over a specified period. By default it is set to 1.5
How to Trade a Spring:
Give this indicator a BOOST and COMMENT your thoughts below!
We hope you enjoy.
Cheers!

Buy/Sell Volume Totals for PeriodThis indicator can be used to help you tell the difference between Wyckoff Accumulation and Distribution.
The idea is to add up all the Buy Volume and all the Sell Volume separately from the beginning of the Trading Range (TR) for each candle. You can define the Start and End dates in the settings of the indicator.
The indicator will show you 3 numbers of interest:
GREEN = Total Buy Volume from beginning of date range
RED = Total Sell Volume from beginning of date range
YELLOW = Ratio of Total Buy / Total Sell Volume from beginning of date range
When the Total Buy Volume exceeds the Total Sell Volume in the TR, the indicator will color the background in GREEN color, to indicate possible accumulation. Otherwise the background will be RED, to indicate possible distribution.
You can float your cursor over any candle to see the current Volume Totals at that candle from the beginning of the TR (set by you in settings to a specific date).
Here's a few examples of the indicator in action:
1) Accumulation
2) Distribution
3) Possible Re-distribution
Please note that this indicator is meant to be used in combination with other analysis techniques from the Wyckoff Methodology!

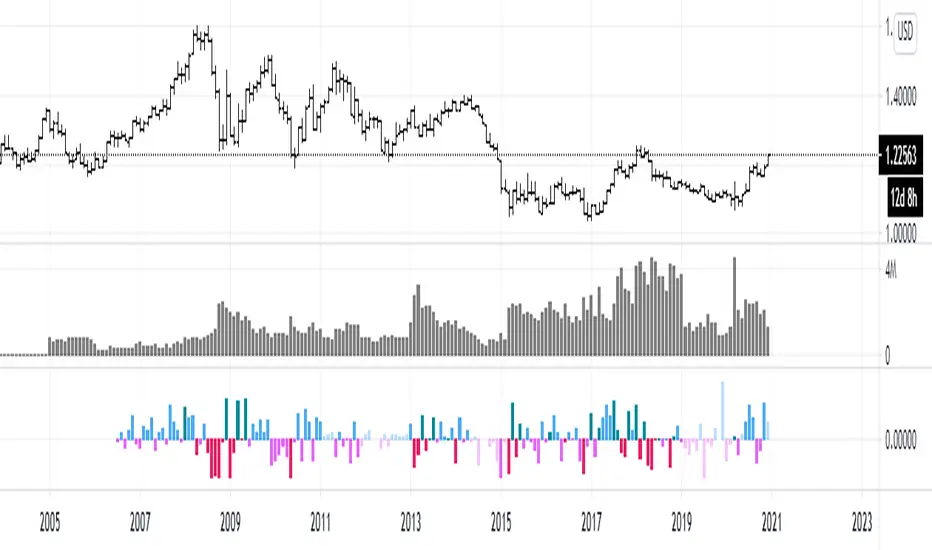
efficiency of bulls and bears for VSA(Google translation from Russian.)
This indicator shows the effectiveness of selling or buying.
It is calculated as follows: using percentrank, the volume and the value of the spread are estimated (momentum = 1)
the resulting estimate of the volume value is divided by the estimate of the spread (momentum = 1) and thus we obtain the value. The larger it is, the more efficient and easier the price movement was.
If the indicator value is small, then this means that the movement was ineffective, because the volume (money) was invested. but no result.
The color of the volume bars is assigned as follows:
Buyers:
If the volume is large - Blue - green
If middle, then blue
Small - light blue
Sellers:
If the volume is large - Burgundy color
If middle, then purple
Small volume - light purple
Indicator parameters:
Comparison period - the period at which the volumes and spread are compared with each other - by default it is 50, selected as the most universal period suitable for different timeframes. But for daytime ones. Weekly and monthly timeframes may need to be shortened. This is true after significant spikes in volume that are exceptional over the long term.
Period spread - Bars from close to close - or in other words, it is momentum - defaults to 1
sensitivity of increased volumes - according to the percentrank indicator - the limit above which the volume will be considered large, the same as in the Volume on bar VSA - indicator V2 - for clarity, I recommend looking at it.
The default is 85, which means. that if the current value of the volume is greater than 85% of the remaining values in this period, then such a value of the volume will be considered high.
medium volume sensitivity - the same sensitivity of increased volumes but for medium volumes.
multiplier of increased volumes - this is an empirical factor to emphasize the importance of increased volumes - default = 20
multiplier of average volumes - the same. As above, but for medium volumes - the default is 10
reduced volume multiplier - Default is 1.
Knowledge of VSA is required to read this indicator
This indicator is recommended for use with indicators:
Volume on bar VSA - indicator V2
BAR for VSA
Russian language
Этот индикатор показывает эффективность продаж или покупок.
Рассчитывается следующим образом: с помощью percentrank оценивается величина объема и велечина спреда (momentum = 1)
полученная оценка велечины объема делится на оценку спреда (momentum = 1) и таким образом получаем значение. Чем оно больше, тем движение цены было эффективнее и легче.
Если значение индикатора маленькое, то это означает, что движение было неэффективным, поскольку объем (деньги) вложили. а результата нет.
Цвет барам объемов присваиваются следующим образом:
У покупателей:
Если объем большой - Сине – зелёный цвет
Если средний – то голубой
Маленький – свело-голубой
У продавцов:
Если объем большой - Бордовый цвет
Если средний – то пурпурный
Маленький объем – светло-пурпурный
Параметры индикатора:
Comparison period (период для сравнения) – период на котором между собой сравниваются объемы и спред – по умолчанию равно 50 , выбрано как наиболее универсальный период подходящий для различных таймфреймов. Но для дневных. Недельных и месячных таймфреймов может потребоваться уменьшить период. Это актуально после значительных всплесков объемов, которые являются исключительными на длительном периоде.
Period spread - Bars from close to close (Период спреда - Баров от закрытия до закрытия) – или другими словами это momentum – по умолчанию равно 1
sensitivity of increased volumes (чувствительность повышенных объемов) – согласно индикатору percentrank – граница выше которой объем будет считаться большим, то же самое, что в индикаторе Volume on bar VSA - indicator V2 – для наглядности как это работает рекомендую посмотреть его.
По умолчанию задано 85 – это означает. что если текущее значение объема больше, чем 85% остальных значений на этом периоде, то такое значение объема будет считаться высоким.
medium volume sensitivity (чувствительность средних объемов) – то же самое sensitivity of increased volumes но для средних объемов.
multiplier of increased volumes (множитель (вес) повышенных объемов) – это эмперический коэффициент для придания особой важности повышенным объемам- по умолчанию = 20
multiplier of average volumes (множитель (вес) средних объемов) – то же самое. Что и выше, но для средних объемов – по умолчанию равно 10
reduced volume multiplier (множитель (вес) пониженных объемов) – по умолчанию равно 1.
Для чтения данного индикатора необходимо знание VSA
Этот индикатор рекомендуется использовать с индикаторами:
Volume on bar VSA - indicator V2
BAR for VSA
Weis Wave ChartThis indicator is based on the Weis Wave described by David H. Weis in his book Trades About to Happen: A Modern Adaptation of the Wyckoff Method, more info how to use this indicator can be found in this video . The Weis Wave is an adaptation of Richard D. Wyckoff’s method Wave Charts. It works in all time periods and can be applied to all asset types.
Unlike other implementations I found here on TradingView, this implementation make use of a Renko-like zig zag pattern, very similar to how it is described in David H. Weis' book. The settings for the zig zag pattern are very similar to the standard Renko settings here on TradingView, in the "Renko Assignment Method" you either chose "ATR" or "Traditional" (read more about it here ). The ATR length or the brick size is then entered in the textbox "Value". You can also chose another setting in the "Renko Assignment Method" drop down named "Part of Price" which calculate the brick size from the current close and divide it by the value in the text box "Value". It is also possible to chose if the zig zag pattern shall use the high/low, the open/close or just the close as the most extreme values in its calculation, you select this in the drop down "Price Source".
TradingView's pine script does currently not support to print non-static text on the chart, so it is not possible at this point to write out the volume on the zig zag chart. It is also not possible to have both an overlay and separate chart pane in the same indicator, therefor this indicator is split up in two.
You can find the volume indicator here:

Weis Wave VolumeThis indicator is based on the Weis Wave described by David H. Weis in his book Trades About to Happen: A Modern Adaptation of the Wyckoff Method, more info how to use this indicator can also be found in this video . The Weis Wave is an adaptation of Richard D. Wyckoff’s method Wave Charts. It works in all time periods and can be applied to all asset types. For assets that do not support volume Weis propose in his book to use the true range instead, so if you want to use this indicator for assets that do not support volume, make sure to enable the checkbox "Use True Range instead of Volume".
Unlike other implementations I found here on Trading, this implementation make use of a Renko-like zig zag pattern, very similar to how it is described in David H. Weis' book. The settings for the zig zag pattern are very similar to the standard Renko settings here on TradingView, in the "Renko Assignment Method" you either chose "ATR" or "Traditional" (read more about it here ). The ATR length or the brick size is then entered in the textbox "Value". You can also chose another setting in the "Renko Assignment Method" drop down named "Part of Price" which calculate the brick size from the current close and divide it by the value in the text box "Value". It is also possible to chose if the zig zag pattern shall use the high/low, the open/close or just the close as the most extreme values in its calculation, you select this in the drop down "Price Source". If you want the price to oscillate around a zero value, enable the "Oscillating" checkbox.
TradingView's pine script does currently not support to print non-static text on the chart, so it is not possible at this point to write out the volume on the zig zag chart. It is also not possible to have both an overlay and separate chart pane in the same indicator, therefor this indicator is split up in two.
You can find the zig zag indicator here:
