Highlight Highest Volume CandleHow it works:
lookback: how many bars to look back for highest volume (default 50).
highestVol: the maximum volume in that range.
isHighestVol: true if the current candle’s volume equals that maximum.
plotcandle: draws the candle in bright yellow.
plotshape: adds a small triangle below the bar for extra visibility.
X-volume

OG MACD-Histogram 6/13/5 © 2025🧠 OG MACD Histogram
📈 Developed by: OG WEALTH
📜 Description for TradingView:
This custom MACD Histogram was developed by OG WEALTH to provide elite-level momentum clarity and intraday reversal precision. Unlike traditional MACD tools, the OG MACD Histogram includes:
🔍 Smoother signal line filters for reduced noise
🟢 Dynamic histogram coloring for trend shifts
🛠 Designed for scalping, swing trades, and trend continuation setups
✅ Color Logic:
Dark green: Momentum building (bullish)
Light green: Momentum fading (still bullish, weakening)
Dark red: Bearish pressure increasing
Light red: Bearish exhaustion
🎯 Best For:
Confirming continuation moves
Detecting early reversals during low volume pullbacks
Pairing with EMA stacks (8/21 or 9/20)
📘 How to Use:
Use with trend overlays, such as EMAs or VWAP.
Look for dark green bars rising = possible call setup.
Look for dark red bars rising = possible put setup.
Wait for the histogram color to flip to confirm a momentum shift.
⚠️ Pro Tip: Combine with OG Flow Signal or ATR Trail for sniper-grade entries.

CVD - Cumulative Volume Delta CandlesCumulative Volume Delta with CVD level Alerts for finding Absorption - statistically the strongest CVD divergence.
Select your CVD levels in Settings > Inputs ("Upper Y Scale Alert Level" / "Lower Y Scale Alert Level") then right click on the green/red levels to create an alert for when CVD crosses.
If CVD hits a new high/low without price doing the same, there is Absorption
Reach out on X @cvolumeprofile to find out on which charts this works best
CVD by @cvolumeprofile also shows candle by candle divergences - highlighted with a green background. This is when a market goes down on more buyers or when a market goes up on more sellers - often signalling market inflection points

Volume Weighted Average Price Dynamic Slope [sgbpulse]VWAP Dynamic Slope: A Comprehensive Indicator for Trend Identification and Smart Trading
Introducing VWAP Dynamic Slope, an innovative TradingView indicator that harnesses the power of Volume Weighted Average Price (VWAP) and enhances it with immediate visual feedback. The indicator colors the VWAP line based on its slope, allowing you to quickly and easily identify the direction and strength of the current trend for the asset, providing advanced tools for in-depth analysis.
What is VWAP and Why is it so Important?
VWAP (Volume Weighted Average Price) is an indicator that represents the average price at which an asset has traded, weighted by the volume traded at each price level. Unlike a simple moving average, VWAP gives greater weight to trades executed with high volume, making it a reliable measure of the asset's "true" or "fair" price within a given period. Many institutional traders use VWAP as a central reference point for evaluating the effectiveness of entries and exits. An asset trading above its VWAP is considered to have bullish momentum, and below it – bearish momentum.
How it Works: Dynamic VWAP Slope Analysis
VWAP Dynamic Slope analyzes the inclination of the VWAP line and displays it using an intuitive color scheme:
Positive Slope (Uptrend): When the VWAP points upwards, signaling positive momentum, the default color will be green.
Negative Slope (Downtrend): When the VWAP points downwards, signaling negative momentum, the default color will be orange.
Trend Change (CHG): When a change in the VWAP's trend direction occurs, a "CHG" label will be displayed. The label's color will be green if the change is to an uptrend, and orange if the change is to a downtrend.
Identifying Steep Slopes for Increased Momentum:
The indicator's uniqueness lies in its ability to identify "steep" slopes – rapid and particularly strong changes in the VWAP's direction. This indicates exceptionally strong momentum:
Steep Positive Slope: The VWAP color will change to dark green, indicating significant buying pressure.
Steep Negative Slope: The VWAP color will change to dark red, indicating significant selling pressure.
Dynamic Momentum Strength Label: In situations of steep slope (positive or negative), a dynamic label will be displayed with the change value of the VWAP at that point. This label allows you to monitor momentum strength, intensification, or weakening in real-time.
Advanced Analytical Tools for Complete Control
VWAP Dynamic Slope provides you with unprecedented flexibility through a variety of customizable tools:
Multiple VWAP Anchors and Visual Marking:
Common Time Anchors: Choose whether the VWAP resets at the beginning of each Session (daily), Week, Month, Quarter, Year, Decade, or Century.
Advanced Intraday Anchors: Within the Session, you can choose to calculate VWAP specifically for Pre-Market, Regular Hours, and Post-Market hours. This option is particularly crucial for intraday traders.
Important Event Anchors: The indicator allows for VWAP resets at significant milestones such as Earnings, Dividends, and Splits, for analyzing the market's immediate reaction.
Visual Anchor Marking: To enhance clarity and orientation, a Label ⚓ can be displayed at each selected anchor point, helping to immediately identify the start point of the VWAP calculation in the chosen context.
Customizable Bands (Up to Three on Each Side):
Add up to three Bands above and below the VWAP to identify areas of deviation and excursion from the average price. You have two calculation options:
Standard Deviation: Based on volatility and statistical distance from the VWAP.
Percentage: Defines fixed percentage-based bands from the VWAP.
Key Pre-Market Levels (Pre-Market High/Low):
Display the Pre-Market High and Low levels as separate lines on the chart. These lines often serve as important psychological support and resistance zones, allowing you to see how the VWAP behaves near them.
Full Customization and Precise Control:
VWAP Source Selection: Determine which price data type will be used for the VWAP calculation. The default is HLC3 (average of High, Low, and Close), but any other relevant data source available in TradingView can be selected.
Offset: Set an offset for the VWAP line, allowing you to shift it left or right on the time axis by a chosen number of bars.
Customizable Colors: Choose your preferred colors for each slope state, Pre-Market High/Low lines, and Bands.
Setting the "Steepness" Threshold (Per-mille Price Change Per Minute ‱/min with Auto-Adjustment): Determine the sensitivity for identifying a steep slope by setting the required change threshold in VWAP in terms of per-mille price change per minute (‱/min). The indicator performs smart adjustment for any timeframe you select on the chart (e.g., 30 seconds, 1 minute, 5 minutes, 10 minutes, etc.), ensuring that the "steepness" setting maintains consistency and relevance.
Examples for Setting the Steepness Threshold:
Suppose you set the steepness threshold to 0.3‱/min (per-mille price change per minute).
On a 30-second chart: The indicator will check if the VWAP changed by 0.15 ‱/min (half of the per-minute threshold) within a single bar. If so, the slope will be considered steep. Explanation: Since 30 seconds is half a minute, the indicator looks for a change that is half of the threshold set for a full minute.
On a 1-minute chart: The indicator will check if the VWAP changed by 0.3 ‱/min (the full per-minute threshold) within a single bar. If so, the slope will be considered steep. Explanation: Here, the bar represents a full minute, so we check the full threshold.
On a 5-minute chart: The indicator will check if the VWAP changed by 1.5 ‱/min (5 times the per-minute threshold) within a single bar. If so, the slope will be considered steep. Explanation: A 5-minute bar contains 5 minutes, so the cumulative change in VWAP needs to be 5 times greater to be considered "steep" on the same scale.
In summary, this setting allows you to precisely and uniformly control the sensitivity of steep slope detection across all timeframes, providing immense flexibility in analyzing the asset's momentum.
Advantages of Using Per-mille Price Change Per Minute (‱/min)
Using per-mille price change per minute (‱/min) offers several key advantages for your indicator:
Normalized and Objective Measurement: It provides a uniform scale for the VWAP's rate of change, regardless of the asset's price or nominal value. A 0.1 per-mille change per minute always carries the same relative significance.
Comparison Across Different Asset Prices: Using per-mille allows for direct comparison of VWAP movement strength between assets trading at very different prices (e.g., a $100 asset versus a $1 asset), enabling an understanding of true momentum without bias from the nominal price.
Smart Timeframe Agnostic Adjustment: This is a critical capability. The indicator automatically adjusts the per-mille per minute threshold you set to any chart timeframe (30 seconds, 1 minute, 5 minutes, etc.), maintaining consistency in "steepness" detection without manual recalibration.
Precise Momentum Identification: This measurement precisely identifies when the VWAP's rate of change becomes significant, and when momentum strengthens or weakens, contributing to more informed trading decisions.
In short, per-mille change per minute (‱/min) provides accuracy, consistency, and flexibility in identifying VWAP momentum changes, with smart adaptation across all timeframes.
Who is this Indicator For?
VWAP Dynamic Slope is a powerful tool for:
Intraday Traders: For quick identification of intraday trend directions and momentum across any timeframe, with specific consideration for Pre-Market, Regular Hours, or Post-Market VWAP, and incorporating key pre-market levels.
Swing Traders and Long-Term Investors: For analyzing longer-term trends based on periodic and event-driven VWAP anchors.
Beginner Traders: As an excellent visual aid for understanding the relationship between price, volume, and trend direction, and how different anchor points, pre-market levels, and data sources influence price behavior.
Experienced Traders: For integration with existing strategies, gaining additional confirmation for trend strength identification, and highly precise and flexible parameter calibration.
VWAP Dynamic Slope provides a rich, multi-dimensional layer of information about the VWAP, helping you make more informed trading decisions in real-time, within the context of your chosen asset.

Volume PercentileThis Pine Script indicator highlights bars where the current volume exceeds a configurable percentile threshold (e.g., 80th percentile) based on a rolling window of historical volume data.
🔍 Key Features:
Calculates a user-defined volume percentile (e.g., 75th, 80th, 90th) over a rolling window.
Marks candles where current volume is higher than the selected percentile.
Helps detect volume spikes, breakouts, or unusual activity.
Works directly on the main chart window for easier analysis.
🛠️ Inputs:
Window Length: Number of bars used to calculate the percentile (default = 20).
Percentile: The percentile threshold to trigger a high-volume signal (default = 80).
🖥️ Visualization:
Displays a red triangle marker below bars with volume above the selected percentile.

Hme Rolling VolumeThis indicator allows you to display volume in a continious rolling time frame.
Instead of starting at zero for each new bar, it displays, for example, the cumulative volume of the last 120 seconds on a 2-minute chart.
This helps you track volume trends even more quickly and interpret their behavior without the break between bars.

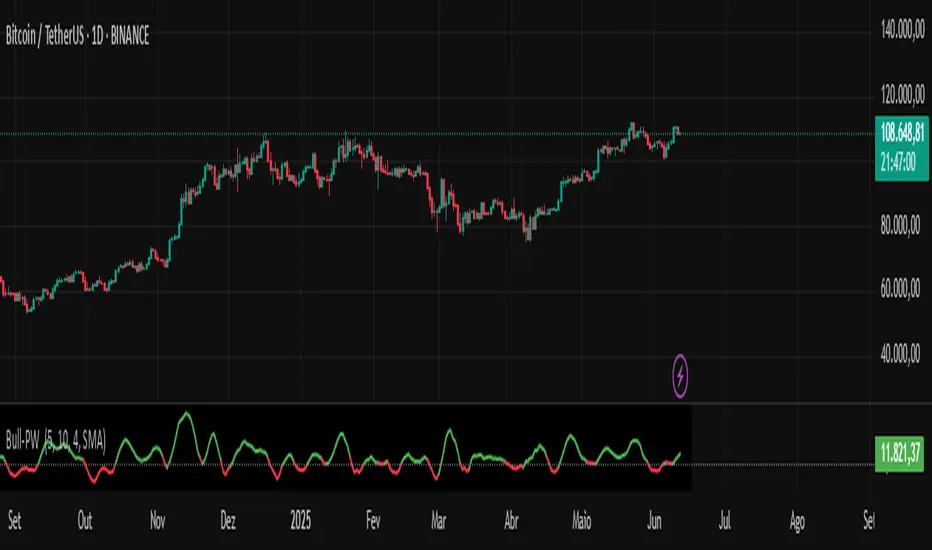
Chaikin Bull-Power OscillatorThis indicator is given with much love and care to the community to help you in your trading operations.
How to use the "Chaikin-Bull-PW" Indicator
The Chaikin-Bull-PW is an oscillator based on the Accumulation/Distribution (AD) line smoothed by different methods, called here the "Hull Chaikin Oscillator." It compares two smoothed averages of the AD line — a short period and a long period — to indicate the strength and direction of buying and selling pressure in the market.
Adjustable Parameters:
Short Period: Number of bars used to calculate the short smoothed average of the AD line. Shorter periods make the indicator more sensitive.
Long Period: Number of bars used to calculate the long smoothed average of the AD line. Longer periods smooth the indicator more.
Background Offset: Controls the offset of the chart’s background color.
Smoothing Type: Choose the smoothing method for the AD line among HMA, SMA, SMMA, EMA, WMA, and JMA. This affects how the averages are calculated and how the oscillator responds to price.
Indicator Interpretation:
The oscillator is the difference between the short and long smoothed averages of the AD line.
When the oscillator is above zero (green), it indicates increasing buying pressure, suggesting an uptrend.
When the oscillator is below zero (red), it indicates increasing selling pressure, suggesting a downtrend.
The zero line acts as a reference for trend changes.
Usage Suggestions:
Use the oscillator crossing the zero line to identify potential entry or exit points.
Combine with other indicators or chart analysis to confirm signals.
Adjust the periods and smoothing type to fit your asset and timeframe.
DeltaStrike — Aggressive Candle Detector by Chaitu50cDeltaStrike — Aggressive Candle Detector
by Chaitu50c
DeltaStrike is a simple and effective tool designed to help traders identify the most aggressive candles on the chart in real time. It works purely on price action and internal candle dynamics, with no reliance on lagging indicators.
The indicator combines delta (directional strength), candle range, and volume to compute an overall aggressiveness score for each candle. When this score exceeds a dynamic threshold based on recent market behavior, the candle is marked as an aggressive move.
Aggressive bullish candles are plotted as green diamonds below the candle, while aggressive bearish candles are plotted as red diamonds above the candle. The goal is to help traders visually spot moments of strong directional pressure, where potential trends or reversals may emerge.
The detection logic adapts automatically to changing market volatility and volume, making it suitable for all instruments and timeframes, including index futures, equities, and forex.
An integrated dashboard on the chart displays live readings of the key components contributing to each candle’s aggressiveness score: delta ratio, range ratio, and volume ratio. This helps traders understand the internal structure of each aggressive move.
Features:
Dynamic aggressiveness detection based on delta, range, and volume
Adaptive threshold for consistent behavior across timeframes and instruments
Clean chart output with clear diamond markers only on selected candles
Live dashboard with internal metrics for advanced analysis
Simple, lightweight, and optimized for intraday and swing trading
Works with any instrument: index, equity, forex, commodity
DeltaStrike is intended as an objective visual aid to help traders focus on genuine moments of strong market intent, filtering out ordinary or passive price movement. It can be used standalone or in combination with your existing trading strategy.

Volume-Time Imbalance (VTI)Volume-Time Imbalance (VTI) – Indicator Description
This indicator measures the imbalance between traded volume and the time elapsed between bars to identify unusual spikes in volume per second (volume per unit of time). Its purpose is to highlight volume movements that may indicate moments of strong interest, acceleration, or reversal in the market.
How it works:
It calculates the traded volume divided by the time (in seconds) elapsed since the previous bar — thus obtaining the volume per second.
An EMA (exponential moving average) of this volume per second is calculated to smooth the data.
The VTI value is the ratio between the current volume per second and this moving average, showing if the current volume is above what is expected for that pace.
The higher the VTI, the greater the imbalance between volume and time, indicating possible bursts of activity.
Settings:
VTI Moving Average Length: The period of the moving average used to smooth the volume per second (default is 20).
Alert Thresholds: Alert levels to identify moderate and high imbalances (defaults are 1.5 and 2.0).
Show VTI Histogram: Displays the VTI histogram in the indicator window.
Color Background: Colors the indicator background based on the strength of the imbalance (orange for moderate, red for high).
Show Alert Arrows: Shows arrows below the chart when a strong volume spike occurs (high alert).
Interpretation:
VTI values above the moderate level (1.5) indicate an unusual increase in volume relative to time.
Values above the high level (2.0) signal strong spikes that may anticipate significant moves or trend changes.
Use the colors and arrows as visual confirmations to quickly identify these moments.

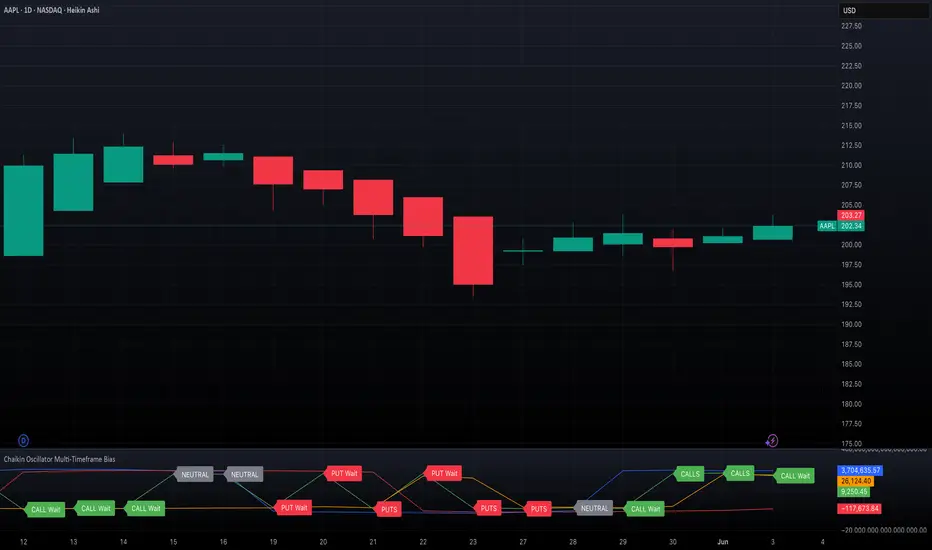
Chaikin Oscillator Multi-Timeframe BiasOverview
Chaikin Oscillator Multi-Timeframe Bias is an indicator designed to help traders align with institutional buying and selling activity by analyzing Chaikin Oscillator signals across two timeframes—a higher timeframe (HTF) for trend bias and a lower timeframe (LTF) for timing. This dual-confirmation model helps traders avoid false breakouts and trade in sync with market momentum and accumulation or distribution dynamics.
Core Concepts
The Chaikin Oscillator measures the momentum of accumulation and distribution based on price and volume. Institutional traders typically accumulate slowly and steadily, and the Chaikin Oscillator helps reveal this pattern. Multi-timeframe analysis confirms whether short-term price action supports the longer-term trend. This indicator applies a smoothing EMA to each Chaikin Oscillator to help confirm direction and reduce noise.
How to Use the Indicator
Start by selecting your timeframes. The higher timeframe, set by default to Daily, establishes the broader directional bias. The lower timeframe, defaulted to 30 minutes, identifies short-term momentum confirmation. The indicator displays one of five labels: CALL Bias, CALL Wait, PUT Bias, PUT Wait, or NEUTRAL. CALL Bias means both HTF and LTF are bullish, signaling a potential opportunity for long or call trades. CALL Wait indicates that the HTF is bullish, but the LTF hasn’t confirmed yet. PUT Bias signals bearish alignment in both HTF and LTF, while PUT Wait indicates HTF is bearish and LTF has not yet confirmed. NEUTRAL means there is no alignment between timeframes and directional trades are not advised.
Interpretation
When the Chaikin Oscillator is above zero and also above its EMA, this indicates bullish momentum and accumulation. When the oscillator is below zero and below its EMA, it suggests bearish momentum and distribution. Bias labels identify when both timeframes are aligned for a higher-probability directional setup. When a “Wait” label appears, it means one timeframe has confirmed bias but the other has not, suggesting the trader should monitor closely but delay entry.
Notes
This indicator includes alerts for both CALL and PUT bias confirmation when both timeframes are aligned. It works on all asset classes, including stocks, ETFs, cryptocurrencies, and futures. Timeframes are fully customizable, and users may explore combinations such as 1D and 1H, or 4H and 15M depending on their strategy. For best results, consider pairing this tool with volume, volatility, or price action analysis.
Volume Spike Alert & Overlay"Volume Spike Alert & Overlay" highlights unusually high trading volume on a chart. It calculates whether the current volume exceeds a user-defined percentage above the historical average and triggers an alert if it does. The information is also displayed in a customizable on-screen table.
What It Does
Monitors volume for each bar and compares it to an average over a user-defined lookback period.
Supports multiple smoothing methods (SMA, EMA, WMA, RMA) for calculating the average volume.
Triggers an alert when current volume exceeds the threshold percentage above the average.
Displays a table on the chart with:
Current Volume
Average Volume
Threshold Percentage
Optional empty row for spacing/formatting
How It Works
User Inputs:
lookbackPeriods: Number of bars used to calculate the average volume.
thresholdPercent: % above the average that triggers a volume spike alert.
smoothingType: Type of moving average used for volume calculation.
textColor, bgColor: Formatting for the display table.
tablePositionInput: Where the table appears on the chart (e.g., Bottom Right).
Toggles for showing/hiding parts of the table.
Volume Calculations:
Calculates current bar's volume.
Calculates average volume using the selected smoothing method.
Computes the threshold: avgVol * (1 + thresholdPercent / 100).
Compares current volume to threshold.
Table Display:
Dynamically creates a table with volume stats.
Adds rows based on user preferences.
Alerts:
alertcondition fires when currentVol crosses above the calculated threshold.
Message: "Volume Threshold Exceeded"
Usage Examples
Example 1: Spotting High Activity
Apply the script to a stock like AAPL on a 5-minute chart.
Set lookbackPeriods to 20 and thresholdPercent to 30.
Use EMA for more reactive volume tracking.
When volume spikes more than 30% above the 20-period EMA, an alert triggers.
Example 2: Day Trading Filter
For scalpers, apply it to a 1-minute crypto chart (e.g., BTC/USDT).
Set thresholdPercent to 50 to catch only strong surges.
Position the table at the top left and reduce visible info for a clean layout.
Example 3: Long-Term Context
On a daily chart, use SMA and set lookbackPeriods to 50.
Helps identify breakout moves supported by strong volume.
How this is different from Trading View's Volume indicator:
The standard volume plot from trading view allows users to set a alert when the average line is crossed, but it does not allow you to set a custom percentage at which to trigger an alert. This indicator will allow you to set any percentage you wish to monitor and above that percentage threshold will trigger your alert.
===== ORIGINAL DESCRIPTION =====
Volume Spike Alert & Overlay
This indicator will display the following as an overlay on your chart:
Current volume
Average Volume
Threshold for Alert
Description:
This indicator will display the current bar volume based on the chart time frame,
display the average volume based on selected conditions,
allow user selectable threshold over the average volume to trigger an alert.
Options:
Average lookback period
Smoothing type
Alert Threshold %
Enable / Disable Each Value
Change Text Color
Change Background Color
Change Table location
Add/Remove extra row for placement in top corner
Usage Example:
I use this indicator to alert when the current volume exceeds the average volume by a specified percentage to alert to volume spikes.
Set the threshold to 25% in the settings
Create an alert by clicking on the 3 dots on the right of the indicator title on the chart
When the threshold is exceeded the alert will trigger

Candle/Keltner Channels BUY SELLWhy Use Candlesticks?
They help traders visualize price action
Used in technical analysis and price pattern recognition (e.g., Doji, Engulfing, Hammer)
Assist in determining entry and exit points
Why Traders Use Keltner Channels?
Keltner Channels are widely used by traders for identifying trends, detecting volatility, and spotting trade opportunities.
1. Trend Identification
The middle line (EMA) shows the general trend.
If price consistently stays above the middle line, it indicates a strong uptrend.
If price stays below, it signals a downtrend.
Use: Traders follow the trend direction to enter trades in line with momentum.
2. Volatility Measurement
The width of the channel expands and contracts based on Average True Range (ATR).
Wider channels = high volatility, tighter channels = low volatility.
Use: Helps traders decide when to expect breakouts or calm periods.
3. Breakout Signals
A break above the upper band can signal a bullish breakout.
A break below the lower band can signal a bearish breakout.
Use: Traders use this for momentum trading and breakout entries.
4. Overbought/Oversold Conditions
Price touching or crossing the upper band may suggest it's overbought.
Price touching or crossing the lower band may suggest it's oversold.
Use: Traders combine this with RSI or MACD to confirm reversal setups.
5. Trade Entry and Exit
When price pulls back to the middle EMA during a trend, it may present a buy/sell opportunity.
Exits can also be planned if price returns inside the bands after a breakout.
Use: Helps with precise entry and exit timing.
6. Combines Well With Other Indicators
Commonly used with:
RSI (for confirmation)
MACD (for momentum)
Candlestick patterns (for price action signals)
Combining Candlestick Patterns with Keltner Channels gives traders a powerful method to confirm entries, spot reversals, and improve accuracy. Here’s why this combination works so well:
1. Context for Candlestick Signals
Candlestick patterns (like doji, engulfing, or pin bars) show potential price reversals, but they need context to be reliable. Keltner Channels provide that context:
A bullish candlestick near the lower band suggests a stronger buy signal.
A bearish candlestick near the upper band strengthens a sell signal.
2. Filtering False Signals
Candlestick patterns occur frequently, and not all are meaningful.
The location within the Keltner Channel helps filter out weak or false patterns.
Example: A bullish engulfing candle outside the lower band = high-probability reversal.
3. Improved Entry Timing
Traders wait for a candlestick pattern confirmation when price touches or crosses a Keltner band.
This avoids premature entries and allows tighter stop-losses.
4. Better Risk-Reward Setup
Candlestick entry near channel extremes (upper/lower band) lets traders place stop-losses just beyond recent highs/lows.
The target can be the opposite side of the channel or the middle EMA.
5. Visual Simplicity
Keltner Channels + Candles are visually intuitive.
Even beginner traders can easily recognize:
Overextended candles near channel edges.
Confirmed breakouts or reversals.
This Timeframe 5 min : XAUUSD

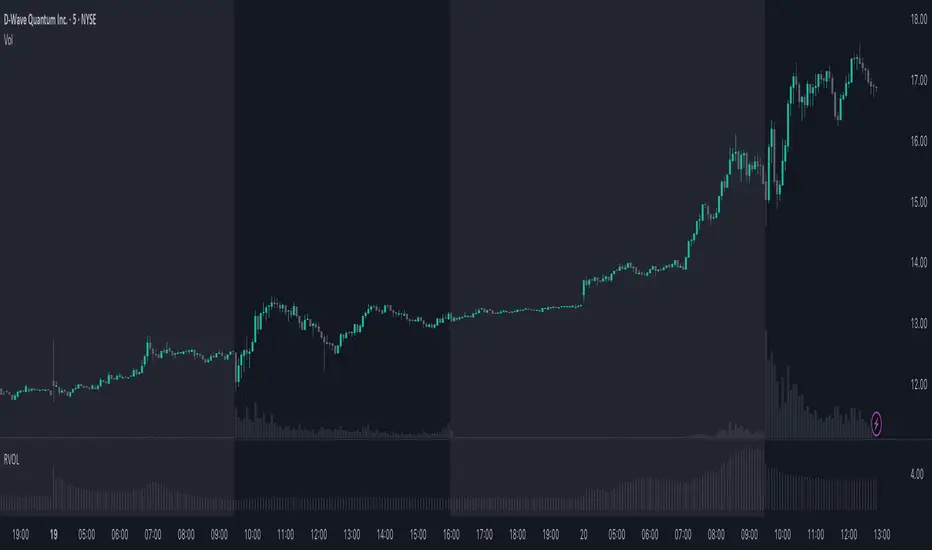
RVOL - Relative Volume IntradayIn the context of intraday trading, RVOL stands for Relative Volume. It is a technical indicator that compares the current volume of a stock to its average volume over a specified period. A RVOL above 1 suggests higher than average trading volume, potentially indicating increased interest and volatility.
The precise definition of real time relative volume is current cumulative volume up to the time of day divided by average cumulative volume up to this time of day. It means for example taking the volume from 09:45 to 10:00 and comparing it to what it does from 09:45 to 10:00 every day.
This indicator supports all timeframes from1 minute to 4 hours.
Trailing Cumulative Volume DeltaShort Description:
A dynamic volume delta indicator that calculates a trailing sum of net buying/selling pressure over a user-defined number of recent bars, offering a more adaptive view of order flow momentum compared to fixed-anchor CVD.
Overview:
The Trailing Cumulative Volume Delta (TCVD) indicator provides a powerful way to analyze market sentiment by tracking the net difference between buying and selling volume. Unlike traditional Cumulative Volume Delta (CVD) indicators that typically reset at fixed intervals (e.g., daily, weekly), the TCVD calculates a rolling sum of volume delta over a specified number of recent bars. This "trailing" approach offers a more fluid and responsive measure of recent order flow dynamics.
How it Works:
Per-Bar Delta Calculation: For each bar on your chart, the indicator first calculates the net Volume Delta. This is done by looking at a finer, user-configurable Lower Timeframe (e.g., 1-minute data for a 15-minute chart bar) to determine the aggressive buying vs. selling volume within that bar.
Trailing Sum: The indicator then sums these individual per-bar net deltas over a user-defined Trailing Bars lookback period. For example, if "Trailing Bars" is set to 20, the TCVD value will represent the cumulative net delta of the last 20 bars.
Visualization:
The TCVD is plotted in a "MACD-Columns-Style" in a separate pane.
Teal: When the TCVD value is increasing (suggesting growing net buying pressure or diminishing net selling pressure over the trailing period).
Red: When the TCVD value is decreasing (suggesting growing net selling pressure or diminishing net buying pressure over the trailing period).
White: When it is returning to the mean.
How to Interpret and Use TCVD:
Trend Strength & Momentum:
A rising TCVD suggests that, on average over the trailing period, buying pressure is dominant or strengthening. This can confirm bullish price action or indicate underlying strength.
A falling TCVD suggests that selling pressure is dominant or strengthening, potentially confirming bearish price action or indicating weakness.
Divergences:
Unlike other Divergences, the CVD has two different types of Divergences: a) Absorption and b) Exhaustion. You only want to trade the Absorption pattern.
Zero Line Crossovers:
TCVD crossing above the zero line can indicate a shift towards net positive buying pressure over the lookback period.
TCVD crossing below the zero line can indicate a shift towards net positive selling pressure.
Confirmation: Use TCVD to confirm breakouts or breakdowns. A price breakout accompanied by a strongly rising TCVD is generally more reliable.
Key Settings:
Trailing Bars: (Default: 10)
Determines the number of recent bars to include in the cumulative delta sum.
Shorter periods make the TCVD more responsive to immediate changes.
Longer periods provide a smoother, longer-term view of order flow.
Use custom timeframe: (Checkbox, Default: false)
Allows you to override the automatic selection of the lower timeframe for delta calculation.
Timeframe for Delta Calculation: (Default: "1" - 1 minute)
Specifies the lower timeframe data used to calculate the volume delta for each individual chart bar.
Choosing a very fine timeframe (e.g., seconds) can provide high precision but may be limited by data availability or processing load.
If "Use custom timeframe" is unchecked, the script attempts to choose a sensible default based on your chart's timeframe (e.g., "1S" for second charts, "1" for intraday, "5" for daily, "60" for weekly+).
Examples:
Confirming Breakout Strength:
Price breaks out above a significant resistance level.
If the TCVD is also sharply rising and has perhaps crossed above its zero line, it provides confirmation that strong buying interest is fueling the breakout, increasing confidence in its validity.
Important Notes:
This indicator requires reliable volume data from your broker/data feed to function correctly. If your chart does not have volume, or if the volume data is unreliable, the TCVD will not be accurate.
Like all indicators, TCVD is best used as part of a comprehensive trading strategy, in conjunction with price action analysis and other indicators or tools.
Experiment with the Trailing Bars and Timeframe for Delta Calculation settings to find what best suits your trading style, the asset you are analyzing, and the chart timeframe you are using.
Feel free to modify this, add your personal touch, or include specific screenshots when you publish!

Volume CandlesVolume Candles — Context-Aware Candle Color
Description:
This visual indicator colors your price candles based on relative volume intensity, helping traders instantly detect low, medium, and high volume activity at a glance. It supports two modes — Percentile Ranking and Volume Average — offering flexible interpretation of volume pressure across all timeframes.
It uses a 3-tiered color system (bright, medium, dark) with customizable tones for both bullish and bearish candles.
How It Works:
You can choose between two modes for volume classification:
Ranking Mode (Default):
Measures current volume’s percentile rank over a lookback period. Higher percentiles = stronger color intensity.
Percentile thresholds:
< 50% → light color (low volume)
50–80% → medium intensity
> 80% → high volume
Volume Average Mode:
Compares current volume against its simple moving average (SMA).
Volume thresholds:
< 0.5× SMA → light color
Between 0.5× and 1.5× → medium
> 1.5× → high intensity
Candle Paint:
Candles are colored directly on the chart, not in a separate pane. Bullish candles use green shades, bearish use red. All colors are fully customizable.
How to Interpret:
Bright Colors = High volume (potential strength or climax)
Muted/Transparent Colors = Low or average volume (consolidation, traps)
Example Use Cases:
Spot fakeouts with large price movement on weak volume (dark color)
Confirm breakout strength with bright candles
Identify stealth accumulation/distribution
Inputs & Settings:
Mode: Ranking Percentile or Volume Average
Lookback Period for ranking and SMA
Custom Colors for bullish and bearish candles at 3 intensity levels
Best For:
Price action traders wanting context behind each candle
Scalpers and intraday traders needing real-time volume feedback
Anyone using volume as a filter for entries or breakouts
Pro Tips:
Combine with Price Action, Bollinger Bands or VWAP/EMA levels to confirm breakout validity and intent behind a move.
Use alongside RSI/MACD divergences for high-volume reversal signals.
For swing trading, expand the lookback period to better normalize volume over longer trends.

CVD Divergenz System – modular with Exchange + LabelsA smart volume-based strategy tool using CVD divergence, ATR-based risk management, and Open Interest filters — now with visual chart labels and exchange switching.
Designed for crypto traders who want precise entry signals, volume insight, and a clean UI.
🔍 Key Features:
✅ CVD Divergence Detection
Automatically detects bullish or bearish divergences between price and cumulative delta (CVD)
✅ Open Interest Logic (Simulated)
Signals are only valid when OI is rising – otherwise a warning is issued
✅ ATR-Based Entry, Stop & Target Zones
Auto-calculated based on your chosen R multiple (e.g., 1.5R), plotted in the chart
✅ Visual Dashboard Panel (table)
Compact panel with CVD, OI change, ATR, signal status, and selected exchange — always visible in top-right
✅ Exchange Selector + Fallback to Binance
Choose between Binance, Bybit, Bitget, or Coinbase — if data is unavailable, Binance is used automatically
✅ Modular Chart Labels
Optionally display 📈 LONG, 📉 SHORT or ⚠️ WARNING labels directly on the chart with a toggle
✅ Alerts Built-In
Get notified instantly when a setup triggers (long, short, or warning) — works with app, popup, or webhook
✅ Fully Modular Controls
Enable or disable the dashboard, trade zones, and labels via simple checkboxes
⚠️ Technical Notes:
CVD is calculated from delta volume (volume * sign(close - open)) — not true order flow
Open Interest is simulated using volume as a placeholder (due to Pine Script limitations)
Best suited for 5–30min timeframes on crypto futures pairs like BTCUSDT, ETHUSDT, etc.
💡 Pro Tips:
Use near key support/resistance zones or liquidity levels
Combine with price action and higher timeframe confluence
Alerts work best with "Once Per Bar Close" trigger setting
📈 Built to support faster decisions, cleaner setups, and institutional-level insights — all in one tool.

Liqudation HeatMap [BigBeluga]🔵 OVERVIEW
An advanced liquidity visualization tool that plots horizontal heat zones to highlight where potential liquidations and volume clusters are most likely hiding beneath price action.
Liqudation HeatMap scans historical price movements for local highs and lows with elevated volume or candle range. It then draws dynamic heatmap boxes—shaded from lime (low interest) to yellow (high interest)—revealing potential zones of trapped positions or stop clusters. A vertical scale on the right shows you the relative strength of volume behind each level, from 0 to the highest detected.
🔵 CONCEPTS
Maps areas of potential liquidity using volume or candle range (if volume is unavailable).
Identifies swing highs/lows (pivots) and extends heatmap boxes outward from these levels. Colors each zone based on the relative strength of volume concentration.
Fades or removes zones once price crosses their midpoints, simulating the idea of liquidity being “consumed.”
Displays a live vertical scale that shows the volume range for quick reference.
🔵 FEATURES
Dynamic Heatmap Zones:
Draws few boxes above and after pivot highs and below pivot lows, each shaded based on volume concentration.
Smart Coloring System:
Uses a gradient from lime (low) to yellow (high) to visually distinguish between weak and strong liquidity zones.
Adaptive ATR Widths:
Automatically adjusts zone thickness based on volatility (ATR), scaling intelligently across timeframes.
Liquidity Consumption Logic:
Zones are stope extending once price interacts with them—mimicking the behavior of real liquidation sweeps.
Volume Scale Legend:
A real-time scale is plotted on the right side, showing the min-max range of volume used for heat calculations.
🔵 HOW TO USE
Look for thick yellow zones to identify areas of concentrated stop losses or liquidation triggers.
Use these levels to anticipate mean reversion points or high-volatility zones.
Combine with your trend or structure tools to trade into or fade these liquidity pools.
On lower timeframes, use this tool to confirm entries around sweeps or deviations.
Use the right-side scale to compare relative zone strength instantly.
🔵 CONCLUSION
Liqudation HeatMap is a powerful visualization tool that uncovers where liquidity likely resides on the chart. By highlighting hidden traps and reactive levels in real-time, it gives traders a significant edge when it comes to spotting stop hunts, mean reversions, and areas of institutional interest. Whether you’re scalping or swing trading, this heatmap provides unmatched context on the market’s hidden intent.

VOL & AVG OverlayCustom Session Volume Versus Average Volume
Description:
This indicator will create an overlay on your chart that will show you the following information:
Custom Session Volume
Average For Selected Session
Percentage Comparison
Options:
Set Custom Time Frame For Calculations
Set Custom Time Frame For Average Comparison
Set Custom Time Zone
Enable / Disable Each Value
Change Text Color
Change Background Color
Change Table location
Example:
Set indicator to 30 period average. Set custom time frame to 9:30am to 10:30am Eastern/New York.
When the time frame for the calculation is closed , the indicator will provide a comparison of the current days volume compared to the average of 30 previous days for that same time frame and display it as a percentage in the table.
In this example you could compare how the first hour of the trading day compares to the previous 30 day's average, aiding in evaluating the potential volume for the remainder of the day.
Notes:
Times must be entered in 24 hour format. (1pm = 13:00 etc.)
This indicator is for Intra-day time frames, not > Day.
If you prefer data in this format as opposed to a plotted line, check out my other indicator: ADR & ATR Overlay

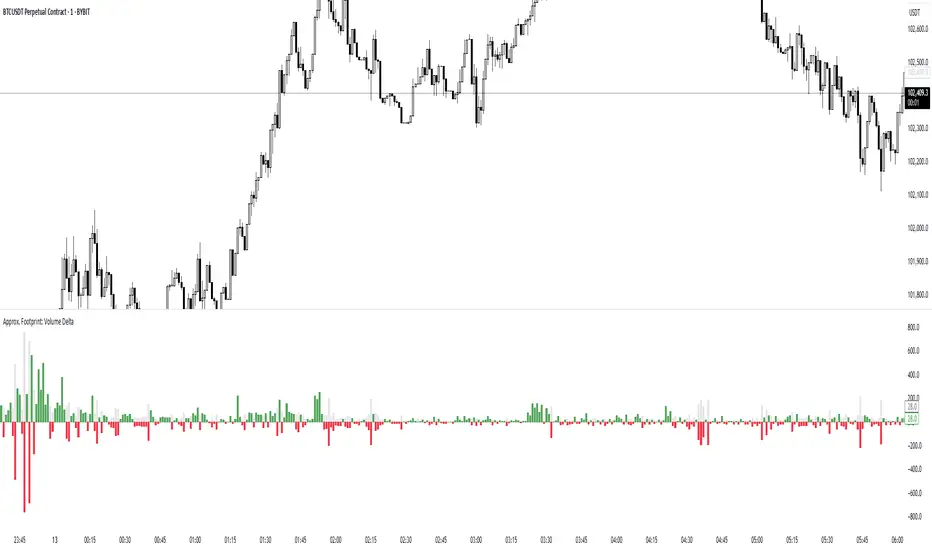
Approx. Footprint: Volume DeltaThis indicator brings you a simplified “footprint” view by charting the volume delta—the imbalance between bullish and bearish volume—alongside total bar volume.
Delta Bars: Green/red columns show where buyers (close > open) or sellers (close < open) dominated each bar.
Total Volume: Semi-transparent gray columns in the background give you overall context.
No Hidden Data: Works on any symbol/timeframe without tick-by-tick or bid/ask feeds.
Use it to quickly spot bars with strong buying or selling pressure, identify momentum shifts, and confirm breakouts or reversals—all within TradingView’s standard volume streams.
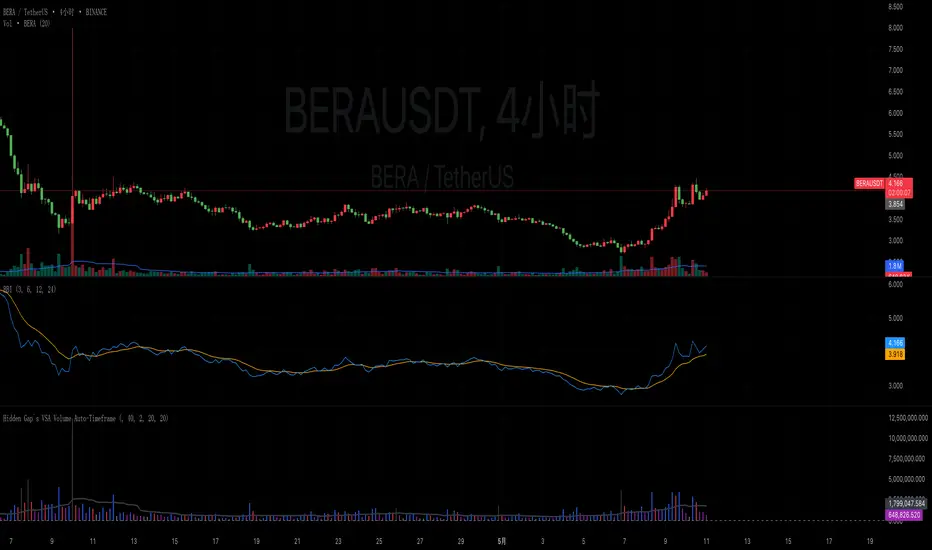
Hidden Gap`s VSA Volume Auto-TimeframeHidden Gap's VSA Volume with Auto-Timeframe Adaptation
Enhanced Version of Classic Volume Spread Analysis Indicator
Description:
This evolved version of the original "Hidden Gap's VSA Volume" indicator introduces intelligent timeframe adaptation while preserving its core Volume Spread Analysis (VSA) logic. The key enhancement automatically synchronizes volume calculations with your chart's current timeframe, eliminating manual resolution adjustments.
New Features:
✅ Auto-Timeframe Detection
Dynamically adjusts to any chart timeframe (1M/5M/1H/4H/D/W/M)
✅ Smart Resolution Switching
Seamlessly works across multiple timeframes without parameter changes
✅ Manual Override Option
Retains custom resolution input for multi-timeframe analysis (e.g., view weekly volume on daily charts)
✅ Modernized Engine
Upgraded to Pine Script v6 for optimal TradingView performance
Core Functionality Preserved:
• Multi-layer volume analysis using 40/20/2-period comparisons
• Color-coded histogram detecting:
Black: 40-period high volume
Gray: 20-period low volume
Purple: 2-period volume contraction
Blue/Red: Immediate volume changes
• Integrated 20-period SMA reference line
Usage Scenarios:
Intraday Trading: Auto-adjusts from 1-minute to 4-hour charts
Multi-Timeframe Analysis: Compare current volume against higher timeframe patterns
Swing Trading: Maintain consistent analysis across D/W/M timeframes
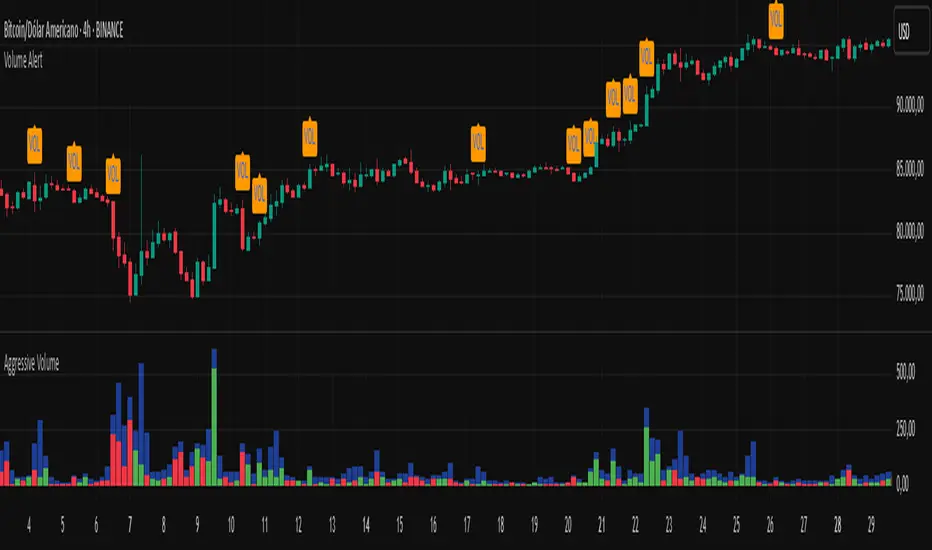
Volume AlertVolume increase alert: triggers an icon and alert when the current volume is X times greater than the previous one. The multiplier value can be adjusted as needed.
Português:
Alerta de aumento de volume: dispara um ícone e alerta quando o volume atual é X vezes maior que o anterior. O valor do multiplicador pode ser ajustado conforme sua necessidade.
Amihud Liquidity RatioCalculates liquidity as a sort of moving average over time
The Amihud Illiquidity Ratio (ILLIQ) measures the price impact of trading volume. It's calculated as the absolute daily return divided by the daily dollar volume:
𝐼𝐿𝐿𝐼𝑄ₜ = |𝑅ₜ| / 𝑉𝑂𝐿𝐷ₜ
Where:
|𝑅ₜ| is the absolute value on return day t
𝑉𝑂𝐿𝐷ₜ is the dollar trading volume on day t
Here's how you can incorporate this indicator into your analysis:
1. Identifying Liquidity Regimes:
High Liquidity (Low Indicator Values): When the indicator is consistently low, it suggests a market or asset where it's generally easier to enter and exit positions without significant slippage. This might be a more favorable environment for strategies that rely on tight spreads and efficient order execution.
Low Liquidity (High Indicator Values): When the indicator is consistently high or spiking, it signals periods of lower liquidity. This can lead to:
Increased Volatility: Fewer participants and larger bid-ask spreads can amplify price movements.
Higher Slippage: Executing large orders might result in getting a worse price than expected.
Gap Risk: Significant price gaps can occur between trading sessions due to a lack of continuous trading interest.
---------------------------------------------------------------------------------------------------------------------
2. Confirming Trends and Breakouts:
Trend Confirmation:
Uptrend with Increasing Liquidity (Falling Amihud): A healthy uptrend often sees increasing participation and ease of trading. A falling Amihud during an uptrend can provide confidence in the trend's sustainability.
Uptrend with Decreasing Liquidity (Rising Amihud): An uptrend accompanied by rising Amihud might be less stable. It could suggest that the price increase is driven by fewer participants and might be more prone to reversals.
The same logic applies to downtrends, but in reverse.
---------------------------------------------------------------------------------------------------------------------
Breakout Confirmation:
Breakout with Increasing Liquidity (Falling Amihud): A breakout accompanied by increasing liquidity (falling Amihud) can suggest strong conviction and a higher probability of the breakout being sustained.
Breakout with Decreasing Liquidity (Rising Amihud): A breakout on low liquidity might be more suspect and could be a "fakeout" if there isn't enough sustained buying or selling pressure.
---------------------------------------------------------------------------------------------------------------------
3. Identifying Potential Reversal Points:
Liquidity Exhaustion: Sometimes, a prolonged period of low liquidity (high Amihud) might precede a reversal. The lack of active trading interest at those levels could make the price more susceptible to a shift in sentiment.
Liquidity Surges: A sudden spike in liquidity (a sharp drop in Amihud) after a period of low liquidity could indicate renewed interest and potentially the start of a new trend or a reversal of the previous one.
-----------------------------------------------THANK YOU----------------------------------------------------------------------------------------------------------------------------------------------------------------------------------------------------------------------------------<3-----------------------------------------------
BTC Spot Aggregated Volume + 20EMAThe purpose of this indicator is to provide a more comprehensive view of Bitcoin's spot market activity by combining volume data from several sources.
1. Fetches and aggregates spot volume data for BTC from the following exchanges:
Binance (BTCUSDT)
Coinbase (BTCUSD)
Kraken (BTCUSD)
Bitfinex (BTCUSD)
Bitstamp (BTCUSD)
KuCoin (BTCUSDT)
Gate.io (BTCUSDT)
OKX (BTCUSDT)
Huobi (BTCUSDT)
2. Calculates a 20-period EMA on the aggregated volume to smooth out the data and identify volume trends.
This indicator is particularly useful for traders who want a broader view of real BTC spot market activity, rather than relying on a single exchange's data, which might be misleading or incomplete. By averaging across major exchanges, the indicator helps reduce noise and gives a more accurate picture of volume trends.
