Volume+ (RVOL By Time of Day)This script is an enhanced volume indicator.
It calculates relative volume (RVOL) based on the average volume at that time of day (rather than using a moving average).
For example, using this indicator you can see today’s volume during the first 5-minute candle of the market open compared to the previous day’s volume at the market open. Or you can see today’s volume at the market close during the last 15-minute candle compared to the average of the past 20 days of volume at the market close.
Due to the different quantity of candlesticks in a session between Stocks and Forex/Crypto, I separated those markets into separate settings, making this an all-in-one volume indicator that works on all markets.
Settings:
Stocks
If you set the lookback period to 1 on the 5-minute chart and look at the 9:30am candle for a stock, then the current volume bar will show you what today’s volume is compared to yesterday’s 9:30am 5-minute candle.
If you set the lookback period to 15, then the current volume bar will show you what today’s volume is compared to the average of the last 15 days of 9:30am 5-minute candles.
Max Lookback: 64 Sessions
Stocks
This setting is for traders who want to use this indicator on a timeframe lower than the 5-minute chart.
Due to limitations in how many historical bars PineScript can reference, referencing 1-minute and 3-minute bars requires a lot more historical data so I separated the two to allow the 5-minute+ timeframes to have a longer lookback period.
Max Lookback: 12 Sessions
Forex/Crypto
When you set the script to Forex/Crypto, it does the same thing for stocks but calculates based on a 24-hour period.
So if you set the lookback period to 1 on the 1-hour chart and look at the 11:00am candle for a currency pair, then the current volume bar will show you what today’s volume is compared to yesterday’s 11:00am 1-hour candle.
If you set the lookback period to 10, then the current volume bar will show you what today’s volume is compared to the average of the last 10 days of 11:00am 1-hour candles.
Max Lookback: 17 Sessions
What Doesn’t It Work On?
Because I had to manually calculate how many volume candles to look back per timeframe to get the previous session’s candle, I had to hard-code the math in this script.
That means that this indicator will only work on 1m, 3m, 5m, 15m, 30m, 45m, 1h, 2h, 3h, 4h, Daily and Weekly timeframes. If you try to use it on any other timeframe it will revert to a regular volume indicator.
Why Is It Useful?
Similar to volume profile by price, this gives you a volume profile by time in a way that the default volume indicator does not.
For example, you can use this to determine when a stock has a particularly strong opening drive, or when a currency pair has a weak fake-out leading up to the London open, or for general confirmation on trading signals with time-specific volume information to work with.
Colors
The purple line and the faint gray bar is the RVOL value.
The blue number is the percentage of the current volume bar relative to RVOL.
There are four different bar color settings:
Heatmap – Changes color to be brighter based on higher RVOL
Price – Changes color based on price action (like the default TradingView volume indicator)
Traffic – Changes color based on RVOL percentages (for fast visual cues)
Trigger – Changes color only when the specified alert conditions are met
Heatmap:
Traffic:
Trigger:
Price:
Heatmap:
Turns very bright green at 2.0 RVOL
Turns light green at 1.0 RVOL
Turns normal green at 0.75 RVOL
Turns medium green at 0.5 RVOL
Turns very dark green at 0.25 RVOL
Is gray otherwise.
Price:
Turns red if the price action candle closed bearish.
Turns green if the price action candle closed bullish.
Traffic:
Turns red if RVOL is between 1.0 and 1.5.
Turns orange if RVOL is between 1.5 and 2.0.
Turns dark green if RVOL is between 2.0 and 3.0.
Turns bright green if RVOL is above 3.0.
Is gray otherwise.
Trigger:
Turns teal if any of the given alert conditions in the user settings are met.
Alerts
Alerts are optional. You have to set them like any other indicator, by creating a new alert and selecting this indicator.
If you leave the "Alert At RVOL %" setting at 0, then alerts will only be triggered if the current candle exceeds the 1.0 (100%) RVOL level.
If you change the "Alert At RVOL %" setting then alerts will be triggered if the RVOL percentage (blue number) exceeds your given value. The blue number is a percentage of the average, so if it’s at 0.5, then it’s 50% of the average.
Notes
- This indicator only works with regular time bars. It will not work with range, tick, renko etc.
- This script has lookback limitations due to restrictions on how many historical bars PineScript can reference. The lookback limit varies based on the market type you choose. The more bars required for calculation the lower the lookback limit.
- If you use it on the Daily timeframe the lookback period will count as 1 week. If you use it on the Weekly timeframe the lookback period will count as 1 month. So a Lookback of 3 on the Daily would be 3 weeks of averages, a Lookback of 5 on the Weekly would be 5 months of averages (for that Day of Week or Week number).
- Big thanks to @tb12345 for the idea and for helping to field-testing the indicator!
X-volume

Highest Volume Index by ParaticaIt's an algorithm used in Paratica. It shows volume based volatility.

Volume in a panelIf you prefer to see volume in a panel rather than an overlay here it is. Just basic volume with moving average line.


RSI VOL StochasticFor a friend's request, a way to switch from basic rsi , volume or stochastic .
Even if it's possible to display multiple indicators at the same time it's not really usefull, the main use here is to use one most of the time and if needed switch between them.
By the way, I'm using only RSI 95% of the time and don't need more indicator but sometimes we juste need to check quickly something on volume or stochastic , so this script can be usefull for those type of usecase without losing display capabilities.
Pour la demande d'un ami, un moyen de passer de rsi , volume ou stochastique de base.
Même s'il est possible d'afficher plusieurs indicateurs en même temps, ce n'est pas vraiment utile, l'utilisation principale ici est d'en utiliser un la plupart du temps et si nécessaire de basculer entre eux.
D'ailleurs, je n'utilise que du RSI 95% du temps et je n'ai pas besoin de plus d'indicateur mais parfois nous avons juste besoin de vérifier rapidement quelque chose sur le volume ou la stochastique, donc ce script peut être utile pour ces types d'utilisation sans perdre les capacités d'affichage.

Bitcoin Stacked VolumesThe idea was to keep Bitcoin trading volumes on the different exchanges under control using only one chart and only one indicator. It works on ANY timeframe.
Settings
Lookback for SMA of volume from each exchange (default: 21 )
Option to include or not volumes that traded in stablecoin pairs (default: true )
Customizable volume quotas for alerts
Alerts
It has 30 different alerts which can be divided into 4 types:
Total Quota Exceeded
Total Volume/SMA Crossover
Quota Exceeded
Volume/SMA Crossover
Here are some examples how it helps to be aware the situation on 1-minute resolution:

MACD on Volume (Signal)Volume-Price-based 5-min-Chart Trading
Pull up a 5-min chart of your favourite commodity future and stay inside regular trading hours, but show all of globex trading, too.
You will want to base your trading off the 5-min chart on volume and price.
Volume Logic:
The (positive) histogram of your MACD on Pro Rata Volume* indicates market phases with valuable participation. Participate in those phases. Put a horizontal ray on your volume indicator to indicate slow and less than slow volume phases. Stay away from those market phases.
*) Pro Rata Volume = Actual Volume * 300 / elapsed seconds
(Do the platform test. Can you add this indicator to your platform?)
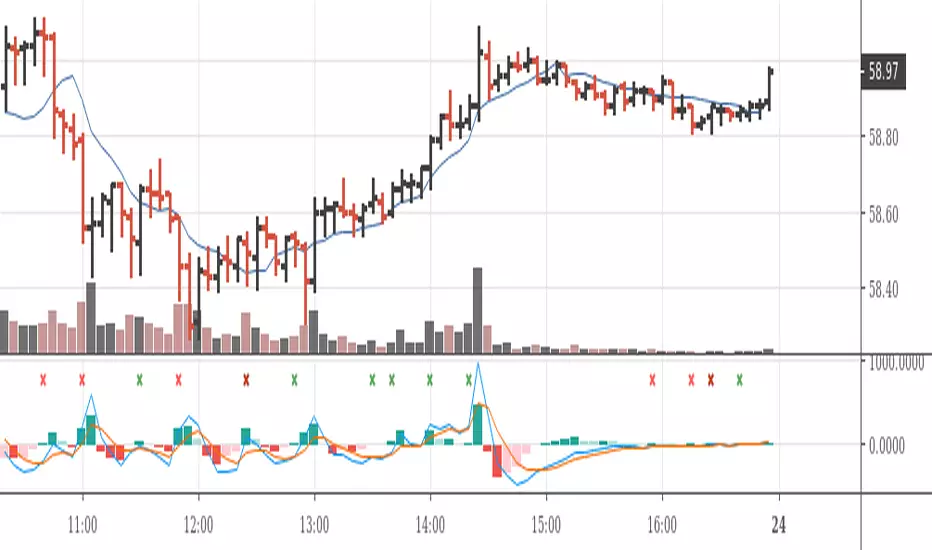
Volume Cloud [LucF]A strictly volume-based cloud. It plots current volume (green line) over its 20-period linear regression (red line) on the chart. Unlike Ichimoku's cloud, it is not offset. While probably not something that you would have on your charts all the time, it can provide a useful way to study the interaction between price and volume.
Because the green line is the current volume, you can forego volume columns when using the indicator.
Volume Cloud does have practical uses. I will show here how I use volume to help me in selecting better probability entries, with only Volume Cloud and my TLD indicator on the chart (the Volume Columns are there to provide context for first-time users of the Volume Cloud).
When looking for entries, I’m trying to find spots where a reversal from a bottom or a continuation after a pause is confirmed by increasing volume (preferably above average) candles with proper wick/body structure. The candle structure of increasing volume candles is important because for me, it provides granularity on the volume action during the candle. I view wicks as failed tests and body height as reinforcement of the price movement. As for candles where volume is not increasing, I mostly ignore them. This is a simplified account of my mindset; just the stories I trade with and that I believe provide an edge—and profits. I certainly don’t pretend having found an infallible way to trade, and there is much more to it that I can explain here, but let’s look at a chart.
Point 1: Solid increasing volume and above average down candle, but I don’t enter on big candles. The volume on that candle has reached a new high though, so I’m thinking bearish sentiment for the next bars.
Point 2: Nicely formed above average increasing volume candle, but I’m looking to short. A similar’ish candle 4 bars back was followed by non-descript action. After 2, a test of past resistance fails before reaching it and a lower low and then a lower high bring us to point 3.
Point 3: Exactly what I’m looking for. No upper wick, solid body that’s not too big, and the highest volume reached on chart yet as a bonus. I enter on the following candle and because of the solid context, I can use a tight stop at the previous candle’s high. Going down, I will move my stop to the high of any increasing volume candle going in my direction, starting when that point is at least as far from my entry as my stop (RR=1).
Point 4: This is the last point where I move my stop at the candle’s high and get stopped out at the following candle for a RR=3.75 trade. Notice how the very high volume at point 4 generates a relatively small body. This is often a sign of stopping volume that portends a reversal or a pause.
Point 5: A first above average increasing volume candle, but with longish wicks that don’t fit my idea of a solid candle. Definitely not a strong enough sign to bet on a reversal from the recent strong descent.
Point 6: This candle is a different story altogether. No lower wick, reasonably sized body, double the volume of previous candle and a close way above the previous 20 candles. Long entry with stop at candle 6’s low. I don’t move my stop on the candle following my entry because it wouldn’t put me at RR=1, so the first time I move my stop up is at candle just before point 7.
Point 7: I get stopped out for RR=3 after that candle because I will have moved my stop a second time, at candle’s 7 low.
I didn’t make these trades (can’t even short on Binance yet), and while this is a typical a posteriori story, it does reflect what I do in reality.

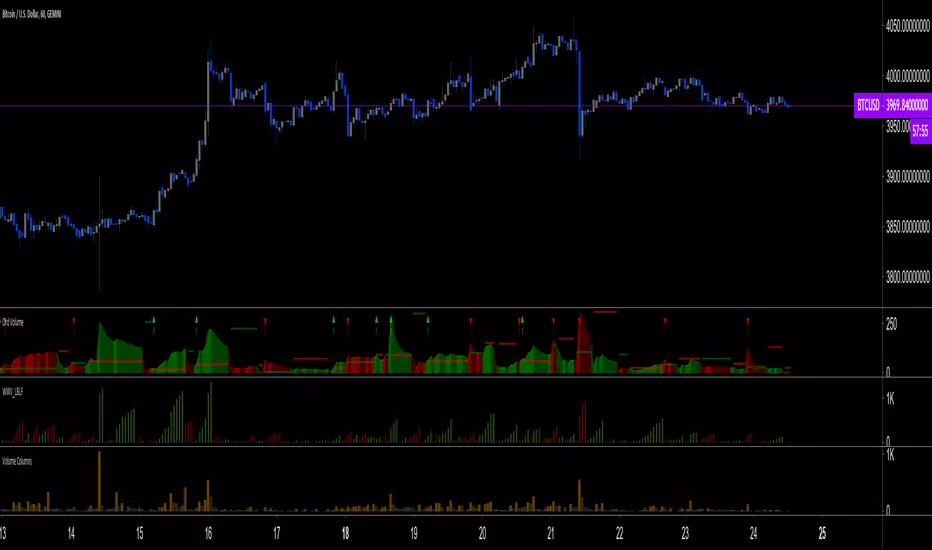
Ord Volume [LucF]Tim Ord came up with the Ord Volume concept. The idea is similar to Weis Wave , except that where Weis Wave keeps a cumulative tab of each wave’s successive volume columns, Ord Volume tracks the wave's average volume .
Features
You can choose to distinguish the area’s colors when the average is rising/falling (default).
You can show an EMA of the wave averages, which is different than an EMA on raw volume.
You can show (default) the last wave’s ending average over the current wave, to help in comparing relative levels.
You can change the length of the trend that needs to be broken for a new wave to start, as well as the price used in trend detection.
Use Cases
As with Weis Wave, what I look at first are three characteristics of the waves: their length, height and slope. I then compare those to the corresponding price movements, looking for discrepancies. For example, consecutive bearish waves of equal strength associated with lesser and lesser price movements are often a good indication of an impeding reversal.
Because Ord Volume uses average rather than cumulative volume, I find it is often easier to distinguish what is going on during waves, especially exhaustion at the end of waves.
Tim Ord has a method for entries and exits where he uses Ord Volume in conjunction with tests of support and resistance levels. Here are two articles published in 2004 where Ord explains his technique:
pr.b5z.net
n.b5z.net
Note
Being dependent on volume information as it is currently available in Pine, which does not include a practical way to retrieve delta volume information, the indicator suffers the same lack of precision as most other Pine-built volume indicators. For those not aware of the issue, the problem is that there is no way to distinguish the buying and selling volume (delta volume) in a bar, other than by looping through inside intervals using the security() function, which for me makes performance unsustainable in day to day use, while only providing an approximation of delta volume.
Total Volume Percentage (intraday)This script tracks the percentage of up vs down volume intraday. The intention is to get an idea throughout the day on sentiment changes regardless of how many handles are traded. This indicator should paint a clear picture on trend days by displaying an area with the same color (green for bullish and red for bearish). Please note that the default value uses the ticker for NYSE volume and not the security displayed on your chart. In other words, if you plot this on a chart with Amazon (AMZN) or Crude Oil or BITCOIN, it will still track the market's behavior. You can change the input on the indicator.
The coloring, up/down, are based on a moving average, which is also customizable. If you are doing intraday and you plot this on a 3-minute chart, you may want to set this at a relatively small timeframe.
Enjoy!

BTC exchange trade vol / on-chain transaction volThis Bitcoin indicator shows the percentage that the exchange traded volume is from the sum of the exchange traded volume + on-chain transaction volume.
The thin red line is the non-smoothed value calculated from daily volumes.
The thick black line is the 7-day EMA-smoothed value.
The exchange traded volume and the on-chain transaction volume are reported by Quandl and have a 1D resolution - so it is best to use this indicator on the daily time frame.
When the value is high, it shows the the interest of traders is high and they are intensely trading BTC. When the indicator is low, it means that BTC is "dormant": it is used for transfers, but not so much for trading - traders forgot about it for a while - which may be a good time to accumulate if the economy is in a general bull market.

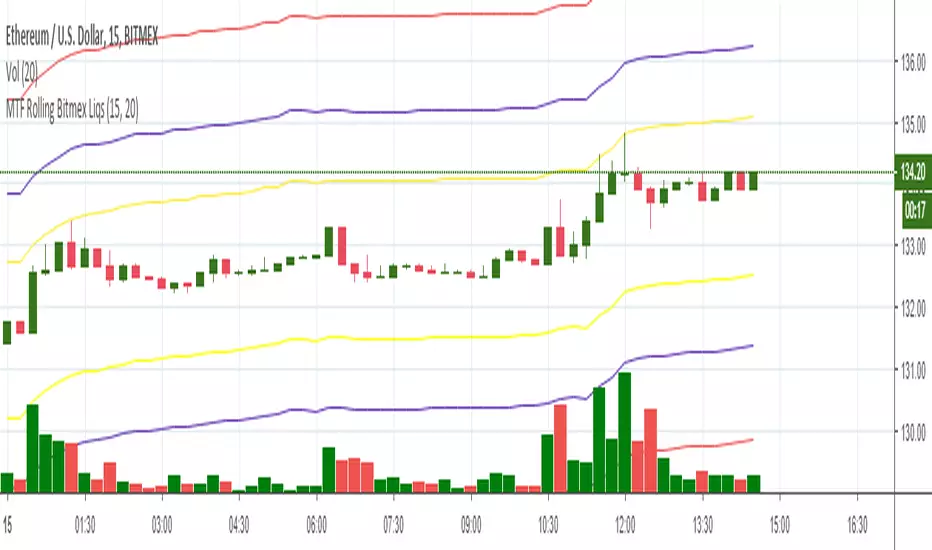
ETHUSD Multi Timeframe Rolling Bitmex Liquidation LevelsETHUSD Multi Timeframe Rolling Bitmex Liquidation Levels
Volume, Relative Volume HighlightThe indicator plots regular volume bars.
The highlight is given by the current cumulative volume for the day, compared to a custom average (standard 20 periods). The stronger the color, the higher the relative volume is. Stocks moving of higher relative volume have higher chances of making predictable moves.

Volume Momentum [LucF]Volume momentum gives much more information than a simple volume MA. It does require interpretation however, since increasing volume momentum can indicate strengthening of both an up or down movement. Volume momentum peaks and bottoms are also interesting as they often lead to shifts in price movement.
In order to help interpretation, I color rising volume momentum using price momentum. Green indicates volume-supported upward price movement and red indicates volume-supported downward price movement.
As to falling volume momentum, in my world view it indicates exhaustion or disinterest which requires prior price activity to be interpreted. In strong and steady price movements it can indicate a mere pause. After high price volatility often signalling a top or bottom, falling volume momentum often leads reversals.
Features
Two optional MAs on the main volume momentum line, with crosses on the short MA.
A higher time frame line (shown by default), with the higher time frame being a user-defined multiple of the current chart’s interval. The default is 8, so that a 15m chart will also show a 2h volume momentum.
Two Markers
Tops/Bottoms (marker 1): these occur on high/low price momentum pivots situated in favorable regions, combined with volume momentum peaks.
Pauses/Reversals (marker 2): these simply identify volume momentum high pivots that often lead to shifts in price movement. They are not directional. You can choose to color bars where these markers occur (shown on chart).
You can show only long or short markers.
Alerts
You can define alerts on any combination of markers you configure. After defining the markers you want the alert to trigger on, make sure you are on the interval you want the alert to be monitoring at, then create the alert, select Volume Momentum, use the default “Configured Markers” alert condition and choose your triggering window (usually “Once Per Bar Close”). Once the alert is created, you can change the indicator's inputs with no effect on the alert.
Use Cases
The higher time frame line is very useful in situating current volume activity in a larger context.
I consider all peaks in volume momentum as potentially significant events.
When looking for an entry, I will often wait for the descending volume momentum to change direction at a shorter interval, using price momentum to confirm that increasing volume is working in my favor.
Volume momentum variations can often inform otherwise insignificant price momentum activity.
Here I use price momentum to color volume momentum; inversely, I also use volume momentum to color my momentum indicator.
Notes
Where the markers on my Volume Columns indicator focus on confirming strength of price movements, this indicators’ markers try to focus on shifts in price movement.
My volume momentum is calculated using a smoother variant of CCI which came to be known as WaveTrend.

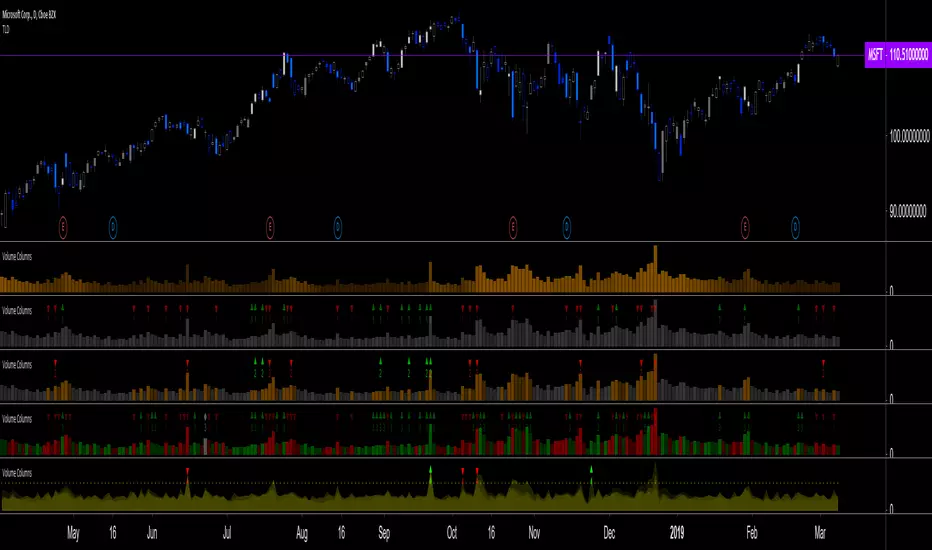
Volume Columns w. Alerts (V) [LucF]These are volume columns on steroids, for serious volume users. You can use the indicator to show volume columns or relative volume. You can define alerts using numerous conditions in both column and relative modes simultaneously. Multiple coloring schemes allow you to reveal volume columns in a much more useful light than the two-color standard.
Features
Seven Color Schemes
Plain gray.
Different color for columns above average MA.
Standard green and red.
Color gradient using the relative position of MA (default mode).
The first 3 schemes allow for highlighting increasing volume columns.
A gray column in an otherwise colored scheme indicates no change in price.
Two Modes
Column Mode: In this mode you can show the volume MA and mask the columns under it. The standard is an EMA because I think it better suits volume’s quick changes, but you can change it to the usual simple MA, as well as define its length.
Relative Volume: Calculations have been kept rudimentary. Current volume is simply compared to the previous bar’s volume. In order to compensate for this, a multiple area mode also compares current volume to 5, 15, 50 and 200 periods MAs. You can choose to view only the main relative volume value. Relative volume is capped in order to prevent the loss of detail caused by wild increases. The default cap is 10, but you can define your own. Spikes that are capped show a dot at their top. A separate threshold (its default value is the standard 2) is included for relative volume; it is used to generate relative volume markers.
Four Markers
Bumps (marker 1): A bump occurs when an increasing volume column is above its MA and the candle’s close is above/below the previous close.
Double Bumps (marker 2): A double bump occurs when 2 bumps are present in the last 3 bars.
Volume Over MA (marker 3): Triggers whenever volume is above MA. This is the noisiest of the markers.
Relative Volume (marker 4): This event occurs when relative volume crosses the pre-defined threshold.
You can choose to only show long or short markers.
Two Backgrounds
You can choose to highlight the background on bumps and double bumps.
Alerts
You can define alerts on any combination of markers you configure. After defining the markers you want the alert to trigger on, make sure you are on the interval you want the alert to be monitoring at, then create the alert, select V, use the default “Configured Markers” alert condition and choose your triggering window (usually “Once Per Bar Close”). Once the alert is created, you can change the indicator's inputs with no effect on the alert.
No worthwhile price movement exists without volume. It thus makes sense to define alerts on volume if you want to monitor markets. I use the markers to define two types of alerts. For general market scanning, I use markers 2 and 4 on high time frames. When I have identified a good opportunity for entry and am waiting for confirmation, I will often setup a custom alert for that market at a shorter time interval using markers 1 and 4.
Notes
Until we have access to delta volume information on TradingView, this indicator tries to get the most out of volume columns without using security calls at inside intervals to get more resolution on volume, because it slows things down considerably.
The chart shows different combinations of color schemes and markers, along with my TLD indicator on the chart.
Buy and Sell PressureThis indicator is an interpolation of the demand index by James Sibbet. Thomas Aspray, an experienced trader, suggests using DI in three formats, one of those was to plot the buying pressure (BP) and selling pressure (SP) as separate lines; which is what this indicator was designed to do. The green line represents the buying pressure and red line represents the selling pressure. Advantages:
Divergences between BP or SP and price. A divergence between the BP or SP and prices suggests an approaching change in the price trend.
Crossovers can be interpreted as bullish/bearish
Known issues: illiquid crypto forex pairs or stocks with a very low price (i.e. 0.0000056) will cause the BP and SP to not work correctly, this can be mitigated by changing the quote currency, choosing an exchange with more volume, or changing the time-frame to a longer value.
The Buy and Sell Pressure indicator is available for purchase at www.cryptoalphaindicators.com

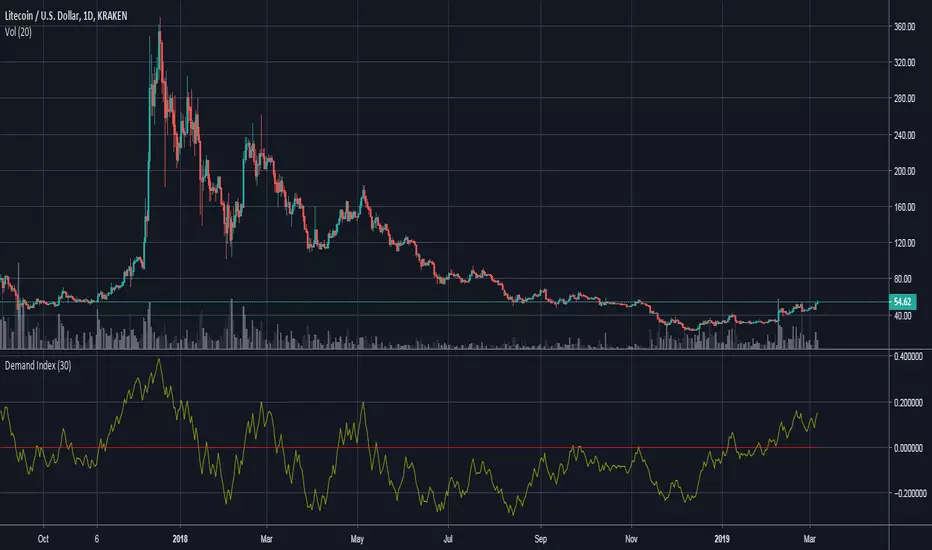
Demand IndexThis is an interpretation of James Sibbet's demand index (DI). The indicator does an excellent job of displaying:
Divergences between DI and price. A divergence between the DI and prices suggests an approaching change in the price trend.
Trendline analysis of DI showing levels of support/resistance, can help determine changes in trend.
As a leading indicator DI trendlines are often broken ahead of price trendlines.
Zero-line crossings can confirm previous signals as a lagging indicator.
The Demand Index indicator is available for purchase at www.cryptoalphaindicators.com
Trend Validation | www.cryptoalphaindicators.comThis indicator is designed to run in the background and provide a bird's eye view of what the prevailing trend is currently (positive/negative).
The navy blue background color indicates a positive trend underway and conversely the red background color indicates a negative trend has been detected.
Formulated with Ehler's Force Index and the Exponential Moving average.
The areas absent of color indicate that no satisfiable correlation was found between price (ema) and the price-to-volume indicator Ehler's Force Index (EFI).
The Trend Validation indicator is available for purchase at www.cryptoalphaindicators.com

Zero Lag Money Flow [jwammo12]This indicator adds Zero Lag principles to a modified Chaikin Money Flow.
This is essentially the Chaikin Money Flow indicator that uses true range to remove the issues that arise from gaps that the original CMF algorithm had. Then, momentum is used to remove lag from the indicator.
The Lag parameter is the lookback used for the momentum component

BP Scalper with resistance barsThis Script is used for scalping on the 15 min. It can do the other time frames but i built it for primarily the 15. There is some logic where i use the previous candles and i'm using intervals of 4 to get 1 hour estimates. This also works with the 1 hour, because the 4 hour is what it will compare with.
It uses Buy volume and sell volume to create the indicators.
If the buy volume starts losing traction on the sell volume the indicator triggers.

Volume Checker ProUsing this indicator allows you to verify sufficient stock trading volume directly in your stock chart at first glance.
If you would like to use this indicator drop me a line and send a request for it.
