Zig Zag Indicator

Crypto ZigZag RSI strategy 15minThis strategy is designed for crypto markets like ETHUSD/T, BTCUSD/T and so on.
It works amazingly with 15 min time frames.
Its idea consists in :
We have the RSI indicator, and with it we check for the crossover with overbought and oversold levels. At the same time we have the zigzag which is made from the higher highs and the lower lows between a specific price movement in %.
For entries, they are going to be based on the crossover of rsi with overbought or oversold levels , combined together with cross over 0 line from the the zigzag.
At the same time the strategy has the posibility to go only long, only short or both.
Let me know if you have any questions.

Double Zig Zag with HHLLHello Traders,
Here Double Zig Zag with HHLL script is with you. it calculates 2 Zig Zag simultaneously and draws them, and also it calculates and puts Higher High, Lower Low, Higher Low, Lower High labels. All these are done dynamically, it means last HH/HL/LL/LH can change. if price continues to go up then HL can turn to LL or if price continues to go down then LH can turn to HH. This script can be used for different purposes such trend analysis, support/resistance levels, breakouts etc.
I tried to make many things optional:
You can set Periods for Zig Zags as you wish
You can set different colors for both Zig Zag Up/Down lines
You have option to show both Zig Zag, one of them or none them
You have option to show both HHLL, one of them or none them
You can set Zig Zag 1 line style as Dashed or Dotted
You can set Line Widths for Zig Zags
Some examples:
Enjoy!

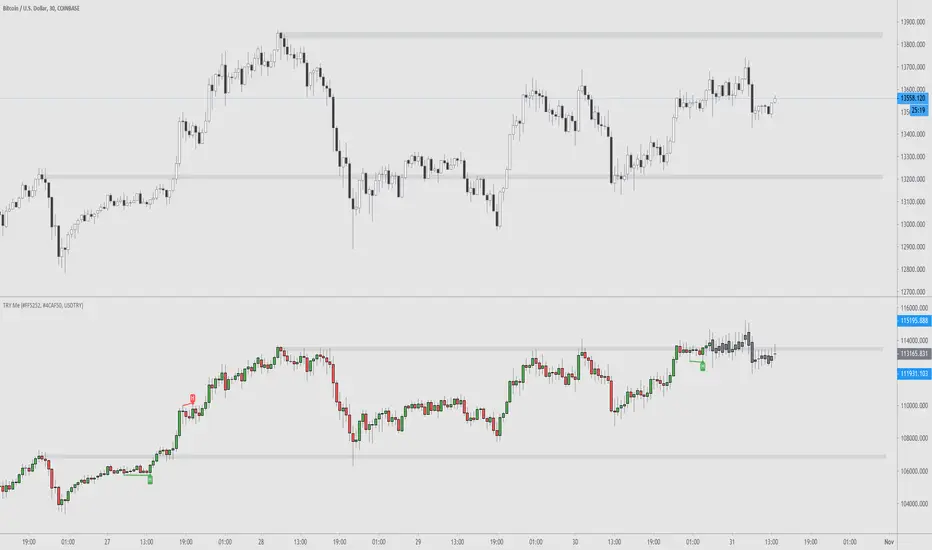
TRY Me - Turkish Lira Quote Currency DivergencesThis is a conceptual indicator that converts the main chart series' quote currency from U.S. dollar to Turkish Lira. Should only be used with USD pairs unless you change the 'Pair' input.
Divergences are created by the difference in price due to the incredible changes in TRY value. The candle colors turn to grey when the forex exchange is closed; this is done to show you that the quote currency value won't change.
Support and resistance levels are also possible to be drawn.
Options to configure are changing the quote pair, colors, and turning the divergences on or off.
RSI Tops and BottomsHello Traders
This script finds Tops when RSI is in overbought area or Bottoms when RSI is in oversold area and checks the divergence between them. it checks divergence at tops/bottoms after RSI exited from OB/OS areas.
You can change overbought / oversold levels.
You can limit the time that RSI is in OB/OS area with the option "Max Number of Bars in OB/OS"
you can set the minimum/maximum distances between Tops/Bottoms with the options "Min Number of Bars between Tops/Bottoms" and "Max Number of Bars between Topss/Bottoms"
and you can set the color and line widths as you wish.
These tops or bottom must be sequential, means there mustn't be another top while checking tops or bottom while checking bottoms between them.
in next example you can see valid and invalid bottoms:
After you got signal then you better use Stop Order, a few pips higher than the high of colored candle for long positions, ( vise versa in short positions ). so you may escape from traps. ("Stop order" is filled when the price reached a pre-specified price. for example the price is now 10.0 and you set Buy Stop Order at 11.0 then if price reaches 11.0 then your buy order get filled. you can put stoploss a few pips lower than the low of colored candle or you can use ATR to decice stoploss level. how you wish)
For example in following screenshot you can see that buy stop order was not filled and you didn't take long position.
Enjoy!

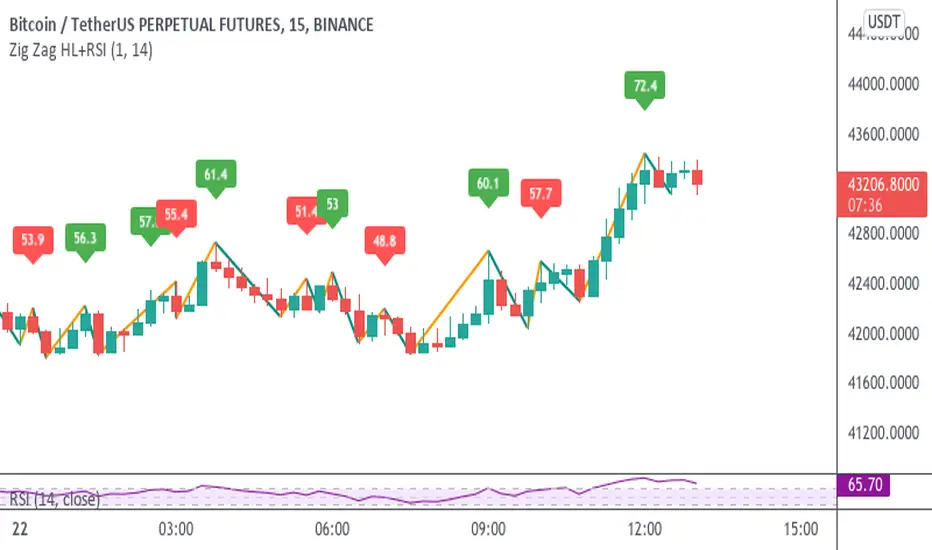
Zig Zag High-Low + RSIThis indicator adds to the functionality of Tr0sT's Zig Zag High Low Indicator by adding the RSI value above the higher-high to eyeball whether the current trend (signified by consecutive higher-highs and higher lows or consecutive lower highs and lower lows) is strengthening or weakening.
THEORY / METHODOLOGY:
If the uptrend is strong, the later pivot high will have a greater RSI number than the previous pivot high indicating an opportunity to go long. In a downtrend the lower high should have a lower RSI than the previous lower high indicating an opportunity to go short. If it does not, it is an indication that the trend is weakening.
ACTION:
If the ZigZag has higher highs and Higher lows and a strengthening RSI, look for Long opportunities on the lower time frame. If the ZigZag has lower highs and lower lows and a weakening RSI, look for Short opportunities on the lower time frame.
USAGE:
This methodology works best and produces the most opportunities when the markets are active, i.e. between 6AM-11AM EST
Thanks to Tr0sT for the original ZigZag High-Low indicator.
Tr0sT: www.tradingview.com
Zig Zag High Low Indicator:
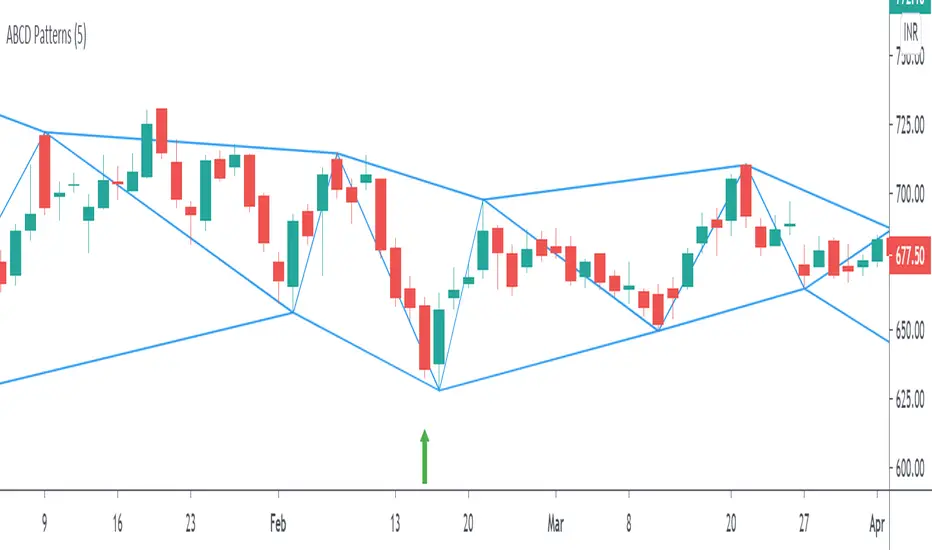
ABCD Harmonic PatternsShows Bullish and Bearish AB=CD Harmonic Patterns with Pivot High, Pivot Low and Pivot Line
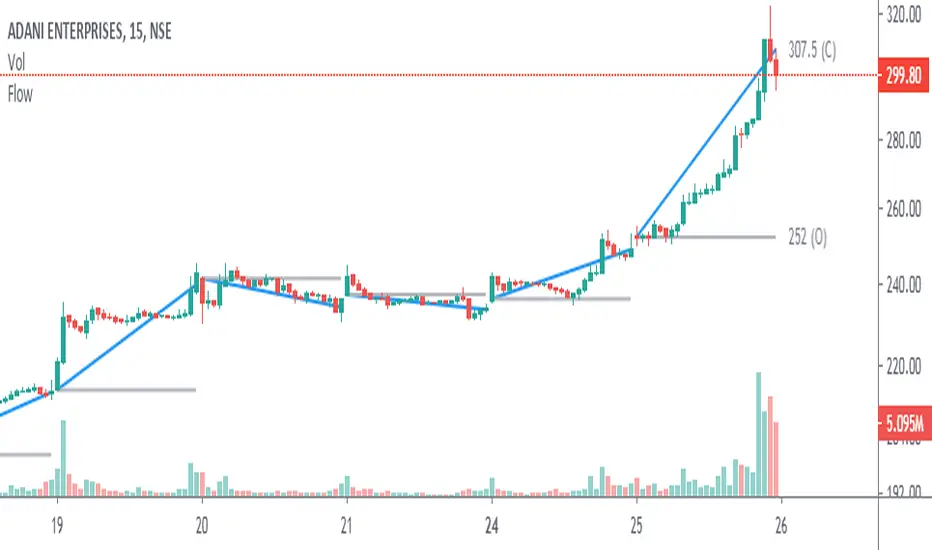
Angle & Price FlowThis is a simple end of the day indicator based on open and close values.
Angles:
Identifying narrow angles helps to find breakouts
Maximum angle = High chance of reversal
Minimum angle = Chance of breakouts on the next day or upcoming days.
Price Flow:
I personally use price flow to simplify the flow of candlestick chart and to identify breakouts using rounding bottoms and rounding top patterns, sharp corners for reversals.
Features:
Multi time frame
Labels
Hide previous period
Combine it with other indicators for better result.

Consolidation Zones - LiveHello Traders!
This is the script that finds Consolidation Zones in Realtime.
How it works?
- The script finds highest/lowest bars by using "Loopback Period"
- Then it calculates direction
- By using the direction and highest/lowest bar info it calculates consolidation zones in realtime
- If the length of consolidation area is equal/greater than user-defined min length then this area is shown as consolidation zone
- Then Consolidation Zone extends automatically if there is no breakout
if you increase the Loopback Length then you get bigger consolidation zones:
You have option to "Paint Consolidation Area" or not:
Enjoy!

Key price levelsFunction: labelling recent highs and lows automatically. Easy and clean.
In this example, we can see the previous low of the ticker is around 105.5, the previous high is around 120.
We can set up our entries and exits by referring to the last lows and highs.
Users can adjust the searching bar range by themselves.

RSI Swing Indicator v2The 2nd version of this indicator came quick :)
As the previous one, it draws swings on the candlesticks, based on price action and RSI.
Also in the labels you can see if the current swing is higher or lower to the previous one.
HH stands for Higher High
LL stands for Lower Low
LH means Lower High
HL means Higher low
THIS IS NOT A STRATEGY, this is for TREND analysis.
Please stop asking if it "redraws", because it doesn't matter.
The labels are not SELL or BUY signals

RSI Market StructureThis indicator draws swings on the chart based on the RSI configured within.
The swings are drawn from Overbought to Oversold or vice-versa.
Logic:
From Overbought to Oversold, a line is drawn from the highest price before oversold to the lowest price of the oversold.
The labels can be deactivated from the style menu, it was easier for me to implement this way (It's my first indicator)

Fibonacci + RSI - StrategyStrategy: Fibonacci + RSI:
- Intraday trading strategy (Scalping).
Time Frames Tested with best Results:
30 Minutes.
5 Minutes.
15 Minutes.
1 Minute
Indicators Used:
RSI (30 / 70)
Fibonacci (1 - 0.784)
How it Works:
Once the Price Hits the 1 or -1 Fibonacci Level and bounces a little bit, It checks the RSI if Over Bought or Over Sold According to 30 - 70.
If both conditions are satisfied, it triggers a Long or Short Positions.
Further Notes:
- I have put a Stop-loss with a 2% just for further upgrades.
- Not advised to use in High Volatility Markets.
- No Repaint was observed during a 2-Weeks Tests.
If you have any suggestions or modifications please contact to add.
If you have observed any bad behavior please contact to fix.
Trade wisely.

Zig Zag High LowZig Zag script that uses local minimums and maximums as pivot points. It can be used as a source for pattern recognition.

Smart Indicator 28 - Swing Pivots (Higher Highs and Lower Lows)A simple way to find Higher Highs and Lower Lows (HH and LL) whit automatic Fibonacci Lines in the most common levels.
In this indicator the Higher Highs only happens when a high value are rising from each other in the last "Length of Real Pivots" highs and the next same number of highs are falling in every single bar.
The Lower Lows are inverted, LL only appears if a low is falling in every single bar in the last number of length and the lows price of the "n" bars next are rising.
You can use this Indicator in any kind of market.

Trend LinesHello Everyone! This is my new trend lines script (after beta version that was published almost one year ago)
The idea is to find Pivot Highs (PH) and Pivot Lows(PL) first.
Then, If current PH is smaller then previous PH (means no new higher high and possible downtrend) then draw trend line using them. and also it checks previous trend line (if exits) and if current angle is smaller then don't extend previous one.
Same idea when using Pivot Lows, If current PL is higher then previous PL (means no new lower low and possible uptrend) then draw trend line using them. and also it checks previous trend line (if exits) and if current angle is smaller then don't extend previous one.
Optionally style of old trend lines drawn as dashed.
Hope you enjoy it!

[fikira] Harmonic Patterns 2This is "Harmonic Patterns", part 2 Open Source
(in 2 parts, otherwise many lines are gone because the script is too large):
- Crab
- Bat (+ Alt)
- Butterfly
- Shark
A "Pattern" is created by checking 5 consecutive ( pivot ) points, starting with X, A, B, C, and ending with point D.
At point D all 5 points are compared, calculated and verified.
When confirmed, a "Label" will be plotted at point D, together with the "Entry", "Take Profit" and "Stop Loss" price.
The "Entry", "Take Profit" and "Stop Loss" lines will be plotted as well at point D.
Lastly, a "Drawing" automatically will be displayed which makes the "Pattern" visible.
Please do mind, the "Drawing" is calculated differently, the "Drawing" sometimes can be displayed incorrectly
when prices are too close to each other (for example low Satoshi price changes).
THE "ENTRY", "TAKE PROFIT", "STOP LOSS" PRICES AND LINES ARE NOT AFFECTED AT ALL BY THIS, THEY WILL SHOW CORRECTLY!
- 1 "TP point" can be changed ("TP Level 0.618")
- "Labels", "Lines", "Drawings" can be disabled/enabled
- "Labels" can be made smaller or bigger ("Size Label")
- "Labels" can be placed further or closer to the bar ("Distance TP Label" > higher = closer, lower = further)
- "Lines" can be made thicker or thinner ("TP Linewidth")
- "Drawings" can be made thicker or thinner ("Drawings Linewidth")
- "Drawings" are created by comparing with 100 bars back in history (default), should it be (very rarely) a triangle is displayed flat on the left side,
possibly the first point(s) is/are further than 100 bars ago, in this case increase "Period Drawings" above 100.
- Animal symbols can be enabled/disabled
- When several "Patterns" appear on the chart, the oldest ones won't be displayed anymore, first the "Drawings", then the "Lines"
The last (present) ones will always be displayed in total without a problem!
- If you want to see "Patterns" with less correct measurement, change "Error Marge" 0.9 - 1" and "Error Marge" 1 - 1.1"), this gives max. about 10% extra margin
- Added more settings regarding "Drawing Lines"
Thank you very much!

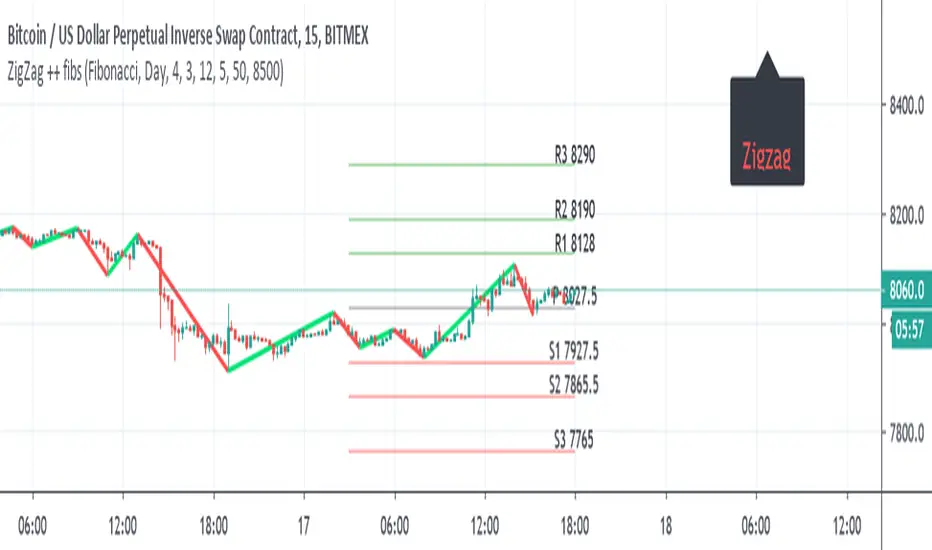
ZigZag ++ fibsI just put this as one user ask for me to do it.
So it the zigzag++ and fibs ,and other pivots type
the fibs can daily , monthly , year
the info panel need to be adjusted by either offset =distance from
or by putting a number , here its btc so I put about 500 above from close =8500
this important as otherwise it will look messy and not pretty
so for each type of asset you use , you expect to adjust this two variables or the data of fibs (daily , weekly etc)
ZigZag - lucemanb
THIS CODE IS BASED FROM THE MT4 ZIGZAG INDICATOR
THE ZIGZAG SETTINGS FOR THE MAIN ONE ON TRADINGVIEW DO NOT WORK THE SAME AS MT4
I HOPE U LOVE IT
I have had tons of experience on the ZIGZAG indicator and thought this might help someone.
Enjoy this code. Zigzag is a good indicator in many ways and people underestimate it because of its repainting
Check out some work ave done with this script. This is some intense angle trading requested by someone


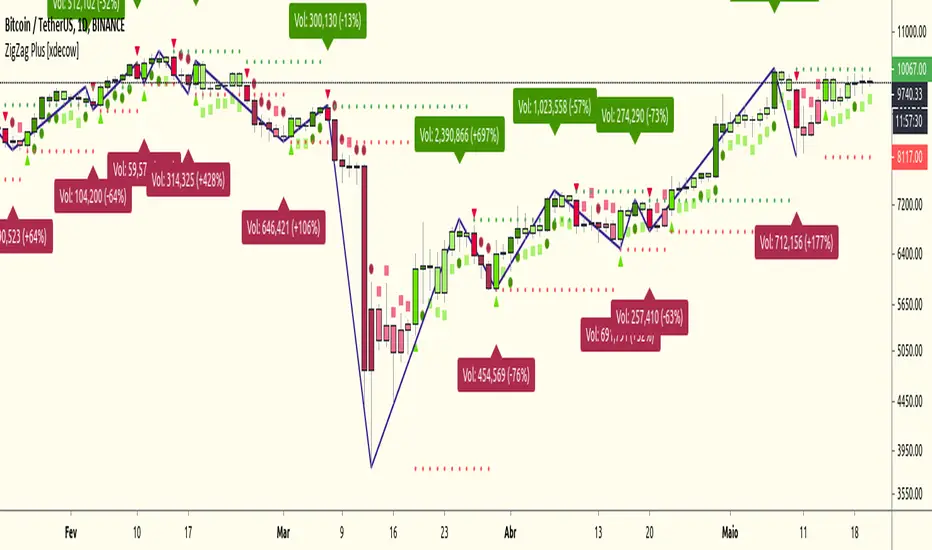
ZigZag Plus [xdecow]A ZigZag Like based on candle close.
A lot of options that can be hide in options.
Triangle/bright - reversal confirmation candle
Circle/dark - higher/lower candle breakout
Square/light - Insidebar
Average True Range PercentageUseful in finding the percent change in the ATR. Google it and see how you can implement it. I use it in a zig zag indicator made by Ricardo Santos.
Happy Trading!
