$1000BONK/USDT – 1H Chart AnalysisCurrently testing the downtrend resistance (green line) and showing signs of consolidation near $0.0143. Watching for a breakout or breakdown from this key level.
Key Levels:
Support: $0.014202 (blue), $0.014551 (yellow zone)
Resistance TP1: $0.015794
Resistance TP2: $0.017997
Scenarios:
🟩 Bullish: A confirmed breakout above the downtrend and TP1 zone could lead to a rally toward TP2.
🟨 Neutral: Sideways movement between $0.0145 and $0.0158 suggests accumulation before the next move.
🟥 Bearish: Rejection from the resistance zone and a breakdown below $0.0145 may lead to further downside.
📊 Volume and structure suggest a breakout is likely soon.
🔔 Set alerts around $0.0158 and $0.0145 for breakout confirmation or failure.
1000BONKUSDT trade ideas

$BONK Breakout ConfirmedSEED_DONKEYDAN_MARKET_CAP:BONK Breakout Confirmed
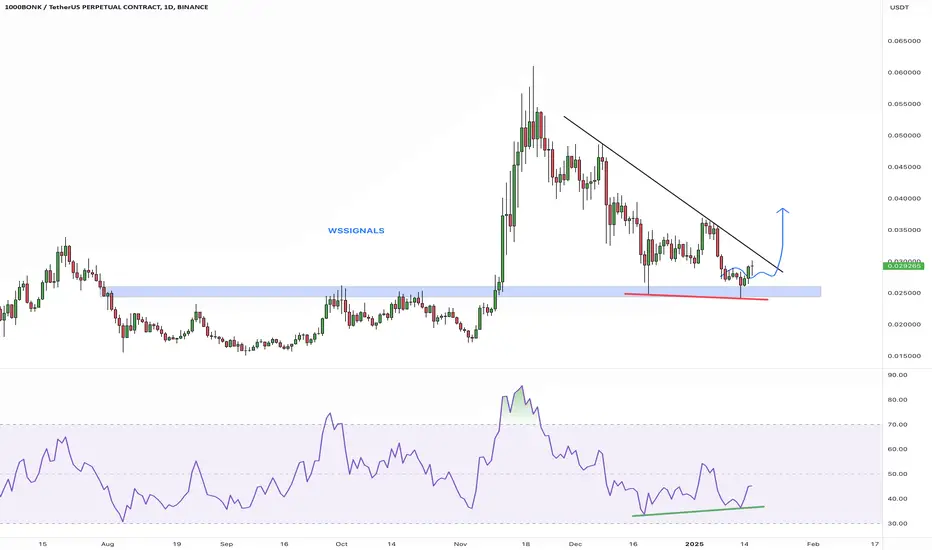
The $1000BONKUSDT 1D chart shows a breakout from a long-term downtrend followed by a successful retest of the key support zone around $0.016390.
This area, previously resistant, is now acting as strong support.
If it holds, BONK could rally up to $0.040830, a potential 150% upside.
Invalidation occurs on a clean break below the support zone. Structure remains bullish for now.
DYRO, NFA

1000Bonk Day Trading SetupIf you see price starts consolidation at the poi, or see any 5m big green candle then enter with proper SL, will update trade should be closed or not.

$BONK just broke out SEED_DONKEYDAN_MARKET_CAP:BONK just broke out of a long downtrend after a double bottom
- Retesting support at $0.016 holding strong.
- Target: $0.061 (+278%)

BONKE Set to Surge: Big Pump Incoming! (12H)At the top of the chart, there is a liquidity pool that is expected to be swept soon.
There are two bullish iCHs visible on the chart, along with a double bottom pattern. The descending trendline has also been broken.
If the Key Level support holds, the price could move toward the red box area.
A daily candle close below the Key Level would invalidate this analysis.
For risk management, please don't forget stop loss and capital management
When we reach the first target, save some profit and then change the stop to entry
Comment if you have any questions
Thank You

1000BONKUSDT: Ready for a Breakout?
🔥 **1000BONKUSDT.P** has been consolidating under resistance for a long time, accumulating liquidity. The price has tested **0.017630 USDT** multiple times, and whales are clearly building positions. The question is: will we see a breakout, or will there be another dip before the pump?
---
🔑 **Key Levels:**
**Support:**
**0.017630 USDT** — Major demand zone. A breakdown below this level could trigger further declines.
**0.016800 USDT** — Last defense for bulls to maintain the uptrend.
**Resistance:**
**0.018481 USDT** — Initial liquidity zone, where a local rejection may occur.
**0.019000 USDT** — Key level that, if broken, opens the way to 0.020 USDT.
**0.024379 USDT** — Ultimate target where large players might start taking profits.
---
🚀 **Trading Strategy:**
**Entry Points:**
- Long upon breakout of **0.018481 USDT**, confirmed by volume increase.
- Alternative entry on a retest of **0.017630 USDT**, provided support volumes increase.
**Stop-Loss:**
- Below **0.016800 USDT** to avoid liquidity grabs before the potential move up.
**Take-Profit Targets:**
**0.019000 USDT** — Partial profit-taking, securing position.
**0.020000 USDT** — Major target if momentum follows through.
**0.024379 USDT** — Ideal scenario if a strong impulse move occurs.
---
📈 **Market Analysis:**
Price has been consolidating near resistance, suggesting an impending breakout.
Large orders in the order book indicate whale activity.
Volume is starting to pick up, signaling a potential phase transition.
---
💡 **Conclusion:**
1000BONKUSDT.P is at a decisive moment. A confirmed breakout above **0.018481 USDT** could lead to a strong bullish move. However, if another fakeout and dump happen, it's time to reassess. What’s your take—ready for the pump? 🚀💬

Bonk will go bonkers nextRemember to be careful. BTC should have broken the resistance by now. as time goes on we are slowly going from bullish to bearish.
Good luck

Identifying Fakeouts and Enhancing Risk Management in TradingEducational Purpose:
This tutorial aims to educate traders on identifying fakeouts, understanding their characteristics, and improving risk management strategies to avoid common pitfalls.
Key Educational Points:
1. What is a Fakeout?
A fakeout occurs when the price temporarily breaks a key support or resistance level but fails to sustain the move, reversing quickly. It often traps traders who enter prematurely.
2. Spotting Fakeouts:
Volume Analysis: Fakeouts typically show weak volume during the breakout. Always confirm breakouts with a noticeable increase in volume.
Market Context: In range-bound or choppy markets, breakouts are less reliable. Look for additional confirmation before entering trades.
Follow-Through: Wait for at least one or two candles to close above resistance or below support after a breakout.
3. Risk Management During Fakeouts:
Set Tight Stop-Losses: Place stop-loss orders close to the breakout level to minimize losses if the move fails.
Use Confluence: Combine multiple factors (e.g., trendlines, moving averages, Fibonacci retracements) for stronger confirmation.
Plan Your Targets: Avoid overly aggressive targets unless the breakout is supported by strong market structure and volume.
4. Trading Psychology:
Patience is Key: Do not rush into trades at the first sign of a breakout. Wait for confirmations to reduce emotional decision-making.
Learn from Losses: Treat fakeouts as learning opportunities. Analyze what went wrong and refine your approach.
Practical Application:
In the attached chart of 1000BONK/USDT, a failed breakout (fakeout) highlights these principles:
Weak volume during the breakout.
Lack of follow-through above resistance.
A reversal that would have been avoided by waiting for confirmation.
This tutorial emphasizes that proper confirmation, risk management, and trading psychology are essential for avoiding fakeouts and improving overall performance.
Let me know your thoughts or share how you approach such situations!

BONK/USDT - 4-Hour Volume Footprint Chart AnalysisVolume Footprint Insights:
Delta Analysis:
Dominant positive deltas (+269M, +70M) signal aggressive buying during recent moves.
Volume spikes in consolidation (4.37B total) suggest the market is preparing for a significant move.
Liquidity Zones:
Demand Cluster: 0.032–0.033 USDT.
Minor Resistance: 0.036 USDT, but selling pressure is weaker than buying pressure.
Indicators Overview:
RSI: At ~59, showing moderate bullish momentum with room to grow before overbought levels.
MACD: Bullish crossover with expanding histogram supports an upward trend.
Directional Index: Positive DI > Negative DI, confirming growing bullish strength.
Moving Averages: The price is above short-term MAs, and medium-term MAs are flattening or curving upward, signaling a potential bullish reversal.

BONK/USDT - 4-Hour Volume Footprint Chart Analysis1. Price Action:
Trend Shift: Clear breakout from a descending trendline; higher lows are forming.
Consolidation Zone: Price is currently consolidating between 0.032–0.036 USDT, which is critical for the next move.
Support & Resistance:
Strong support at 0.026 USDT.
Resistance at 0.036 USDT, with the next significant resistance at 0.045–0.050 USDT on a breakout.
2. Volume Footprint Insights:
Delta Analysis:
Dominant positive deltas (+269M, +70M) signal aggressive buying during recent moves.
Volume spikes in consolidation (4.37B total) suggest the market is preparing for a significant move.
Liquidity Zones:
Demand Cluster: 0.032–0.033 USDT.
Minor Resistance: 0.036 USDT, but selling pressure is weaker than buying pressure.
3. Indicators Overview:
RSI: At ~59, showing moderate bullish momentum with room to grow before overbought levels.
MACD: Bullish crossover with expanding histogram supports an upward trend.
Directional Index: Positive DI > Negative DI, confirming growing bullish strength.
Moving Averages: The price is above short-term MAs, and medium-term MAs are flattening or curving upward, signaling a potential bullish reversal.
Scenarios
Bullish Scenario:
Triggers:
Breakout above 0.036 USDT with strong volume and positive delta.
Price Target:
Immediate: 0.045 USDT.
Extended: 0.050 USDT or higher if momentum sustains.
Indicators Supporting Bullish Move:
Strong buying pressure in the volume footprint.
Consolidation indicates a potential breakout structure.
Bearish Scenario:
Triggers:
Breakdown below 0.032 USDT with increasing sell-side delta and volume.
Price Target:
Immediate: 0.028 USDT.
Extended: 0.026 USDT if selling accelerates.
Indicators Supporting Bearish Move:
Failing to hold 0.032 USDT would invalidate the bullish setup.

Comprehensive BONK/USDT AnalysisKey Observations
Price Action:
Breakout from a downtrend; consolidating at 0.032–0.036 USDT.
Support: 0.026 USDT. Resistance: 0.036 USDT, then 0.045–0.050 USDT.
Volume Footprint:
Positive deltas (+269M, +70M) indicate strong buying pressure.
Volume spike near 4.37B signals market readiness for a breakout.
Key demand zone: 0.032–0.033 USDT.
Indicators:
RSI (~59): Moderate bullish momentum.
MACD: Bullish crossover.
Directional Index: Positive DI > Negative DI, showing rising bullish strength.
Scenarios
Bullish:
Action: Watch consolidation; breakout signals continuation to higher targets.

BONK/USDT Analysis: Consolidation Before Potential BreakoutBONK/USDT is currently trading at $0.0334, consolidating within a key zone as it tests the descending trendline resistance. Volume is increasing, signaling growing buyer interest, but confirmation of breakout momentum is still awaited.
Market Status:
Metric Status
Time Frame Check
Consolidation Yes
Breakout Waiting
Momentum Waiting
Volume Increasing
IFC Candle Waiting
RSI: 64, signaling strong momentum but approaching overbought levels.
ADX: Positive DI dominance, confirming bullish bias as trend strength builds.
Volume: Increasing, indicating accumulation ahead of a potential breakout.
Trade Strategy:
Entry: Above $0.037.391 with a confirmed close and high volume.
Targets: $0.060 (long-term).
Stop-Loss: Below $0.030874 to minimize risk.
If rejection occurs at $0.035, a retest of $0.030 or $0.025 may provide better entry opportunities. Monitor breakout momentum closely, as confirmation is essential.
Feedback and alternate views are welcome to refine this analysis further!

BONK/USDT Analysis: Potential Breakout Ahead
BONK/USDT is trading at $0.0332, forming a bullish structure after bouncing from the $0.025 support zone. The recent breakout attempt from the descending channel is a positive signal, with potential for further upside if key resistance levels are breached.
Key Levels to Watch:
Support: $0.030 (near-term), $0.025 (major support)
Resistance: $0.035 (trendline resistance)
Indicators:
RSI: At 63, reflecting strong momentum but approaching overbought levels.
ADX: Indicates strengthening trend, with DI+ dominance supporting bullish bias.
Volume: Rising, confirming increasing buyer interest.
Trade Plan:
Entry: Above $0.037111 with volume confirmation.
Targets: $0.060 (long-term).
Stop-Loss: Below $0.030864 to minimize risk.
A rejection at $0.035 could lead to a pullback towards $0.030 or $0.025 for a better entry. Watch volume closely for confirmation of a breakout.
Feel free to share your feedback or insights to enhance this analysis!

BONK Seems like bottomed out & Ready for the Breakout!Bought some #BONK #1000BONK
Bullish divergence RSI on the previous resistance retest!
Delik, reversal to uptrend! Hold on!Bonk (BONK):
Similarly, Bonk (BONK) is also showing signs of an impending breakout as it approaches the upper resistance of its falling wedge formation. Trading at $0.00003141, BONK has been consolidating for weeks but now appears to be building momentum.
The RSI for BONK is at 43.88, suggesting that there is room for upward movement if buyers step in. The MACD indicator also reflects a waning bearish trend, with the potential for a shift in momentum.

BONK DELIK CRYPTO PONGThe Bonk (BONK) token experienced a 7.2% decline in price following the recent token-burning event, which successfully removed 1.69 trillion BONK tokens—valued at over $51 million—from circulation.
The event, dubbed “BURNmas,” was initially scheduled for Dec. 25 but took place a day later on Dec. 26 at 5:40 p.m. UTC.
This substantial burn reportedly accounted for 1.85% of the total circulating supply, reducing it from 100 trillion to approximately 90.97 trillion BONK tokens. The Bonk team had proposed burning 1 trillion tokens through community engagement on social media, offering to burn 1,000 BONK for posts that used the hashtag #LetsBONK and 10,000 BONK for each new follower on platforms like Instagram and TikTok.

Bonk DetailedThe current price of BONK / TetherUS (BONK) is 0.00002987 USDT — it has fallen −2.32% in the past 24 hours. Try placing this info into the context by checking out what coins are also gaining and losing at the moment and seeing BONK price chart.

BONK possibly before UptrendThe current price of BONK / TetherUS (BONK) is 0.00002987 USDT — it has fallen −2.32% in the past 24 hours. Try placing this info into the context by checking out what coins are also gaining and losing at the moment and seeing BONK price chart.

1000B0NKUSDTnice setup for possible bull up as its exciting above the daily and weekly pivot and cause they are so close the make a cluster and you can see how its broken with one green candle now aiming for R1 and R2 which are our TP

BONK longIt swept a Daily low and currently in support zone, would be logical place to bounce here if Bitcoin allows. This flush on alts is a bit overly dramatic...

1000 BONK - UPTREND!!!About Bonk
What Is Bonk (BONK)?
According to the one-pager, BONK is the first dog-themed coin on Solana "for the people, by the people" with 50% of the total supply of the cryptocurrency airdropped to the Solana community. BONK is similar to Shiba Inu (SHIB) and Dogecoin (DOGE) memecoins, it was launched on December 25, 2022, and led to an increase in the price of the SOL token (a rise of 34% in 48 hours). Trading began on December 30, 2022, arousing genuine interest from the crypto community.
The main goal of the team is to bring back liquidity to Solana-based decentralized exchanges (DEXs). The idea of the developers was to create a full-fledged community coin that will be used across all the dApps built on Solana, and each user will have the opportunity to become part of the ecosystem, "where everyone gets a fair shot".
BONK was airdropped randomly to Solana NFT collectors, developers, and artists, other airdrop details remain unknown. Currently, the project has a small digital footprint on the Internet, except for an active twitter account.

BONKAs bonk has untapped 1h Bullish OB that is inside a unfilled 4h bullish fvg
I am long on areas visible in the chart
And for TP im targeting HTF bear OB in this case 4h
GOOD LUCK

BONK - see you on the moonClear EW structure says it's time to ride the lightning on $BONK.
Clear supportive structure, aiming for a 2-3x move, could be as high as 0.15
