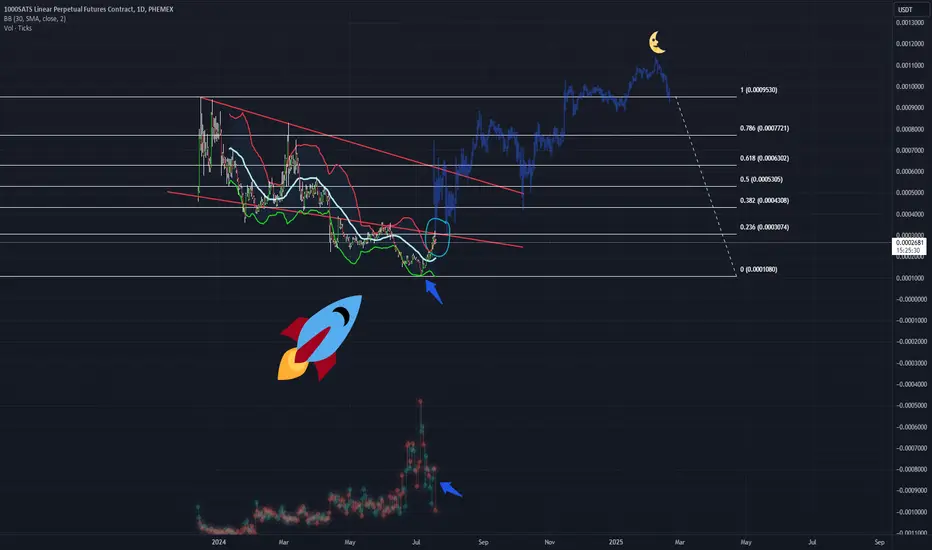
1000SATSUSDT.P1000SATSUSDT.P is in bearish trend.
Potentially printing LH and LL.
Bearish divergencd also form.
Trend is in strongly bearish .
We sell at CMP
1000SATSUSDT trade ideas

1000SATSUSDT Updated till 13-08-241000SATSUSDT Daily timeframe range. it got a big range space through its levels. barely reached 0.0003415 breaking it clean can lead it to 0.0004544 if money flows. there are not much of bag holders here.
local retrace point is at 0.0002171.

Sats and 1000Sats are in a head and shoulders patternSats and 1000Sats are in a head and shoulders pattern and their prices breaked the weekly trend

1000SATS Technical AnalysisParabolic SAR Positioned at $0.0001714, indicating a bullish trend reversal.
MACD The histogram is positive at $0.0000055, with the MACD line at -$0.0000102 and the signal line at -$0.0000157, suggesting a potential bullish momentum.
Stochastic (%K) At 81.74, indicating overbought conditions.
RSI At 51.33, which is in the neutral zone but trending upwards.
Key Levels and Trends:
The price of 1000SATS has found local support at $0.0001673 and has rebounded to the current level of $0.000225. The dynamic trend lines forming the descending channel act as significant support and resistance levels. Breaking above the dynamic resistance could signal a potential upward movement, but the overall trend within the descending channel remains bearish until a clear breakout is observed.
1000SATS has shown some recovery from its recent lows, but the market conditions remain uncertain. Traders should watch for a breakout above the dynamic resistance levels for potential bullish confirmation. Given the broader market's volatility, it's essential to stay updated with macroeconomic news and trends.

1000SATS approaching critical reversal levels1kSATS pretty much wiped out all of its profits last week in a heavy retracement from the recent high of 0.0003420 all the way down to 0.000153.
the good and the bad about this price level.
this seems like a very deep pullback in a strong uptrend, critical support has not broken yet, this is a good thing ~ bullish
we found support at .00015ish or the .000236 fib ~ short term neutral
We did however, put in a new lower high for the history of this coin ~ bearish
it currently is unclear to me if we will continue downwards towards more doom and gloom or if we retrace to new highs. but I will be entering long here, as the fib level has finally held support. and looking for a retrace up near local highs.
please trade carefully, or hold spot and cash mixed incase bigger buying opportunities arise like prices under 0.00011.
although this asset may not break .0009 tomorrow, I do believe within 4 years this asset could be, so I'd honestly be happy to load up below 0.00011

BINANCE : 1000SATSUSDT.P | Buying Oppurtunity15m : Almost took sell-side liquidity
"Market may grab more sell-side liquidity. Once done, if there is a bullish confirmation in the 15m and 1m charts, we can take a long position."

1000Sats to buy1000SATS have formed a cup and handle, we will try to take entry at 0.0003000.
Tp 1: 0.000320
Tp 2: 0.0003480
Sl : 0.0002800
Follow for more

1000SATs, is the dump finished???watched buyers get annihilated for the last couple of days, with the daily price action working towards a bearish engulfing setting a new lower low and a new lower high. personally, am waiting for a consolidation period at the 0.368 fib around .000256 or as low as the .000218 area. if those levels do not hold, and we go retest the critical support line I will be worried as that may signal an extremely bearish case scenario. but should the 0.368-0.05 fib levels hold, expect extreme movements to the upside

1000SATSUSDT.P1000SATSUSDT.P is in bearish trend.
Potentially printing LH and LL.
bearish divergence also form.
we wait and watch for the breakout of last LL.

1000sats testing the weekly centerline of the Bol bands. the weekly candle is starting out red, showing signs of being rejected from the weekly ma centerline of the Bollinger Bands. After hitting the recent highs, last week put in yet another, lower high. depending on how it behaves at the retrace, will signal further downside or continuation of this bull run.
I do not think it's over

bearish short term action in 1000SATSUSDTwe got that nice retest of the breakdown range of the previous high. I am still short term bearish until we get a bounce off of the 0.0002255 range

nice bounce. now for the dump??we put in a very nice bounce off of the 0.382 fib but did not continue to put in higher highs, that indicated to me that the bulls have their brakes on. and bears are out to play. We did in fact retest a key price level indicating another move down to the 0.5 fib levels. i will be keeping an eye out for a reversal or a bear market continuation at the 0.5 fib retrace level on that daily chart

1000sats ready for a new local high?it seems that the fib level circled was respected by the daily candles. could the correction be over?

Big correction? or Bear market???recently pulling back from 2 weeks of pumps and dumps, will we find support at the major Fibonacci retracement levels? Keep an eye out for reversals or at least bounces at key levels.
VOLITILITY IS EXTREMELY HIGH RIGHT NOW please wait for clear breaks of formations to protect your investments

bull line has broken, Bear Market???price action for 1000sats has broken a very important trend line that marked a new bullish push, and it was unable to break up and set a new all time high. and is currently showing heavily bearish price action. look for bounces at the fib levels, ema levels and keep an eye out for a total breakdown of BTC. we could go as low as 9k in btc, THIS DOES NOT MEAN BTC IS DEAD, healthy markets have healthy corrections, and it is 100% plausible that btc is in a massive bubble. i am shorting the bounces until clear reversal is in

bull line is broken for 1000SATS!!!expect lower trending price action for 1000sats, major volatility incoming

what I like vs Wat i dislike about 1000SATS current price actionmain thing is, the obvious triple top pattern we've put in over the last few days. but, so far, the bull line has been respected and we have not put in any major lower lows, hoping this is a consolidation phase for the next leg up. but will watch for a break down under the bull line to play the short side again

more upside for 1000SATS and BTC this weekend???????yesterdays daily close was a bullish engulfing candle. today needs to close with a small spinning top or a bullish continuation candle for more pumps. if not, expect lower highs to start showing up

pump today? for 1000sats and btc????reaching critical levels for a reversal confirmation for the next bull cycle.
if today closes over the bull line today, this weekend we will be seeing completely different numbers

1000SATS to the moon????what may be a reversal can be confirmed by a break, up over that resistance and a daily close. then, we may never see these prices again after july
critical moment for 1000SAT???was trading in a falling wedge pattern, we fell out of it and tested the lower band 3 times, if we break back in, it is extremely bullish, especially when backed by that much volume.

1000SATS Price: Breaking Down Key Support and Resistance LevelsIn the latest 4-hour chart analysis of BINANCE:1000SATSUSDT , the crypto demonstrates mixed signals, combining strong upward momentum with potential cautionary trends. Closing prices have shown a series of peaks and troughs, highlighting a pattern that traders should scrutinize closely.
Recent closing prices for the 1000SATS price reveal an upward trajectory with some consolidation phases. The most recent closes indicate a period of volatility with a slight bullish tilt. The price also managed to breach the critical resistance level of $0.0003043, suggesting potential bullish momentum. However, it has encountered significant resistance at $0.0003169 and $0.0003109, forming a consolidation zone that traders should monitor.
On the support side, 1000SATS has strong backing at $0.0003028 and $0.0003000. These levels are crucial for maintaining the current bullish sentiment. If the price falls below these support levels, it could signal a bearish reversal.
The 9 EMA has been trending above the 20 EMA, signaling a bullish crossover. This alignment suggests that the recent short-term price momentum is stronger than the long-term trend, indicating continued buying interest in the market.
Meanwhile, the MACD indicator is currently showing positive values, with the MACD line staying above the signal line. This positive divergence is further confirmed by the small but consistent histogram values, which support the bullish outlook. Despite the bullish signal, the histogram's diminishing size hints at a possible weakening momentum, which traders should watch carefully.
RSI values are also hovering around the overbought territory, with readings consistently above 70. This indicates that the 1000SATS price may be overextended, and a correction could be on the horizon. However, a sustained period in the overbought region can also signal strong bullish sentiment.
Given the current technical setup, traders could consider long trades around the support levels of $0.0003028 or $0.0003000, where the price has shown resilience. Exit points for long trades could target the resistance levels at $0.0003109 or $0.0003169. If the price breaks above $0.0003169, it could pave the way for further upside.
Conversely, short trades could be considered near the resistance levels of $0.0003109 or $0.0003169 if the price shows signs of rejection. Cover shorts near the support levels at $0.0003028 or $0.0003000, where buying interest might resume.
While the overall technical indicators suggest a bullish bias, traders should be cautious of potential corrections, especially given the overbought RSI readings. It's essential to keep an eye on the support levels to ensure the bullish trend remains intact.
Disclaimer: The information presented in this article is for informational and educational purposes only. The article does not constitute financial advice or advice of any kind. Ecoinimist is not responsible for any losses incurred as a result of the utilization of content, products, or services mentioned. Readers are advised to exercise caution before taking any action related to the company.

Short Setup for SATSShort Setup for SATS there was a condition where the pattern was bearish so I made a setup to go short
