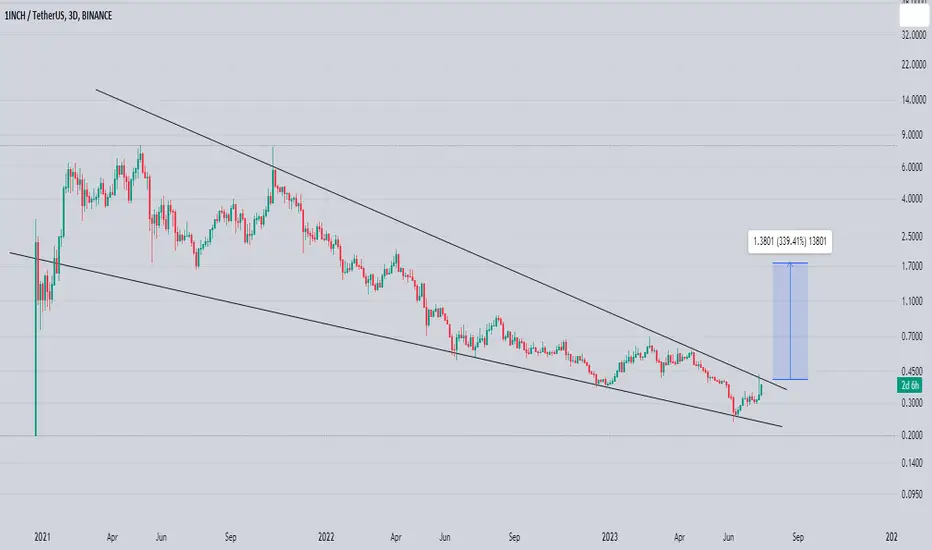
#1inch Volume + 2D Buy signal really high volume flowing into #1inch + UCTS 2D Buy signal confirmed on yesterday close
20%+ up already 😏 while yearly highs is still 50%+ away
1INCHUSDT trade ideas

Will 1INCH price try to surprise everyone, or the show over now?Another "promising" project woke up as to us promised in 2021 - "the dead man" 1inch project)
In the second half of 2021, 1inchUSDT was probably launched, probably planning to make money on the hype of the "odor" from Defi boom.
But it didn't work out, almost immediately after the listing, the price of the 1inch token fell steadily, roughly speaking from $8-9 to the recent $0.25
Accordingly, as you might have guessed, this coin has a lot of "happy" investors who bought the token of a "promising" project. Especially large purchases of 1inchUSD were in t he range of $0.50-0.90
Is it worth buying 1inchUSDT right now? In our opinion, definitely not.
The 1inch price now is in the area of a strong mirror level + it has just hit the trend line.
If you believe in the prospects of the 1inch project and want to buy this token, then we have the following advice for you:
wait for a correction to $0.40 and then try to buy a little bit there
or wait for the 1inchUSDT price to break through and consolidate above a strong mirror level. This will essentially allow you to buy 1inch at +/- near the current price, but in a much more confident place.
_____________________
Did you like our analysis? Leave a comment, like, and follow to get more

1Inch Buy SetupHere Is My Trade On 1inch
Welcome to my channel! Here you'll find daily technical analysis ofthe latest trends in the crypto market. From Bitcoin to altcoins, I'lIl be sharing my insights and predictions to help you make informed decisions
about your investments. Follow me for the latest updates and join the conversation in the comments!
Crypto technical analysis uses past price history to predict future price. It's not a guarantee and shouldn't be relied on solely for investment decisions. Consider other factors such as market trends, economic strength and
information dissemination. Use with caution.
This Is Not A Finacial Advise

1INCH /USDT bullish move incoming?👀 1INCH Today Analysis💎 1INCH is showcasing a promising trajectory, having broken out from the descending channel, setting the stage for bullish sentiments.
💎 It's maintaining a strong position above the EMA 50, and the RSI is also above the 50 band, reinforcing the bullish momentum.
💎 With a clear bullish price retest, we anticipate the price to grab liquidity and then make a bullish move.
💎 Above, we have a Bearish OB level that the price is expected to mitigate.
💎 However, if the price enters the invalidation zone, 1 INCH could experience a significant downward shift.
💎In the dynamic world of crypto, staying informed and adaptable is key. Stay tuned for more updates and enjoy your trading journey

1inch Testing Major Falling Wedge Resistance 1inch Testing Major Falling Wedge Resistance & Expecting Massive Breakout Incase Of Successful Breakout Expecting Move Towards 2$ In Midterm
1INCHUSDT 8HAscending Triangle formation on #1INCH chart. In case of successful retest, targets will be $0.3679 and $0.4090

Refueling for the flight?This currency has increased the possibility of its growth after the failure of a valid downward trend.
But you should not act too soon.
There is a big profit ahead, but it is still possible, so we should not rush.
In the picture of a hammer, it is clear that the price and the failure of that price are very important
Wait until the blue rectangle breaks
This is a great risk to reward
.
Share your thoughts with us

1INCH short1INCH bounced off the descending trendline. Asset broke trough the ascending trendline. Bearish movement to support level at 0.235 is possible.

1inch longcheck for the invalidation. Gartley pattern formed. Always set stoploss and strong confirmation set up

1INCH long1INCH bounced off the ascending trendline. Asset broke through the descending trendline. Bullish movement to resistance level at 0.406 is possible.


$1inch above vwap stoch bottomed
lets hop on
pullback are health ;)
stop 5% away so maybe wait a bit lower ..scaled in

1INCHUSDT.P BEARISH SCALPING (4HRS) 👀👀Enter the trade after a bear candle bar closes below the line (enter trade), set your stop loss on the line (SL) and take profit using the line (TP) or you can adjust your Take Profit later on to take more profit. Thank you.
Note:
1. Do not enter trade if the Candlestick crosses the line, enter only if it closes a BEARISH below the previous candlestick, and the next Candlestick is a Bear bar.
2. Remember your risk management or risk ratio, to avoid blowing your account.
3. Wishing you a safe trade.

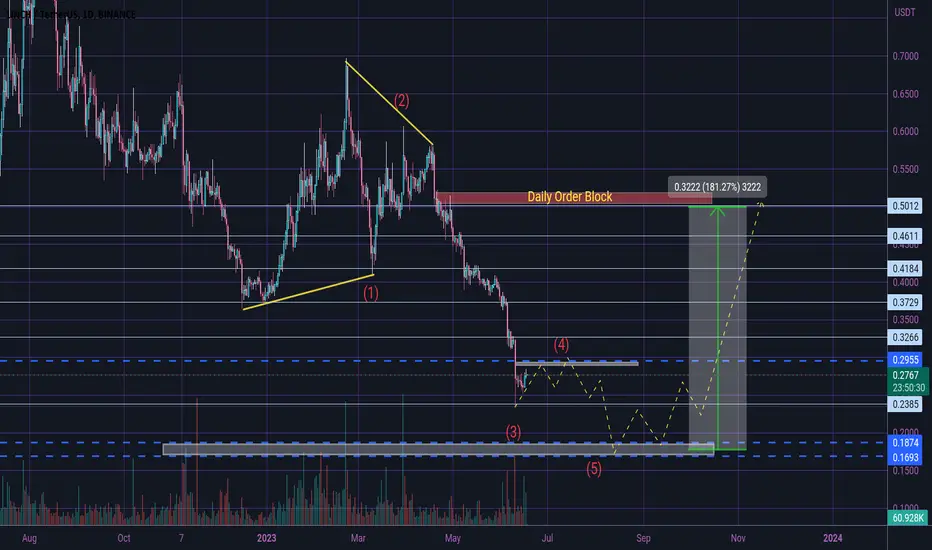
1Inch Possible Daily Movement 🤔♻️🤔♻️Hi dear traders
In daily time frame , according to the Elliott waves, we expect the price to hunt the indicated floor and then move towards the upper targets
Let's see what happens
This is not financial advice ( DYOR )
Good luck
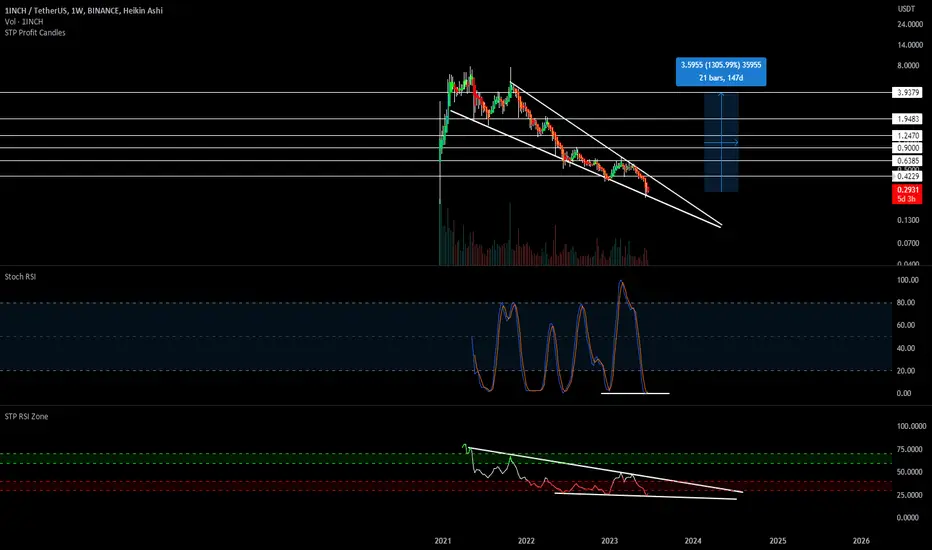
📉 Falling Wedge Alert on $1INCH! Reversal Potential!Hey traders! Today, I want to discuss an intriguing chart pattern I've identified on $1INCH. Let's explore the falling wedge pattern and its implications, particularly in relation to the parabolic trend. 📊💡
Pattern: Falling Wedge 📉🔽
Symbol: CRYPTOCAP:1INCH 💰
Overview:
A falling wedge is a bullish chart pattern characterized by converging trendlines, with the upper trendline sloping downward and the lower trendline sloping upward. The presence of the parabolic trend further adds to the potential reversal scenario. Let's delve into the falling wedge pattern on CRYPTOCAP:1INCH in more detail. ⚡💹
Key Features of the Falling Wedge on CRYPTOCAP:1INCH :
Converging Trendlines: The upper trendline connects lower highs, while the lower trendline connects higher lows, indicating a potential shift in market sentiment. 📈📉
Parabolic Trend Support: Notice that CRYPTOCAP:1INCH is currently holding the parabolic trend, which reinforces the bullish outlook and strengthens the potential reversal signal. 🚀📈
Breakout Expectations:
Falling wedge patterns often precede bullish breakouts. To confirm the pattern, traders typically look for a decisive move above the upper trendline. It is essential to wait for a confirmed breakout before considering any trades. 🚀📈
Trading Strategy:
Entry Point: Consider entering a long position once CRYPTOCAP:1INCH successfully breaks above the upper trendline of the falling wedge pattern, supported by the parabolic trend. This breakout could indicate a potential reversal and continuation of the upward trend. ⬆️💰
Stop-Loss: To manage risk, set a stop-loss order below the lower trendline, protecting against potential downside. ⛔️📉
Target Levels: Identify key resistance levels or previous swing highs as profit targets. Adjust your position size and take profits accordingly. 🎯📈
Risk Management:
Implement proper risk management techniques, such as position sizing, setting stop-loss orders, and adhering to your trading plan. Always be aware of the inherent risks associated with trading cryptocurrencies like $1INCH. ⚠️💼💡
Disclaimer: Trading cryptocurrencies carries risks, and it is crucial to conduct thorough analysis and seek professional advice before making any investment decisions.
#FallingWedge #1INCH #Cryptocurrency #ParabolicTrend #BullishReversal #TradingStrategy #TechnicalAnalysis #ProfitTargets #RiskManagement
In conclusion, the falling wedge pattern identified on CRYPTOCAP:1INCH , combined with the parabolic trend, suggests a potential bullish reversal. Exercise caution and wait for a confirmed breakout before making any trading decisions. Stay tuned for further updates on $1INCH! 🚀💹
(Note: This post is for informational purposes only and should not be considered as financial advice.) 💡💼📚
1INCHUSD ❕ tests the supportThe asset is oversold.
The chart has broken up 50EMA on the 4H Timeframe.
50EMA broke through 200EMA on the 1H Timeframe.
I believe the token can rise if it holds support.

1INCH S&R>>>>>>>>>I Have Tried My Best to Bring the best Possible outcome in this Chart.
It's not a buying signal's just for review of chart pattern's.
SPOT TRADE and hold for mid term(1 step buy).
Not a financial advise.
PLZ DYOR
With hopping success>>>>>>

1INCHUSDT.1DHello dear friends,
*Mars Signals Team wishes you high profits*
This is a one day time frame analysis for 1INCHUSDT.1D
We are in daily time frame. As you can see, the price has reached our support zone, where we expect to have the potential to move towards the first line of resistance. But as long as the price fluctuates above our support line, we do not expect a bearish scenario. But if the price penetrates below our support line and stabilizes, we expect further decline.
Warning: This is just a suggestion and we do not guarantee profits. We advise you to analyze the chart before opening any positions.
Take care

1INCH BASE LEVELJudging by the chart it should not go much lower than $0.20
But I think it will be a long sideways movement. Let it get a retest first.
I also see it as an investment buy.

1inch trade timeHi
Im gonna buy at this point seems to start long waves.
It would be correction waves at first but if BTC help us by rising up we can go for full target.
this position will be open for 3 ~ 5 day
Bye

1INCHUSDT.1DHello dear friends,
*Mars Signals Team wishes you high profits*
This is a daily time frame analysis for 1INCH USDT.1D
We are in daily time frame. As you can see, the price is fluctuating near our first support line and we expect it to be able to support the price as before and move towards its resistance line. But if the price cannot be supported and stabilized below our support line, we expect further decline.
Warning: This is just a suggestion and we do not guarantee profits. We advise you to analyze the chart before opening any positions.
Take care

1INCH/USDT LONG SETUP WITH 1:4 RISK RATIO1INCH from my outlook, will retest on QML area, before going up again
Very beautiful setup from 1inch , hope going well
Still count your risk, manage 2% risk lose from your wallet that MAXIMAL
See youagain

#1INCH buy set up spotHuge double bottom on weekly chart , looks like a greet risk reward (R:R) trade
Risking 9% SL to Win >>>> 65 % TP ^_^
It's Bounce now Or Die Hard >>>> No Pain No Gain
