1Inch/USDT Bearish Chart Analysis #1Inch/USDT Technical Analysis Update
Current Price: $0.378
The #1Inch/USDT pair has recently broken below the strong support level at $0.44, indicating a bearish trend. With the price currently below $0.44, we can anticipate further downside potential of around 20-30% from the current levels.
Key Levels to Watch:
Strong Support: $0.27
Resistance: $0.44/$0.53
It is crucial to monitor the $0.44 resistance level closely. If the price remains below this level, we can expect a further decline towards the $0.270 support level.
Stay tuned for more updates!
1INCHUSDT trade ideas

Elliott waves on 1inchElliott impulse waves with a touch of support and resistance
BTW I’m amateur with Elliott waves, did I draw them correctly?

Crypto 1inch LONG TF H1 . TP=0.3976On the hourly chart, the trend started on May 24 (linear regression channel).
There is a high probability of profit. Possible take profit level is 0.3976
But do not forget about SL = 0.3830
Good luck!
Regards, WeBelieveInTrading

1INCH Possible Daily Movement 😎♻️😎♻️Hi dear traders
In daily time frame we can see bullish divergence between price and RSI.
Price near support line of channel.
We can open long position with suitable R/R .
All targets specified.
Let's see what happens
This is not financial advice ( DYOR )
Good luck

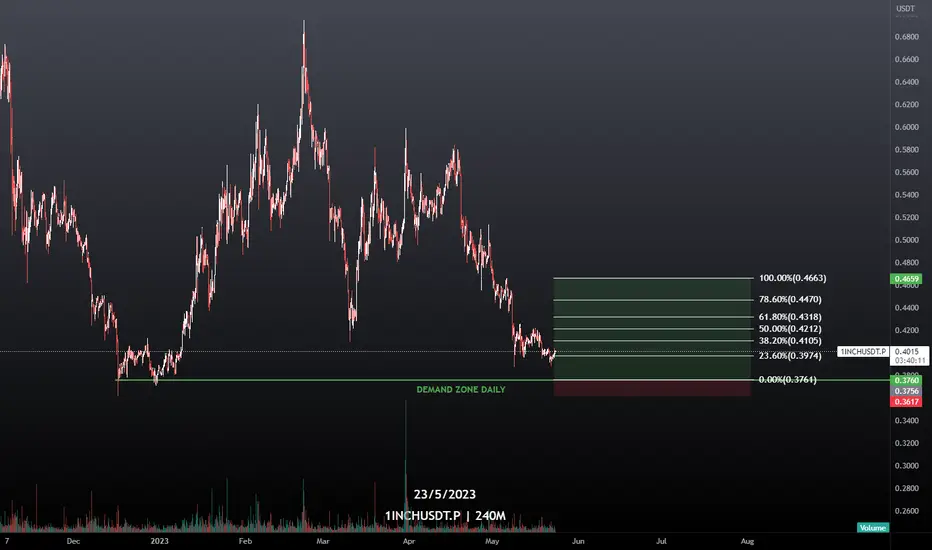
1INCH USDT PERP Hello Trader 👋, today we are looking to
direction : long
entry 0.3761
stoploss 0.3617
leverage : cross 25X
take profits
0.3974
0.4105
0.4212
0.4318
0.4470
0.4663
Please add a comment and Positive feedback and
constructive criticism are important to authors and the
community.
Disclamer: Not Financial Advice


1INCH/USDTDex aggregator
descending channel which is a bullish reversal pattern, team keeps building. big pump soon

1INCHUSDT lost the dynamic support1INCHUSDT lost its dynamic support, which could be a bearish signal for traders.
The dynamic support refers to a moving average or trendline that acts as a support level for the price. When the price falls below this support level, it may indicate a shift in market sentiment, from bullish to bearish. In this case, the price of 1INCHUSDT could retest the 0.382 Fibonacci level, which is a commonly used retracement level in technical analysis.
If the price fails to hold at the 0.382 Fibonacci level, it could create a new bearish impulse, which may push the price further down towards the 0.44 $ area. According to Plancton's Rules, which is a trading strategy based on Fibonacci retracement levels, this could be a good opportunity for short selling.
–––––
Follow the Shrimp 🦐
Keep in mind.
🟣 Purple structure -> Monthly structure.
🔴 Red structure -> Weekly structure.
🔵 Blue structure -> Daily structure.
🟡 Yellow structure -> 4h structure.
⚫️ Black structure -> <= 1h structure.
Follow the Shrimp 🦐

1INCH USDT PERP Hello Trader 👋, BINANCE:1INCHUSDT
description : the reflection of the retail area has been confirmed
can be taken at the limit area or market price
in the demand area for 1 day
Please add a comment and Positive feedback and
constructive criticism are important to authors and the
community.
Disclamer: Not Financial Advice

short 1inchCRYPTOCAP:1INCH broke through the support level. Decline to $0.415 is expected to happen next.

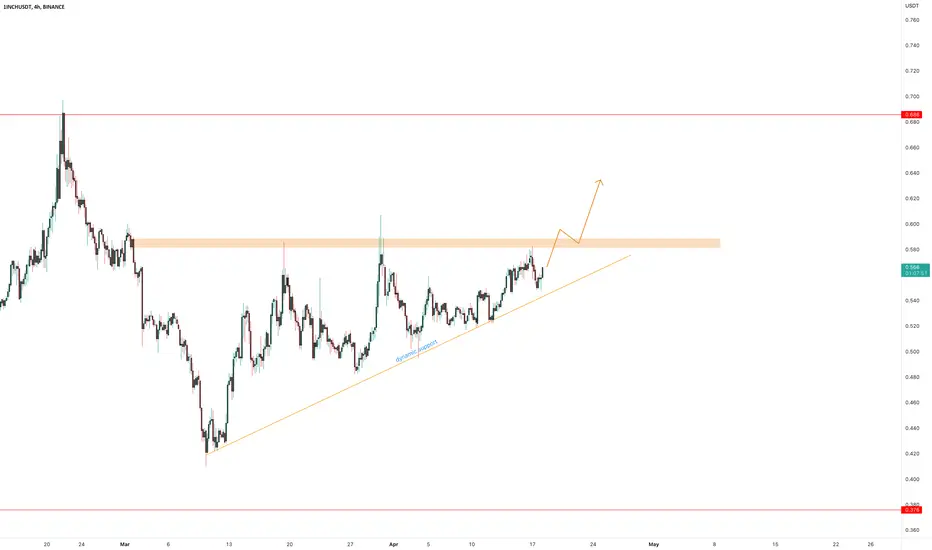
1INCH USDT PERP Hello Trader 👋, today we are looking to BINANCE:1INCHUSDT.P
description : I'll take this area of demand
on the 4 hour time frame due to swing
for the long term. I think this area
it is safest to take long positions
Please add a comment and Positive feedback and
constructive criticism are important to authors and the
community.
Disclamer: Not Financial Advice

SHORT $1INCH SHORT CRYPTOCAP:1INCH (H1)
You can see the price between moving EMA21 & support line.
Although the price is not down like I expect, it is a good set up as Bob Volman method

Bearish 2618 Short Setup with an Ancillary Long SetupOKX:1INCHUSDT.P
Bearish 2618 is the main setup as you can see on the graph.
The level is also a support & resistance transformation zone.
Current price accumulation indicates that if the blue line breaks with solid momentum, it will be easy to reach the level which we prepare to short.
So, an experienced trader (who can stop the position if needed) may open a long position through the level at which we intend to open a short position.
May the force be with you...

1INCHIf he wants to make a sharp move towards high resistances, I will wait in one of the green lines. Of course, the resistance ahead is important to me.

1INCHUSDT is testing the key level1INCHUSDT is currently testing the 4-hour resistance level at the $0.58 mark, which indicates that there is significant selling pressure at this level.
According to Plancton's Rules of Trading, if the price manages to break out above the 4-hour resistance level, it may be a signal to establish new long positions. However, it is important to note that the price has bounced several times on the dynamic support, indicating that there is also significant buying pressure at lower levels. This suggests that the market is currently in a state of equilibrium, and a breakout in either direction could result in a significant move.
–––––
Follow the Shrimp 🦐
Keep in mind.
🟣 Purple structure -> Monthly structure.
🔴 Red structure -> Weekly structure.
🔵 Blue structure -> Daily structure.
🟡 Yellow structure -> 4h structure.
⚫️ Black structure -> <= 1h structure.
Follow the Shrimp 🦐
1INCH looking tasty right now!rising wedge, some bullish momentum and it can break above and give a handsome %. trade safe peep

1INCH: 0.5370 Zone Is Holding Strong1INCH: 0.5370 Zone Is Holding Strong
During all these days 1INCH faced very strong support near 0.5370
and it looks like very soon it may rise again.
I am not expecting any strong bullish movement however the price
is showing that it can rise even more.
This is a trade that 1Inch can spend time to complete as I see
but it looks bullish on the daily time frame.
Thank you and Good Luck!

More Side Way to GO UP!in weekly timeframe $0.75 will be the current target of upside move. and i think need more sideway to achive great accumulation for massive targets.
in daily timeframe $0.62 will be the first target and after that need to back down for liquidity. and after that we will see main weekly upside move.

1INCH/USDT - 1inch: Resistance_Breakout_Confirmation◳◱ A Resistance Breakout and Confirmation has been detected on the CRYPTOCAP:1INCH / CRYPTOCAP:USDT chart. The price has broken above a key resistance level and has been confirmed by a strong candle, indicating a potential bullish trend. The next resistance key levels are located at 0.563 | 0.593 | 0.657, and the major support zones can be found at 0.499 | 0.465 | 0.401. Consider entering a trade at the current price zone of 0.565 and targeting higher levels.
◰◲ General info :
▣ Name: 1inch
▣ Rank: 97
▣ Exchanges: Binance, Kucoin, Bybit, Huobipro, Gateio, Mexc
▣ Category/Sector: Financial - Decentralized Exchanges
▣ Overview: The 1inch Network unites three separate decentralized protocols, aggregating liquidity from a variety of decentralized exchanges to facilitate cost-efficient transactions.
Its native token, the 1inch token (1INCH) serves two primary purposes: As a governance token granting voting rights towards the 1inch DAO and as a utility token, where it is used as a connector to achieve high-efficiency routing in the 1inch Liquidity Protocol. It will also be used in the tokenomics of all future protocols developed by the 1inch Network.
◰◲ Technical Metrics :
▣ Mrkt Price: 0.565 ₮
▣ 24HVol: 2,790,670.602 ₮
▣ 24H Chng: 4.63%
▣ 7-Days Chng: 6.72%
▣ 1-Month Chng: 14.98%
▣ 3-Months Chng: 17.08%
◲◰ Pivot Points - Levels :
◥ Resistance: 0.563 | 0.593 | 0.657
◢ Support: 0.499 | 0.465 | 0.401
◱◳ Indicators recommendation :
▣ Oscillators: BUY
▣ Moving Averages: STRONG_BUY
◰◲ Technical Indicators Summary : STRONG_BUY
◲◰ Sharpe Ratios :
▣ Last 30D: 1.46
▣ Last 90D: 1.17
▣ Last 1-Y: -0.82
▣ Last 3-Y: 0.55
◲◰ Volatility :
▣ Last 30D: 0.73
▣ Last 90D: 0.78
▣ Last 1-Y: 0.85
▣ Last 3-Y: 1.73
◳◰ Market Sentiment Index :
▣ News sentiment score is N/A
▣ Twitter sentiment score is 0.53 - Bullish
▣ Reddit sentiment score is 0.84 - V. Bullish
▣ In-depth 1INCHUSDT technical analysis on Tradingview TA page
▣ What do you think of this analysis? Share your insights and let's discuss in the comments below. Your like, follow and support would be greatly appreciated!
◲ Disclaimer
Please note that the information and publications provided are for informational purposes only and should not be construed as financial, investment, trading, or any other type of advice or recommendation. We encourage you to conduct your own research and consult with a qualified professional before making any financial decisions. The use of the information provided is solely at your own risk.
▣ Welcome to the home of charting big: TradingView
Benefit from a ton of financial analysis features, instruments and data. Have a look around, and if you do choose to go with an upgraded plan, you'll get up to $30.
Discover it here - affiliate link -
