1INCH/USDTfalling wedge pattern, the purple line is just an idea of a potential inverse head and shoulders playing out!
I would like to add half the TVL has left all dex exchanges in general, towards end of last year there was $110B TVL now there is around $55B TVL
1inch actually has a market share and is an aggregator, which gives best price for that swap.
Lots of catalysts coming up for $1INCH
1inch pro
Aave listing
Utility such as revenue sharing for 1inch holders
New protocol feature to be released, team is waiting for audits to be completed
Forum/governance discussions in regards to utility
1INCHUSDT trade ideas

1INCHIUSDT TREND LINE ANALYSISHi, everyone here.
We are a team that specializes in chart analysis.
We'll be your guide
I hope it helps you a lot
Thank you.
We look forward to a rebound.
We can face resistance in the green trend, but we expect to rise in the end
But if you don't break through the green trend, you can build a double bottom and raise it

1INCHUSDT H1SELL ENTRY @0.988
STOP LOSS@1.109
TAKE PROFIT@0.907
Market Update (Looking to Long) Like and Subscribe
Thank you Please support our analysis with a like or comment!

1INCH bullish divergence 1day+4hourNice to seen the combination of bullish divergence on the 1 day and the 4hr for 1INCH/UDST.
(With bitcoin itself putting in a 4hour divergence, could help it)
Decent price target might be around the top of this falling broadening wedge, will elaborate further below...

$1INCH BUY#1INCHUSDT 4HR TIMEFRAME PLAN
$1INCH on the 4HR timeframe is testing resistance trendline. Expecting bullish wave to $2 region Incase of breakout.
RSI testing mid channel ✅
Important news (The 1inch Network is thrilled to share that its Aggregation Protocol and the Limit Order Protocol have successfully been deployed on Fantom)


Short 1INCHBTC seems to go down more (to $31000 maybe) today. Although 1INCH has been quite strong these days, I think that it would break the downside of the triangle to drop more than 10% the next hours.
RSI already break its trendline. Entry when 1H candle close below $1.278.

Long shot buy #1nchSeems to be holding firm when everything else is crashing all around. Buy volume seems decent as well. See chart for buy, stop and target.

1inchusdt - pump right now the price was clamped in a narrow range, soon there should be a reversal and a strong pump, I am gaining a large position. the coin did not react in any way to the bitcoin dump, a very strong tool at the moment

1INCH/USDTBullish breakout :
Entry price 1.338
Take Profit 1.401
Stop Loss 1.305
Bearish breakout :
Entry price 1.270
Take Profit 1.202
Stop Loss 1.305

1INCH Buy Setup1inch is now testing 2 year support line, I expect a bounce from here if BTC doesn't absolutely eat sh*t.
Indicators are showing signs of reversal, also on the daily chart it looks like a cup and handle formation is starting to form.
Entries: 1.255 (35 % of the given position)
0.786 (the remaining 65%).
Tp1: 3.352
Tp2: 6.252
p.s. don't follow this idea, I'm autistic monkey


1INCH / USDT✅We are providing an analysis with the specific period of time. Pay attention to the expiration date.
📌Stay faithful to the Stop-Limit at all times.
👍(If you find this post useful, give it a thumbs up, share your thoughts in the comments, and feel free to spread the word)

1Inch 3 day chart looks very very ready for a Bullish move!1INCH 3 day chart:
i revisited this chart from months ago, I
have to say, this DEX is ready to move up
in my opinion. Price Target lines listed.
watch for the golden pocket retracement
on the way up.

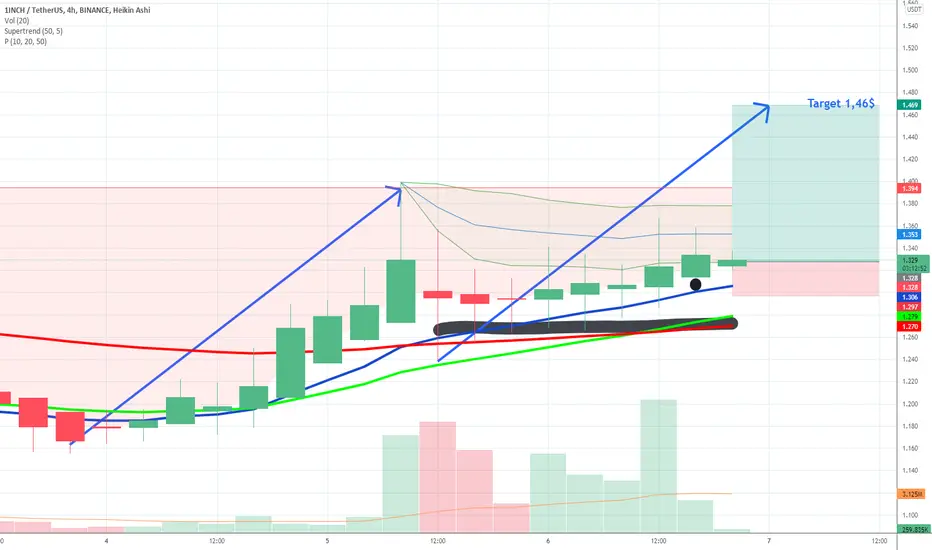
$1INCH Setup - Target 1,46$$1INCH reclaim of lower vwap band after nice consolidation - Target 1,46$
1INCH long$1INCH broke through the descending trendline. Bullish movement to resistance level at 1,68$ is likely to happen.

$1INCH ready for the breakout?1INCH has been flirting with the $1.3 resistance level lately, which is an ultra strong level, which we can also identify judging from the huuuuge volume that has formed at that price
I'm really looking forward to its breakout to enter, if that happens
if this scenario is confirmed we can enter a long position targeting the previous resistance (and 0.382 fibonacci level) which would be at about $1.43
also I want to mention the fact that 1INCH has good fundamentals and that I'm trying to only post technical analysis of coins/tokens which have fundamentals good enough to be even invested in
what do you think about this idea? let me know in the comments! also please drop a like and follow me if you found this helpful in any way!

1INCH/USDT 1Day Timeframe Trade idea:
- Watch for bounce “double bottom “ or break of trendline enter with stoploss below trendline.
- Take profit targets: $1.7,$2.5 hodl the rest.
Trade safe!

1INCHUSDT wants to retest the Monthly support? The price got rejections from the daily resistance on 1.5$ and now is testing the 4h support on 1.41 support after the first bounce.
As you can see on the upper chart the price has nice support on 1.41$
How to approach?
The market is creating a descending channel on the 4h timeframe. IF the price is going to lose the support, we could see a new bearish impulse until the demand zone on the monthly support. According to Plancton's strategy , we can set a nice order
–––––
Keep in mind.
🟣 Purple structure -> Monthly structure.
🔴 Red structure -> Weekly structure.
🔵 Blue structure -> Daily structure.
🟡 Yellow structure -> 4h structure.
–––––
Follow the Shrimp 🦐

1INCH long - 4hr bullish divergenceTheres a hullish divergence on the 4hour chart for 1INCH. It is also sitting on historical price support. It is due for a bounce. A clean target here is there price action resistance sitting above.
Could also watch the RSI, would stop out the trade if the RSI was to breakdown through the trendline.
Good luck.
(similar setup for GALA)

1INCH Is Probably gonna Be Bearish.1INCH is In a Broadening Wedge Pattern. The Price Haven't Done any Break out yet So This Means the Price WILL Range In This Pattern (For now). SO the Price is now Near the Middle of the Pattern But It has a Long Way Reaching The Bottom of the Pattern.It has touched the Support level (1.26$) Recently and did a Bullish Reaction to It. But It is Pretty weak to Rely on. Our Best Bet is the Bearish Movement. It can Reach 1$.
_ _ _ _ _ _ _ _ _ _ _ _ _ _ _ _ _ _ _ _ _ _ _ _ _ _ _ _ _ _ _ _ _
Thank you for seeing idea .
Have a nice day and Good luck

1INCHUSDTHello Crypto Lovers,
Mars Signals team wishes you high profits.
This is a 4-hour-time frame analysis for 1INCHUSDT
The price is reaching our favorite support trend. We believe the price would be supported in this area and move to the first resistance line. It may not be supported and will face more fall. Don't forget the stop-loss point.
Warning: This is just a suggestion and we do not guarantee profits. We advise you to analyze the chart before opening any positions.
Wish you luck

1INCH may crashHello, trading view community. Should you like this analysis please support with likes and comment your idea below the analysis. Thanks.
Never risk more than you can afford to lose.
Always DYOR.
1INCH has crashed more than %80 since its previous ATH.
It formed a head and shouldees patterns as marked on the chart.
Now it may crash into its weekly support zone ($1.15 - $1.24)
This scenario will be confirmed on condition that it drops to $1.39, then crash will began.
This is a personal idea and I am not a financial adviser.
