1INCH ideas
General sentiment of the market is turning positive. I took a short on this on that level and closed in with profits. Another short is tempting however I pass this time.
If the level is broken, I would expect to go to VAL and TP on the halfway up.
1INCHUSDT trade ideas


1Inch Long Trade idea1Inch/USDT is forming my favourite setup. Deman zone with FVG and having SSL. Perfect setup

1INCH USDT formed a triangleThe price is consolidating within a symmetrical triangle, a common continuation pattern. The triangle is formed by two converging trendlines—one descending from the highs and one ascending from the lows
if the price broke the trendline it might give us a good move
guys this is not a financial advice you make your own choice


1INCH Reversal
I am following a reversal pattern for 1INCH.
It's too soon to determine if it's a new impulsive wave (1-5) or a correction (A-C), but I'm short-term bullish for a test of 0.3200 resistance.

1INCHUSDT is BullishA matured bullish divergence has appeared on daily time frame, indicating the control of bulls. If the momentum sustains then we can expect a bullish rally from this support region as per Dow theory. Targets are mentioned on the chart.

1INCHUSDT1INCH ~ 1W
#1INCH reached its current lowest price. if you have Conviction on this AltCoin,. This price is very attractive to start buying.

1INCHUSDT(1InchNetwork) Updated till 04-09-241INCHUSDT(1InchNetwork) Daily timeframe range. PA is in very important level not far below is price discovery level. a close above 0.3046 can give it some relief. but that depends on retail interest. recent support at 0.2243.

1inch superb1inch was on 7-star radar. we had good buy and fbuy prints. Now with sell print we are going down. Stop loss will be the higher of the sell print candle.
Targets are
0.2579
0.2514
DYOR and Enjoy

1INCH Technical Analysis in a Weekly TimeframeHello everyone, I’m Cryptorphic.
I’ve been sharing insightful charts and analysis for the past seven years.
Follow me for:
~ Unbiased analyses on trending altcoins.
~ Identifying altcoins with 10x-50x potential.
~ Futures trade setups.
~ Daily updates on Bitcoin and Ethereum.
~ High time frame (HTF) market bottom and top calls.
~ Short-term market movements.
~ Charts supported by critical fundamentals.
Now, let’s dive into this chart analysis:
1INCH has reached the lower support trendline, ranging between $0.20 and $0.27. This support range is crucial for 1INCH to hold.
The Stochastic RSI is in the oversold zone, indicating that bullish momentum may develop soon.
To reach its all-time high, 1INCH would need a 30x gain from the current price. For now, 1INCH needs to rebound and rally toward the primary resistance at $0.644.
Key levels:
- Crucial Support/Entry: $0.20 to $0.27.
- Primary Resistance/Target: $0.644.
- Stochastic RSI: Oversold.
DYOR, NFA.
Please hit the like button to support my content and share your thoughts in the comment section. Feel free to request any chart analysis you’d like to see!
Thank you!
#PEACE

1INCH — Last Firewall Before All-Time Low1INCH has been one of the most disappointing coins for the last few years. The token reached an incredible high of almost 8 USD back in 2021 before crashing completely. Currently, 1INCH trades at 26 cents ‼️
Moreover, the token printed one bearish pattern after the other. Just recently, it broke below the neckline of a head and shoulders pattern. As a result, the token dropped another 25% to its current level.
The level between 23 and 25 cents represents the last firewall before 1INCH would be sent to its all-time low. The coin was here previously. Already at the end of 2023, 1INCH consolidated in this area before recovering to a level of 70 cents.
Therefore, I would watch this level closely. If it holds and we enter a bullish market phase, 1INCH could reverse from here and pump. Since the token has proven that it can still move towards 1 USD quickly, the current level represents an interesting accumulation zone.
On the other hand, a break below the last firewall should send 1INCH to a new all-time low and probably much lower.

1INCHUSDT watch for the trendline. Long-term. Potential +130%1INCHUSDT watch for the trendline. Long-term. Potential +130%

1inch Price Analysis - 6$ magnet 1inch price analysis. Middle term target for 1inch and why 6$ is a first magnet BINANCE:1INCHUSDT
Possible Targets and explanation idea
➡️Fib relevant. Basically jut a yearly range. We have an all chances just sweep listing LOW
➡️Now we are in accumulation 0.27 level by fib zone
➡️First local rejection we will see over 0 level with retest previous zone
➡️0.23 level is Full fill of Monthly FVG
➡️in 90% cases we will come back to close 50% of wicks Marked with Curve
➡️Hard to say about timing but I think till April/May 2024 we can see at least 3-4$
Hope you enjoyed the content I created, You can support with your likes and comments this idea so more people can watch!
✅Disclaimer: Please be aware of the risks involved in trading. This idea was made for educational purposes only not for financial Investment Purposes.
---
• Look at my ideas about interesting altcoins in the related section down below ↓
• For more ideas please hit "Like" and "Follow"!

Whales accumulate 1inch and here is whyMy custom indicators set data for 1inch on Weekly timeframe. Here is why whales accumulate now
BINANCE:1INCHUSDT
Possible Targets and explanation idea
➡️Take profit indicator we trade under fundamental value (good time to buy)
➡️Sooner or later we will see test Take profit line. All lines are dynamic
➡️Market mood indicator. Higher timeframe stronger signal. Disbelief zone now
➡️Direction we see new dots, whales accumulate position
➡️ADZ we are in accumulation zone - good time for DCA or buying on a spot
➡️Trade ON we got 2 signals in a row recommendation close SHORT on W timeframe
Hope you enjoyed the content I created, You can support with your likes and comments this idea so more people can watch!
✅Disclaimer: Please be aware of the risks involved in trading. This idea was made for educational purposes only not for financial Investment Purposes.
---
• Look at my ideas about interesting altcoins in the related section down below ↓
• For more ideas please hit "Like" and "Follow"!

1inch targets for this year
Possible Targets and explanation idea
➡️Fib relevant. We are now in -0.27 zone (accumulation stage) on Weekly timeframe
➡️0.13$ is a last target what we can reach if market collapse at -0.27 level
➡️Trade now under fundamental price (real value of coin) last green line
➡️Take profit now at 2.36$ around 0.23 level by fib and main Weekly IMB.
➡️Between 2.36 and 3.20 will be massive rejection if we will see altseason.
➡️On Crypto4light Market Mood you can see white zones. Its always great time for accumulation if you use DCA strategy for long term
Hope you enjoyed the content I created, You can support with your likes and comments this idea so more people can watch!
✅Disclaimer: Please be aware of the risks involved in trading. This idea was made for educational purposes only not for financial Investment Purposes.
---
• Look at my ideas about interesting altcoins in the related section down below ↓
• For more ideas please hit "Like" and "Follow"!

1Inch targets for May 2023BINANCE:1INCHUSDT
✅Before we start to discuss, I would be glad if you share your opinion on this post's comment section and hit the like button if you enjoyed it.
Thank you.
Possible Targets and explanation idea
➡️Middle term fib. Trade in -0.27 zone
➡️Reject at downtrend line
➡️Reject at volume sellers level
➡️Would be good to see retest 0.45$ and one more retest around March
➡️0.23lvl fib we got Monthly FVG Will be first massive resistance
➡️ Same level will be psychological price target 1$
Hope you enjoyed the content I created, You can support with your likes and comments this idea so more people can watch!
✅Disclaimer: Please be aware of the risks involved in trading. This idea was made for educational purposes only not for financial Investment Purposes.
---
• Look at my ideas about interesting altcoins in the related section down below ↓
• For more ideas please hit "Like" and "Follow"!

1INCH sell/short setupThe large structure is 1 INCH bear. We have a supply range on the chart in which we are looking for sell/short positions.
Because the sell/short position is in the same direction as the main trend.
The target can be the range of demand.
Closing a daily candle above the invalidation level will violate the analysis.
Note that the financial market is risky, so:
Do not enter a position without setting a stop and capital management and confirmation and trigger.
When we reach the first TP, save some profit and try to move the stop continuously in the direction of your profit.
If you have any comments please post them, comments will help us improve our performance
Thanks

1INCH looks still bearishIt looks like 1INCH is completing an ABC where the B wave is a triangle. After pullback to the red range, it can drop more.
The targets are marked on the chart.
Closing a daily candle above the invalidation level will violate the analysis.
For risk management, please don't forget stop loss and capital management
Comment if you have any questions
Thank You

1INCH 🦄 Ichimoku Weekly Breakout! | Profits PlanHey guys!
Analyzing past movements, we can see price used to move inside a downwards channel until it broke out from it. But not only that, it broke out and pierced through the Ichimoku Cloud in the weekly timeframe which is huge!
So here's some plan:
1) Condition: -price must breakout from 0.58 towards the upside. After that, it should re-test the zone to give a chance to get into a trade. (DONE)
2) We can set targets 0.90 - 1 dollar mark
3) If price closes above 1.10 we can expect a move towards the following target zone: 1.60 - 1.90
4) For the bears scenario (we must include it even if we feel might not happen at all) Price could fall back into the range and give an awesome opportunity to buy lower even. And a realistic price would be around 0.27 but BEST optimal would be at around 0.20
Let's see how it plays out!
Kina Tip of the Day : My ideas and trades are all for SPOT modality. I don't recommend futures trading unless you really know what you're doing and you're up to get glued into the charts. If you want to live your life and still make money then relax, sit back, analyze and create your own strategy that could be based from another teacher but you must feel connected to it otherwise it won't work in the long run, no matter what you do. So, never give up and keep fighting for independence.
Keep it Shiny! ✨
Kina, The Girly Trader

Despite Bullish Trade Signal — Why 1INCH Might Go Lower!Just a couple of minutes ago, 1INCH flashed a bullish Bollinger Bands signal on the 4H chart. However, despite the signal's solid reliability when it comes to smaller gains, 1INCH looks poised for a stronger downtrend.
Here's why 👇
1 — 1INCH chart looks extremely bearish with two tops at 0.43 that were rejected both. Especially the M-shape is a formation you don't want to see and indicates a bearish momentum.
2 — 1INCH fell below the important support at 0.4. Also, it recovered gradually, but the token hasn't been able to climb back above the crucial level.
What's next?
A daily close below the 0.4 level will strengthen the bearish momentum. Without support from the broader market, it is more than likely that 1INCH will revisit support at 0.38 next.

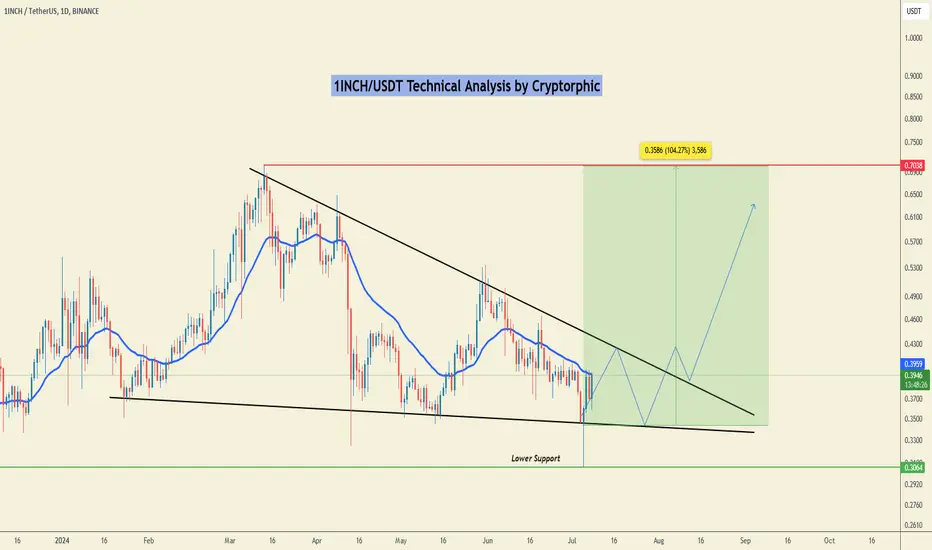
1INCH Technical Analysis in Daily TimeframeHello everyone, I’m Cryptorphic.
For the past seven years, I’ve been sharing insightful charts and analysis.
Follow me for:
~ Unbiased analyses on trending altcoins.
~ Identifying altcoins with 10x-50x potential.
~ Futures trade setups.
~ Daily updates on Bitcoin and Ethereum.
~ High time frame (HTF) market bottom and top calls.
~ Short-term market movements.
~ Charts supported by critical fundamentals.
Now, let’s dive into this chart analysis:
1INCH has been in a bearish trend and recently hit a local low of $0.3064, managing to bounce back and close under the triangle support.
The price is currently testing the 25 EMA resistance and is likely to test the resistance trendline soon. A breakout and close above the resistance trendline will likely create a bullish scenario for 1INCH.
Key Observations:
~ Primary Support: $0.345.
~ Lower support: $0.3064.
~ Primary Resistance: $0.4.
~ Invalidation Point: Breakdown and close below the support levels.
DYOR, NFA.
Please hit the like button to support my content and share your thoughts in the comment section. Feel free to request any chart analysis you’d like to see!
Thank you!
#PEACE
New awesome tokenomi with gaming and farming. Marketing is in plNew awesome tokenomi with gaming and farming. Marketing is in plan
Sanshu studio will release products soon
