Breakout as predicted - Edge of Symmetrical Triangle reached We are definitely on the bull market. As Bitcoin Dominance Index rises, we are on a safe heaven bet.
Please notice the Symmetrical Triangle analyzed earlier this week. Please also keep close attention to the 4H candle selloff - Massive positive outbreak.
RSI was looking very low this week as well, as we all know how hard the drop hit us. As expected a correction came through and everything as predicted through MACD below 0 overlapping on the Signal by far.
Get ready to make some bank ladies and gents. Any comments and feedback are always appreciated as usual!
Happy and safe trading,
Cryptomaniac
AAVEUSD trade ideas

aave 2.8.21AAVE on a tear . 1100 is my mid term target. DEFI is what i will be paying attention to . AAVE has continued to climb at a perfect pace. Not too fast so that oscillators get overheated and not too slow to bore out buyers. We were able to get in on the flash dip to 400. I would suggest that along the way, in your altcoin bags, take some of your profits and lock it in ether. Then when the dips come you have dry powder ready to go at a moments notice. This is the bluechip and one of the only ones you need as a core holding. I've consolidated my defi into all ether, aave. Still holding a maker bc theres only 1 million

How long will AAVE keep rising ? AAVE is a consistent gainer so far. How much can the price rise before we see a breakout of this ascending channel?

aave potential weekly short swing setupCamarilla pivots. + cpr. You could put stop tight just beyond H3. wide at H4

aave 2.7.21AAVE has been an incredible ride. It shows this crash patter of 1-2 stop start pattern. i dont think we've seen the real breakout yet. Aave should be able to hit 1200 very soon.

AAVE breakout prediction ACCURATE - now pushing for new heights?Accurately predicted the breakout out of the 340s.... a brief pullback, but doesn't look like we're slowing down soon boys!


AAVE, POSSIBLE BOUNCE OFF THE CURRENT SUPPORTAAVE SHOWING A BOUNCE OFF CURRENT SUPPORT COULD BE BULLISH... STILL BE CAUTIOUS

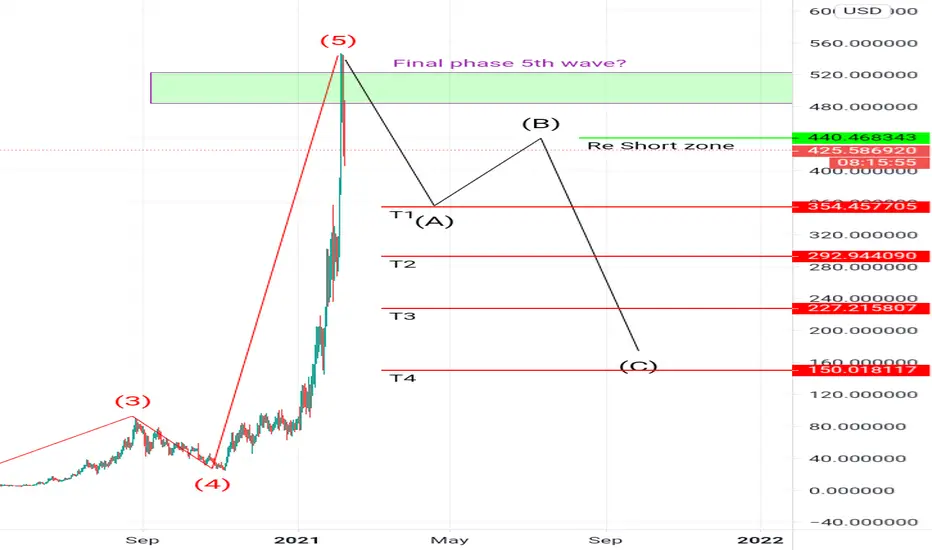
AAVE - Possible drop incoming to the $440 area. I sold my position for a possible drop we could gain more and see if there will be a push back up!

AAVE KEY RESISTANCE AAVE KEY REISTANCE LEVEL.. A BREAK OUT PAST THIS COULD COMFIRM NEXT LEG UP...A REJECTION AND POSSIBLE RETEST OR FURTHER CORRECTION BEFORE A BIG BOUNCE

Correction before more upside. Prepare to buy the DIP!500 is a strong resistance. A line drawn from two bounces that hit at the bottom provides a possible bounce target. After the massive gains from the last two days we may see a correction before more upside to mars.
RSI, super overbought, needs to cool down a bit before going parabolic.
*This is my first post btw*

AAVE 2 OPTIONS FROM HEREAAVE HAS 2 OPTIONS EXPLODE TO 600$ AND CONTINUE THE UPTREND , OR SLOW DOWN AND CONSALDATE BETWEEN 400-600$ BEFORE CONTINING TO GO HIGHER... BEARE OF BOTH OPTIONS...I REMAIN BULLISH AND CONTINUED TO THINK WE TREND UP


AAVE cCLEAN BOUNCE OFF $378BOUNCE OFF $378 .. WE COULD RANGE UNTILL A BREAKOUT.. BEWARE AS WE GO FOREWARD... I REMAIN BULLISH


