✴️ Can Aave Go Beyond $1,000? Yes! (1,700% Potential Mapped)This is the question I received recently for this pair; Can it go beyond $1,000?
👉 The next All-Time High for Aave (AAVEUSDT) can easily go beyond $1,000. This can happen late 2024 or early 2025 (rough estimate).
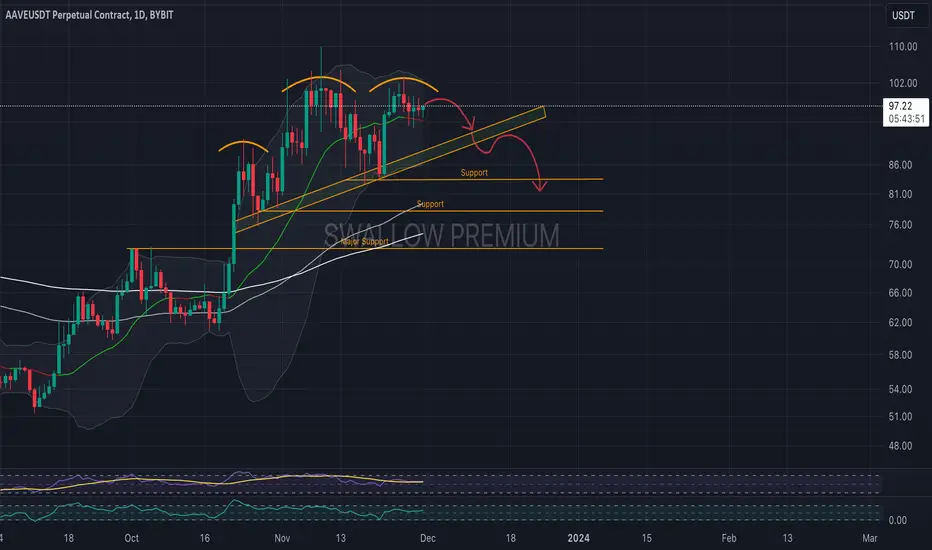
Short-term, we can have a retrace or correction ending in a higher low compared to June 2022/2023 and then resume the growth.
There will be many corrections and retraces on the way up. It is normal.
The next All-Time High can happen above $1,500 with more than 1700% potential for growth.
Thank you for asking and thanks a lot for your support.
Namaste.
AAVEUSDT.P trade ideas

Massive Move is coming | Long BiasOn month chart
I found the same consolidation phase between LINK and AAVE
So I think AAVE will breakout soon like LINK
Wait for breakout and take the big chance on Defi

AAVE: Revolutionizing DeFi with Cutting-Edge Lending Solutions!Hello to all my Crypto Savvy Followers! 👋 The FXProfessor here, spotlighting AAVE, a trailblazer in the decentralized finance (DeFi) sector. Let's delve into what makes AAVE a game-changer and explore its promising trajectory!
AAVE's Pioneering DeFi Role:
🚀 AAVE leads the DeFi charge, offering an innovative platform for lending and borrowing digital assets.
🌟 Since its 2020 inception, AAVE has amassed a remarkable $4.54 billion in its protocol, showcasing its growing popularity.
AAVE V3 - The New Frontier:
🛠️ AAVE V3 elevates the game with enhanced cross-protocol integrations, heightened security, and refined decentralization.
📈 TVL (Total Value Locked) in AAVE V3 hits $3.40 billion, reflecting its robust and secure ecosystem.
Market Performance:
💹 From $51 in mid-September to a notable $97.24 in early December - AAVE exhibits an impressive 90% gain.
📊 This surge is attributed to the escalating demand for DeFi solutions and AAVE's relentless innovation.
What's on the Horizon:
🔍 The chart suggests $120 as a crucial resistance level. Breaking this could propel AAVE towards a $100 price range.
📈 Achieving this would mark a significant milestone, potentially escalating AAVE's market cap to an estimated $14.60 bill. Link: cryptodaily.co.uk
FXProfessor's Insight:
🌟 AAVE isn't just a crypto asset; it's a testament to the evolving world of digital finance.
📚 Stay tuned for more updates as we track AAVE's journey in reshaping the DeFi landscape.
Trade smartly, embrace innovation, and let’s witness the growth of AAVE together! 💙
One Love,
The FXProfessor 💙


AAVE/USDT aave/usdt is trading here since for months and in my opinion now aave is broking their patience levels.

AAVE/USDT: Approaching 200 EMAAAVE's price is going to face a struggle to maintain upward momentum as it tests key support levels. The 200 EMA is serving as a pivotal line, with potential for a breakdown. A decisive movement below this trend could signal a continuation of bearish sentiment, potentially targeting lower support zones. Conversely, if bulls regain control and we breach the highlighted green line, we could anticipate a rally towards the upper resistance. We should watch for either a confirmed breakdown below the 200 EMA or a strong push above current resistance levels to gauge the next move.

AAVE: Bullish Flag BreakoutAAVE (AAVE) technical analysis:
Trade setup : Price is in an Uptrend. It briefly consolidated in a Bullish Flag pattern and broke out of it, back above $95 resistance, with upside potential to $115 next. Stop loss at $92 (prior swing low). Previously, following a bullish breakout from Channel Down pattern, price broke above 200-day moving average, which signaled a bullish trend reversal to an Uptrend.
Pattern : Bullish Flag pattern. Short term small rectangle trading range between diagonal parallel lines. It moves counter to the prevailing price trend observed in a longer time frame on a price chart. It forms typically following a sharp advance and often indicates a small change in direction (or areas of consolidation) before the previous trend resumes. Flag pattern is among the most reliable continuation patterns that traders use because it generates a setup for entering an existing trend that is ready to continue. Trade is initiated on a breakout, if it is in the same direction as the prevailing trend. Also, with bullish flag patterns, traders prefer a breakout with an increase in volume but it isn’t a must.
Trend : Uptrend across all time horizons (Short- Medium- and Long-Term).
Momentum is Mixed as MACD Line is below MACD Signal Line (Bearish) but RSI > 55 (Bullish).
Support and Resistance : Nearest Support Zone is $95 (previous resistance), then $80. The nearest Resistance Zone is $115.

AAVE/USDT BREAKOUT PATTERNIt can be seen that the price has penetrated the downtrend trendline, wait for the price to retest and continue its increase. Wait for confirmation such as a double bottom and so on to enter buy

AAVE/USDT bullish ride ? 👀 🚀AAVE Today Analysis💎 Paradisers, focus on #AAVEUSDT as it shows a significant opportunity for growth. Currently trading in a demand zone and maintaining robust momentum above the EMA, AAVE is hinting at a strong probability of a bullish movement.
💎 Reflecting on #AAVE recent market behavior, we’ve observed a pattern where resistance levels have turned into support, leading to upward movements. After a rejection from a short-term supply level and a retest of the support creating an equal low, it now appears poised for a bullish shift.
💎 Its substantial momentum above the EMA, coupled with the strengthening demand zone, bolsters the bullish outlook. If #AAVE continues this upward momentum, it's targeting resistance levels at $115.13 and $137.40.
💎 However, in the dynamic realm of trading, #AAVE traders must stay prepared for various possibilities. Should #AAVE fail to sustain its bullish momentum and fall below the current demand level, a different market response might emerge. Be ready for a potential bullish recovery from another key support level of $92.86. Nevertheless, a drop below this crucial level might signal challenges in maintaining the bullish trend.🌴💰

longterm $aaveBeside the short term BINANCE:AAVEUSDT trade, I am looking to trade it also longterm.
thinking CRYPTOCAP:BTC will ripping next year facing a btc etf.
bottom was surely in at about $50. having an awesome risk/reward ratio 5.8

Aave (AAVE): Time To Re-Claim Lower Supports 👀 AAVE is currently in a pivotal phase, testing the resilience of a bullish trend that has been the backbone of recent upward movements. The price is hovering near the middle line of the Bollinger Bands, suggesting a potential turning point. We are closely monitoring for a breakdown below this middle line, which lines up with the supporting trend line that aligns with the lower Bollinger Band.
A significant move below this area of support could prompt a bearish shift, leading to a retest of lower support zones. The key to bearish confirmation would be a successful breakdown, re-test, and subsequent re-claim of these lower levels.
AAVE- One of the most Promising Charts (and DEFI projects) First of all: I do expect to see 208$ AAVE between now and mid-next year.
So this can be a great call for spot.
Then again the market is a rollercoaster so no promises that 46-50$ is not a possibility: everything is possible here, especially now in 2023.
In any case, BTC seems ready for a massive breakout, the most important one this year as it unlocks 40k potential. this can bring the 'Good Alts' like AAVE higher.
78,5$ would be entry (breakout for AAVE) but i prefer to be positioned earlier.
Plus AAVE gave me the best trade i had this month with quite an insane entry (i did cash out half at the top and still holding)..hope it goes even better next
One Love,
The FXPROFESSOR

AAVE: Bullish Flag BreakoutAAVE (AAVE) technical analysis:
Trade setup : Price is in an Uptrend. It briefly consolidated in a Bullish Flag pattern and broke out of it, back above $95 resistance, with upside potential to $115 next. Previously, following a bullish breakout from Channel Down pattern, price broke above 200-day moving average, which signaled a bullish trend reversal to an Uptrend.
Pattern : Bullish Flag pattern. Short term small rectangle trading range between diagonal parallel lines. It moves counter to the prevailing price trend observed in a longer time frame on a price chart. It forms typically following a sharp advance and often indicates a small change in direction (or areas of consolidation) before the previous trend resumes. Flag pattern is among the most reliable continuation patterns that traders use because it generates a setup for entering an existing trend that is ready to continue. Trade is initiated on a breakout, if it is in the same direction as the prevailing trend. Also, with bullish flag patterns, traders prefer a breakout with an increase in volume but it isn’t a must.
Trend : Uptrend across all time horizons (Short- Medium- and Long-Term).
Momentum is Mixed as MACD Line is below MACD Signal Line (Bearish) but RSI > 55 (Bullish). MACD Histogram bars are rising, which suggests that momentum could be nearing another upswing.
Support and Resistance : Nearest Support Zone is $80 (previous resistance), then $65. The nearest Resistance Zone is $95, which it broke, then $115.

Entry by trigger zone When we are in suffering, we should wait for the process to move from one side and make our entry according to the movement.

AAVEUSDT Waiting for sell signals. Setting up.Stay patient. If strong high breaks -> This prediction does not work. It only works if we get sell signal from Cipher B and we will change of direction. Patience!
📈 Smart Money Concept - Strong High Zone:
The "smart money" concept refers to the large institutional traders and sophisticated investors who often possess significant market influence. Identifying a strong high zone involves recognizing a price level where these influential market participants are actively buying or selling. In this context, a strong high zone typically signifies a level where institutional players are selling, suggesting a potential change in market direction.
💼📉 Institutional Presence:
Smart money traders often leave their footprint at key levels. A strong high zone is indicative of a region where institutional selling pressure is concentrated, suggesting a collective decision to exit or take profits.
🔄📉 Change in Direction:
When a strong high zone is identified, it serves as a potential signal for a change in market direction. It implies that the dominant trend might be losing momentum, and a reversal or correction could be on the horizon.
📉 Cipher B Divergence - Sell Signal:
Cipher B is a technical analysis pattern, and divergence refers to a situation where the price moves in the opposite direction of a technical indicator. In this case, a Cipher B divergence sell signal occurs when the price is making higher highs, but the indicator, such as the RSI or MACD, is making lower highs.
🔍📈 Identifying Divergence:
Divergence is a powerful tool for spotting potential trend reversals. In the context of Cipher B, a sell signal suggests that, despite rising prices, the underlying momentum or strength is decreasing, indicating a weakening bullish trend.
⚠️ Combining Signals:
The combination of a strong high zone and a Cipher B divergence sell signal strengthens the overall bearish case. It implies that not only are institutional traders selling at a notable level, but there is also a divergence between price action and underlying momentum, signaling potential weakness in the current uptrend.
📊💡 Trading Strategy:
Traders may consider implementing a sell strategy or adjusting their positions when both the strong high zone and Cipher B divergence sell signal align.

Aave's ($AAVE) Growth Closely Tied to Bitcoin Rally
The upward trend for AAVE continues, albeit with a slowdown in growth over the past week. A key challenge for buyers lies in the resistance zone between $103 and $110, which has been tested five times within a month but remains unbroken.
For AAVE, the goal is to sustain its growth and set new annual highs. Should it break through the current resistance zone, the next significant levels that could potentially impede its ascent are situated at $115 and $120. The momentum of this growth will largely depend on the buying activities in BTC.
If a market correction occurs, the AAVE price could see a considerable decline. The initial target during such a correction would be the buying zone at $83-$88. Further down lies a resistance level at $77.8 and a range between $70.2 and $74.5. These levels are expected to be tested if there's a significant correction in BTC, possibly down to around $32,000.

AAVE on the move?7-star has just received a buy print in AAVE. we hope to have a uptrend and the targets are clearly on the charts. DYOR

AAVEUSD_4HHello
After breaking the upward trend line, the market has entered an upward wave
Currently, for the medium term, the main support range is 93 to 95, and by maintaining this area, it will be possible to continue the rising wave.
The target is 106 to 109 and by passing through this area, it will be possible to climb up to area 117 to 126.

AAVE/USDT Daily chart this is how I think the aaev can move like. AAVE could stay in this triangle for a week maybe and then I expect a big pump, but keep looking to the BTC chart too, if the markt doesn't dump this prection would work.

AAVE buying zone (investing only)you see in the chart three indicated zone for buying AAVE
the zones contains fib clusters , demand areas , strong supports .
IMO , the first zone is the best one , then comes the second and finally the third zone (30% for the first zone , 30% and 40% from your portfolio if the worst happen and we reach the third zone )
this is not a financial advice
thank you

aaveusdtI have taken a Long position on AAVE, and this is my own idea. This trade is executed on Bybit.

