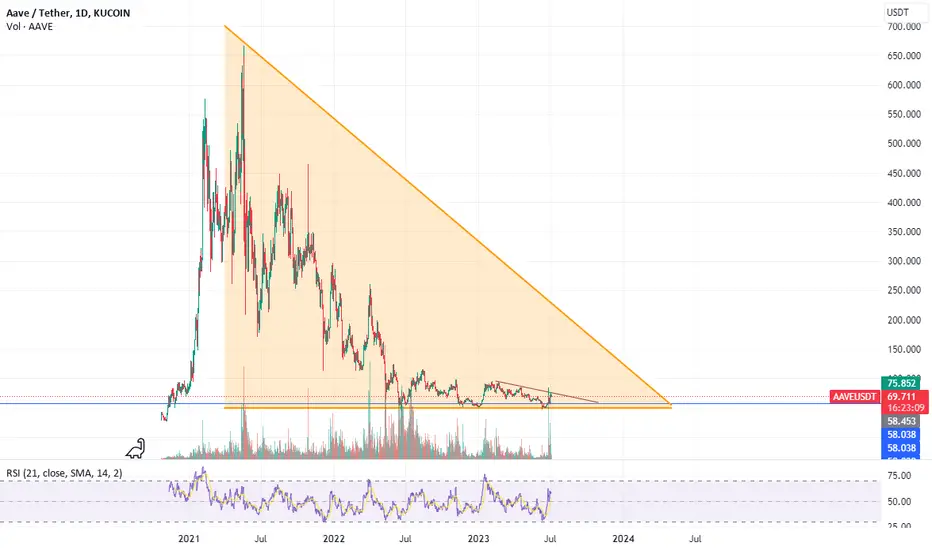
AAVE/USDT reached the sealing!Hey traders 👋
AAVE has been showing some strength recently but is it time for a nice turnover? RSI is ready, BB indicator is ready and price of AAVE is stuck below that resistance. We are going to look for a daily candle to close below that line!
If we see this kind of struggle more then there is a good chance for a drop to happen!
If you like ideas provided by our team you can show us your support by liking and commenting.
Yours Sincerely,
Swallow Team
Disclamer:
We are not financial advisors. The content that we share on this website are for educational purposes and are our own personal opinions.
AAVEUSDT.P trade ideas

AAVE long and short set uppotential bearish cypher at Monthly projection. Utilized the opportunity to gain. Dont forget to set stoploss and proper position sizing. Safe Trades everyone

AVEE S&R>>>>>>>>>>I Have Tried My Best to Bring the best Possible outcome in this Chart.
AVEE moving in the short term downtrend pattern's and have a good chance to start upside price and support from each marked area's .
All supply and resistance's marked on the chart.
It's Not a financial advise.
PLZ DYOR
With hopping success>>>>>>

AAVE will continue his falling?!BITGET:AAVEUSDT touched the Lower High's trendline and immediately went back down for a -4,56% (respect the +11% that was made before).
This means that BITGET:AAVEUSDT rejected the trendline and went back.
This could indicate that BITGET:AAVEUSDT could go short again for some time, in the extreme case it could touch again the blue support.
Or BITGET:AAVEUSDT could retest the trendline and even break it and go up to +100$ or even more.

long AAVEEURONEXT:AAVE broke through the major resistance level. Bullish movement to resistance level at $92 is expected to happen.

AAVEHello friends. nothing is impossible. After exiting the cloud and the descending channel, also crossing the 103-day average. After stabilizing and closing the candle outside the channel, a good opportunity to enter at the price of 71 was created.

📈 $AAVE Spotting a Triple Bottom within a Downward Channel! 🔍EURONEXT:AAVE has caught our attention with a compelling price pattern - a triple bottom formation within a downsloping channel. 📉⚖️ This setup presents an intriguing opportunity for traders!
The triple bottom, characterized by three distinct lows, suggests a potential bullish reversal. Combined with the downsloping channel, it adds an interesting dynamic to the price action. 📈🔄
Will EURONEXT:AAVE break out of the channel and embark on a bullish rally? Or will it face resistance and continue its downward trajectory? Join the discussion! 📊💬
#AAVE #TechnicalAnalysis #TripleBottom #DownslopingChannel #BullishReversal #TradingOpportunity #TradingView"
Remember, technical analysis is just one piece of the puzzle. Always conduct thorough research and practice risk management. Happy trading! 🚀💰

this is aave from beginingyou can see aave chart from begining BINANCE:AAVEUSDT as you can see we are in support line, this is for almost all altcoins. dont worry about futere,if you love crypto and if you believe to crypto, buy at thic prices, altcoins for examples, BINANCE:SOLUSDT , BINANCE:ADAUSDT , BINANCE:DOTUSDT , BINANCE:DASHUSDT , and,,, worth to buy now for this prices.
aave buy nowBINANCE:AAVEUSDT i think now is good time for buying aave. it has around 30%profit . are you agree?

AAVEUSDT 1WI like this coin and it depends on BTC you can check and trade it...
it can take a lot of time to go to the red zone cuz its monthly movment but it can be really nice trade....
Hope you enjoy it
if you need Lower time frames just Leave a comment below here

AaveusdtVolume spiking like crazy
Long term downtrend line in accumulationzone yet to break
Monthly candles look pretty primed

AAVEUSDT Elliott Waves AnalysisHello friends.
Please support my work by clicking the LIKE button👍(If you liked). Also i will appreciate for ur activity. Thank you!
Everything on the chart.
Entry: market and lower
Targets: ~100 and ~115
after first target reached move ur stop to breakeven
Stop: ~52 (depending of ur risk). ALWAYS follow ur RM .
RR: 1 to 3.5
risk is justified
Good luck everyone!
Follow me on TRADINGView, if you don't want to miss my next analysis or signals.
It's not financial advice.
Dont Forget, always make your own research before to trade my ideas!
Open to any questions and suggestions

aaveusdtHello friends. This currency pair is flashing me a few ruri. It is in a good place. It is coming out of the cloud and also crossing the 103-day moving average and the descending line. What do you think? Nothing is impossible. Maybe I will enter at the desired point.

AAVE/USDT on bigger frame Hey traders 👋
Taking a look at AAVE on bigger frame where we see the price jumping from one side to another in our small triangle formation here! Best thing to do here is just to trade from one side to another until we see any clear signs of breakout or breakdown! What do you think guys?
Will be keeping an eye on BB indicator here as well as a liquidity zones!
If you like ideas provided by our team you can show us your support by liking and commenting.
Yours Sincerely,
Swallow Team
Disclamer:
We are not financial advisors. The content that we share on this website are for educational purposes and are our own personal opinions.

AAVE is going to hit 8412h time frame
-
AAVE has potential to create a rising structure to hit 84.
Then retest 70 and continue to pump to 95.
-
Entry: 61.5
TP: 84, 95
SL: 56.95

More upside before a bearish moveI'm looking at the market making this move. Based on my strategy, the market looks more bullish. The market pulled back to -0.7 level (green) which a signal to buy just like it did previously at 0.7.
NOT FINANCIAL ADVISE.

AAVEUSDTWe could see strong support building on the lower line, with further consolidation above that support, we could see a 200% move up in the next 6 months upon breakout above historical resistance. Maybe a quick sell off in the short term.


AAVE/USDT IS READY TO FLY.💎 Calling all ParadiseClub members!
💎 Let's delve into the current AAVE landscape and unearth some crucial insights:
💎 Hold tight as AAVE appears extremely promising at these levels.
💎 AAVE/USDT has formed a triple bottom, which is a bullish indicator.
💎 Now, AAVE is attempting to break its 1-Year long triangle,
💎 It's also worth noting that AAVE/USDT has perfectly broken its 50-Day-SMA and is now trying to break its 200-Day-SMA along with the 1-Year long triangle.
💎 Once the aforementioned chart pattern breaks with volume, one can consider going long in the market.
💎 The upcoming significant levels will be 85-95-110 and it can potentially stretch further towards the 120 area.
💎 Stay ahead of the curve and surf the success waves in the crypto universe!

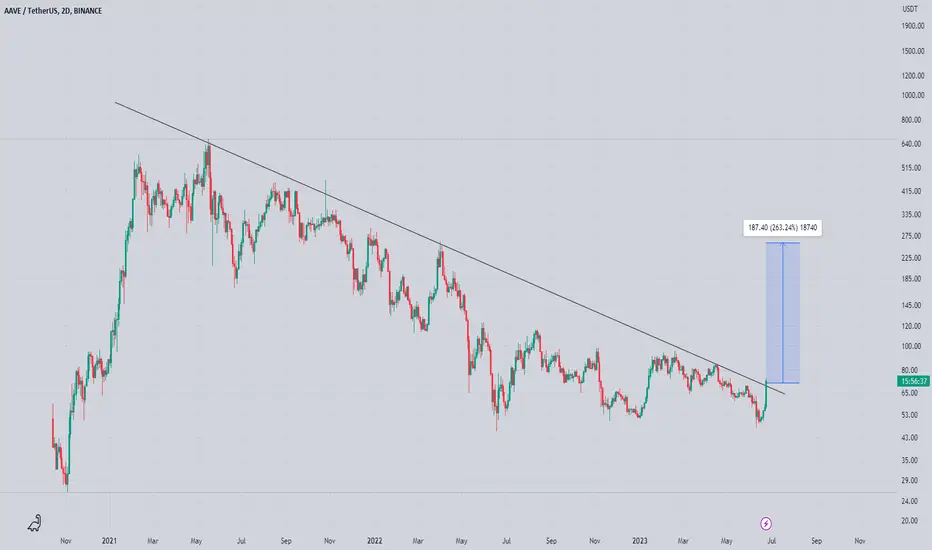
Aave Looks Promising for Midterm Seems Like Getting Ready For Massive Breakout Testing Trend line In 2 Days Timeframe Incase Of Breakout Expecting 240 - 260% Bullish Wave
Keep Eyes On Aave For breakout
aaveBINANCE:AAVEUSDT is now reached to a dynamic red zone. and i think it will be reject from there now. lets see what,s doing now.

