AAVE analysis: Bullish!AAVE has been consolidating for almost two years and is now on the verge of breaking out of this consolidation range, IMO, $60 is an acceptable support level to buy, with an ultimate target of $1,265.
AAVEUSDT trade ideas

AAVE Based on our current analysis, AAVE is projected to rise by 30.13%, reaching $135.81 by June 7, 2024. Our technical indicators indicate a Neutral sentiment, with the Fear & Greed Index registering 73 (Greed). Over the past 30 days, AAVE has shown a 50% increase in positive performance days, accompanied by 9.29% price volatility.

AAVE (Aave): Waiting For Lower Zones To Be Touched!Aave has formed a local top, and now it is looking for a new zone from which to bounce off.
We see a good chance of the lower support zone being touched and the EMAs being tested as well so this would be the zone we will be looking at!
Swallow Team

AAVEUSDT1. AAVE Selling Plan this cycle.
2. Subject to change of course depending how alt season goes.
3. Note the FIB extension 1.618 is actually at $1,042 but It's better we sell rest at $972 to avoid Psychological resitance at $1,000.
4. I note AAVE could go so much higher this is just my plan.

AAVE Re-Accumulation & New 5 Wave ImpulseAave has a textbook re-accumulation as well as a complete 5 wave structure with ABC correction. We are currently starting a new 5 wave impulsive structure, which should continue upwards. Some likely targets are the 1.382 and 1.618 that I have marked on the chart, and beyond

😏let's go aave👨💻Hello fellow traders
My view on aave is bearish, but at the risk of the trend line, which is above, we can also take its rise
But I don't do that
My reasons for the loss of one of our volumes are clearly reduced. The number of collisions with our daily resistance is high, which reduces its strength and increases the probability of failure.
For those people who take risks, below the number 81.74 is suitable in my opinion, and for those who trade safely, 78.63
Be sure to take responsibility for your own actions
⚠️Do capital management⚠️

AAVE/USDT It possible breakout and continue upward movement!💎 Paradisers, #AAVE is indeed a coin worth monitoring closely.
💎 Currently, AAVE is facing resistance around 98.15. Upon reviewing the chart, it appears to be in an accumulation phase, indicating potential bullish momentum if AAVE successfully breaks out of the resistance and the descending resistance simultaneously.
💎 Such a breakout could lead to significant upward movement, possibly testing our target strong resistance area.
💎 However, if AAVE fails to break the descending resistance and experiences a rejection with a bearish candle, this could signal a potential downturn. In this scenario, the price may retreat to retest the support around 79, initiating another significant downward momentum.
💎 Historically, the price has consistently bounced each time it hit the support of the accumulation phase. Therefore, if AAVE revisits this zone, there's potential for a reversal. However, if it fails to bounce and even breaks down below the support, it may head towards the key support area.
💎 In the event of an upward scenario, if AAVE revisits the key support, it's crucial to reclaim the support around 79. Failure to do so, resulting in a break below the key support, would confirm bullish invalidation and likely lead to further downward movement.
MyCryptoParadise
iFeel the success🌴

AAVE: Channel DownTrade setup : Price is in a downtrend, trading in a Channel Down pattern. We wait for a breakout, ideally above $100 resistance and 200-day moving average, to signal bullish trend reversal.
Pattern : Price is trading in a Channel Down pattern. With emerging patterns, traders who believe the price is likely to remain within its channel can initiate trades when the price fluctuates within its channel trendlines. With complete patterns (i.e. a breakout) – initiate a trade when the price breaks through the channel’s trendlines, either on the upper or lower side. When this happens, the price can move rapidly in the direction of that breakout. Learn to trade chart patterns in Lesson 8.
Trend : Downtrend across all time horizons (Short- Medium- and Long-Term).
Momentum is Mixed as MACD Line is above MACD Signal Line (Bullish) but RSI ~ 50 (Neutral).
Support and Resistance : Nearest Support Zone is $80, then $60. The nearest Resistance Zone is $105 (previous support), then $130 and $150.

📈 AAVE Trade Analysis 🔄💼Trade Overview:
AAVE seems to have established a range low after filling the Fair Value Gap (FVG) and forming a triple bottom pattern, suggesting a potential bullish reversal. Monitoring for a final sweep to fill 50% of the wick or a Market Structure Shift (MSS) can help confirm the trade setup.
Trade Strategy:
Entry: Consider entering a trade between $75 to $85, capitalizing on the range low and potential reversal pattern.
Take Profit: Set take profit targets around $120 and $160, aiming for gains within these levels.
Stop Loss: Place the stop loss at a daily close below $70 to manage risk effectively.
📊🔍 Stay attentive to AAVE's price action for trade validation and adjustments! #AAVETrading #CryptoAnalysis 🌐🔒

AAVE: Approaching SupportTrade setup : Trends are mixed to down. After a bearish breakout from a Channel Up pattern, price broke below 200-day moving average, which is a sign of downtrend. Trend Traders: It bounced off of $80 support and could approach $100 but it’s a higher risk trade setup since overall trend is down. Price needs to break back above 200-day MA (~$100) to resume its uptrend.
Trend : Downtrend across all time horizons (Short- Medium- and Long-Term).
Momentum is Mixed as MACD Line is above MACD Signal Line (Bullish) but RSI ~ 50 (Neutral).
Support and Resistance : Nearest Support Zone is $80, then $60. The nearest Resistance Zone is $105 (previous support), then $130 and $150.

AAVE: Approaching SupportTrade setup : Trends are mixed to down. After a bearish breakout from a Channel Up pattern, price broke below 200-day moving average, which is a sign of downtrend.
Trend Traders : It’s now sitting at $80 support, which held up a couple of times recently and could be a swing trade entry but it’s a higher risk trade setup since overall trend is down. Price needs to break back above 200-day MA (~$100) to resume its uptrend.
Trend : Downtrend across all time horizons (Short- Medium- and Long-Term).
Momentum is Mixed as MACD Line is above MACD Signal Line (Bullish) but RSI < 45 (Bearish). MACD Histogram bars are declining, which suggests that momentum is weakening.
Support and Resistance : Nearest Support Zone is $80, then $60. The nearest Resistance Zone is $105 (previous support), then $130 and $150.

AAVE: Approaching SupportTrade setup : Trends are mixed to down. After a bearish breakout from a Channel Up pattern, price broke below 200-day moving average, which is a sign of downtrend. Trend Traders: Price needs to break back above 200-day MA (~$100) to resume its uptrend.
Trend : Downtrend on Short- and Medium-Term basis and Neutral on Long-Term basis.
Momentum is Mixed as MACD Line is above MACD Signal Line (Bullish) but RSI < 45 (Bearish).
Support and Resistance : Nearest Support Zone is $80, then $60. The nearest Resistance Zone is $105 (previous support), then $130 and $150.

Aave, a DeFi pillar in a long accumulationAave (AAVE) is a key player in the Decentralized Finance sector, at -86% drawdown, which is back in its long accumulation range. Our Supreme Vision (BSV) tool is also indicating a new accumulation period (green background)!
Moreover, according to the Master Oscillator (BMO), less than 40% of addresses are in profit, with a slight increase in the percentage of supply held by Whales and long-term Holders.

AAVE: Approaching ResistanceTrade setup : Trends are mixed to down. After a bearish breakout from a Channel Up pattern and below 200-day moving average, price bounced up from $80 support and could swing up to $100 again (200-day MA). Trend Traders: Price needs to break back above 200-day MA (~$100) to resume its uptrend.
Trend : Downtrend on Short- and Medium-Term basis and Neutral on Long-Term basis.
Momentum is Mixed as MACD Line is above MACD Signal Line (Bullish) but RSI < 45 (Bearish).
Support and Resistance : Nearest Support Zone is $80, then $60. The nearest Resistance Zone is $105 (previous support), then $130 and $150.

AAve USdt Plans 30MTFAAve USdt Plans 30 MTF
entry and tp is mentioned on charts
i am not saying anything from my side charts are speaking
lets see what move further

Aave - 180$ possibleThis small double bottom has a good chance to be played out. Of course that would only be the first step and just a small daytrade, but think we will see 180$ or even 200$ in the near future.
Stay safe!

AAVE: Approaching ResistanceTrade setup : Trends are mixed. Price had a bearish breakout from a Channel Up pattern and below 200-day moving average. It got oversold (RSI ~ 30) and bounced off of $80 support. Now it’s approaching a stiff resistance area: 200-day MA (~$100) and $105 horizontal resistance zone.
Swing Traders: if price gets rejected at this resistance area, it could pull back and revisit $80 again.
Trend Traders: Price needs to break back above 200-day MA (~$98) to resume its uptrend.
Trend : Downtrend on Short- and Medium-Term basis and Uptrend on Long-Term basis.
Momentum is Mixed as MACD Line is above MACD Signal Line (Bullish) but RSI < 45 (Bearish).
Support and Resistance : Nearest Support Zone is $80, then $60. The nearest Resistance Zone is $105 (previous support), then $130 and $150.


AAVE: Approaching ResistanceTrade setup : Trends are mixed. Price had a bearish breakout from a Channel Up pattern and below 200-day moving average. It got oversold (RSI ~ 30) and bounced off of $80 support. Now it’s approaching a stiff resistance area: 200-day MA (~$100) and $105 horizontal resistance zone. Swing Traders: if price gets rejected at this resistance area, it could pull back and revisit $80 again. Trend Traders: Price needs to break back above 200-day MA (~$98) to resume its uptrend.
Trend : Downtrend on Short- and Medium-Term basis and Uptrend on Long-Term basis.
Momentum is Bearish but inflecting. MACD Line is below MACD Signal Line and RSI is below 45 but momentum may have bottomed since MACD Histogram bars are rising, which suggests that momentum could be nearing another upswing.
Support and Resistance : Nearest Support Zone is $80, then $60. The nearest Resistance Zone is $105 (previous support), then $130 and $150.

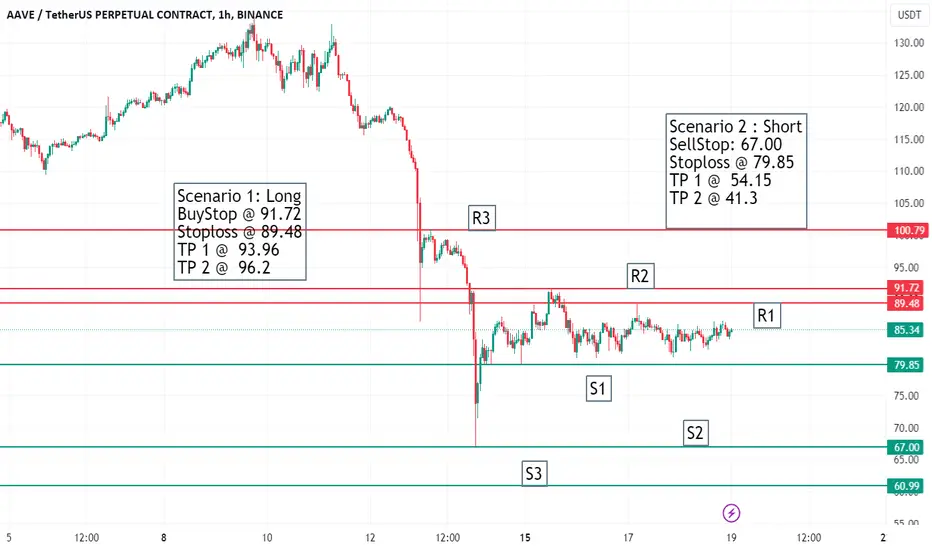
AAVEUSDT- RangingAAVEUSDT is ranging with no clear series of HH and LL's. one can enter in the trade if range is broken on either sides. Significant levels are marked on the chart.
Entries to be taken either at R2 or S2
AAVE: Oversold at SupportTrade setup : Trends are mixed. Price had a bearish breakout from a Channel Up pattern and below 200-day moving average.
Swing Traders: Near term, price is oversold (RSI ~ 30) near $80 support, which means that it could bounce up to $98 for a +20% gain.
Trend Traders: Price needs to break back above 200-day MA (~$98) to resume its uptrend.
Pattern : Price was trading in a Channel Up pattern. With complete patterns (i.e. a breakout) – initiate a trade when the price breaks through the channel’s trendlines, either on the upper or lower side. When this happens, the price can move rapidly in the direction of that breakout.
Trend : Downtrend on Short- and Medium-Term basis and Uptrend on Long-Term basis.
Momentum is Bearish but inflecting. MACD Line is below MACD Signal Line and RSI is below 45 but momentum may have bottomed since MACD Histogram bars are rising, which suggests that momentum could be nearing another upswing.
Support and Resistance : Nearest Support Zone is $80, then $60. The nearest Resistance Zone is $105 (previous support), then $130 and $150.

Aave(AAVE): RSI is recovering. AAVE coin has had a nice small consolidation after that nice downward movement from breaking both 100 and 200 EMA.
We have displayed 2 points of interest for us where we will be looking for a potential downward movement; all we have to do now is wait!
Swallow Team

AAVE: Oversold at SupportTrade setup : Trends are mixed. Price had a bearish breakout from a Channel Up pattern and below 200-day moving average.
Swing Traders:Near term, price is oversold (RSI ~ 30) near $80 support, which means that it could bounce up to $98 for a +20% gain.
Trend Traders: Price needs to break back above 200-day MA (~$98) to resume its uptrend.
Pattern : Price was trading in a Channel Up pattern. With complete patterns (i.e. a breakout) – initiate a trade when the price breaks through the channel’s trendlines, either on the upper or lower side. When this happens, the price can move rapidly in the direction of that breakout.
Trend : Downtrend on Short-Term basis, Neutral on Medium-Term basis and Uptrend on Long-Term basis.
Momentum is Bearish (MACD Line is below MACD Signal Line, and RSI is below 45).
Support and Resistance : Nearest Support Zone is $80, then $60. The nearest Resistance Zone is $105 (previous support), then $130 and $150.
