AAVE USDT PERPHello Trader OKX:AAVEUSDT.P
there is a possibility that the area bounces back in the support area
is still there and could happen for the long area
entry 62.93 - 62.22
stoploss 60.90
Please add a comment and Positive feedback and
constructive criticism are important to authors and the
community.
Disclamer: Not Financial Advice
AAVEUSDT trade ideas

AAVEUSDT → Breakout of descending triangle resistance BINANCE:AAVEUSDT is forming a breakout of the descending triangle resistance. Buyers are confidently holding the bottom, keeping the price below 55.00, but at the same time testing a trend change attempt
AAVE follows BINANCE:BTCUSD . A momentum and a small pullback is forming. This is partly a bad thing. Until bitcoin gets momentum and a breakout of local resistance, the pegged coin will also stand still. If the market doesn't acquire a buyer while the coin consolidates above the broken resistance, the flat formation will continue. Bitcoin is strengthening as it receives fundamentally positive data, mostly related to ETFs.
From a technical analysis perspective, AAVE has good upside potential. A prolonged consolidation for 15 months is forming and the price moving beyond resistance is signaling possible upside. The price is testing the MA-200, if the moving average is broken, there will be a chance for growth to 91.3
Support levels: previously broken resistance, MA50, 55.2.
Resistance levels: MA-200, 69.56.
I expect consolidation above the previously broken trend line with subsequent retest and breakout through MA-200.
Regards R. Linda!

AAVE time for longEntry: 63.16
TP1: 63.79
TP2: 64.42
TP3: 65.05
stop loss: 62.53
it needs to fly here. Im also waiting for 88 this coin.

AAVE short setup After the breaking of dynamic resistance and formation of bullish CH, this symbol has moved up. It is now close to an order block. This block order is fresh and unused. You can look for sell/short positions in the red box.
I specified the targets. When we reach the first target, save some profit and then change the stop to entry
I specified the invalidation level, closing a 4-Hour candle above this level will violate the analysis.
For risk management, please don't forget stop loss and capital management
Comment if you have any questions
Thank You


Area to break upward: 64.256-65.37Hello?
Hello traders!
If you "Follow" us, you can always get new information quickly.
Please also click “Boost”.
Have a good day.
-------------------------------------
(AAVEUSDT chart)
The key is whether the price can be maintained by rising above the 64.256-65.37 range.
The 64.256 point corresponds to the volume profile section of the 1W chart.
(1D chart)
I don't see any major support or resistance points.
Accordingly, if it rises above 85.7 among the currently formed support and resistance points, it is expected to show a full-fledged upward trend.
The HA-Low indicator and the MS-Signal indicator are rising and are showing signs of continuing to rise further.
Accordingly, if the price remains above 58.35, it is expected to lead to a move above 75.22.
What is important is whether it can break upward through the 64.256-65.37 range mentioned before on the 1W chart and 1M chart.
-------------------------------------------------- -------------------------------------------
** All explanations are for reference only and do not guarantee profit or loss in investment.
** Trading volume is displayed as a candle body based on 10EMA.
How to display (in order from darkest to darkest)
More than 3 times the trading volume of 10EMA > 2.5 times > 2.0 times > 1.25 times > Trading volume below 10EMA
** Even if you know other people’s know-how, it takes a considerable amount of time to make it your own.
** This chart was created using my know-how.
---------------------------------

AAVE has bullish triangleThe coin has formed a local uptrend with rising lows along the trend line. The resistance level of $62.48 has formed.
I expect continued growth and breakdown of the local horizontal resistance level with the next approach and with high activity in the shopping feed before the breakdown.

AAVE Strong volume buyAave maintaining support. At 15m chart aave has a good volume buy. So im long AAVE

AAVE - ShortGood luck to everyone! This analysis is for educational purposes only and does not constitute financial advice. Conduct your own analysis before making trading decisions.

AAVE/USDT Had a BREAKDOWN where NOW? Hey traders👋
AAVE coin had a nice breakdown from local trend where currently it is going under the re-test to that same trend as well!
We are keeping an eye on that re-test where the last holding zone is 100EMA. We see a good potential for coin to show some bearish scenario. Keep your eyes opened and hands ready for potential drop to happen!
If you like ideas provided by our team you can show us your support by liking and commenting.
Yours Sincerely,
Swallow Team
Disclamer:
We are not financial advisors. The content that we share on this website are for educational purposes and are our own personal opinions.


AAVE - Still Targeting New Lows
June's Breakout: AAVE broke the trendline to the downside in June. But this didn't continue as expected; it was a false breakout.
August's Breakout: In August, there was another breakout, and this time, the price is continuing in the breakout direction. This means the movement is more reliable.
Target Price: Looking at past price data, the 2021 low of AAVE was at 45.60. Given the current trend, this price level seems to be a very likely target for AAVE to reach.
RSI (Relative Strength Index) Observation: There's no RSI divergence. This means that the RSI (a momentum indicator) is in agreement with the price trend. It's a reinforcement to the analysis.
2020's All-Time Low: It's uncertain whether AAVE could reach its all-time low from 2020. We'll need to monitor further price movements to make a judgement on this.

Downward Trend and Support LevelsOver the course of the past month, AAVE has exhibited a consistent downward trajectory in its price movements. This decline has been particularly notable due to its breach of the lower boundary of its short-term upward channel, followed by a precise retracement to the channel's lower limit. This retracement has effectively extended its bearish trend towards a crucial support zone at the $50 mark.
It is noteworthy that this support level aligns perfectly with the lower boundary of the currency's weekly trading range, historically recognized as a robust demand zone. However, given the prevailing market conditions, there exists a notable potential for further penetration of this support, prompting concern regarding the breach of previous price floors.
When referring to these previous floors, we are alluding to the support levels that were firmly established in the year 2023, particularly within the range of $47.5. As it stands, the current market sentiment has created a scenario where the potential for additional price depreciation looms large, with the possibility of AAVE descending further and reaching the support range of $46 becoming increasingly plausible. This suggests that AAVE may face continued downward pressure in the near term, as it grapples with the challenge of breaking through these crucial support levels.

AAVE next support zonesDear all,
I would like to draw your attention to the current state of AAVE. In daily trading, AAVE has broken its main pivot, indicating that it may reach around $50 in the coming weeks. I recommend exercising caution and waiting until it reaches the support zone before making any investment decisions. This will provide an opportunity to enter the market at a lower price and potentially yield a profitable return.
Thank you for your attention

AAVE IS ON SUPPORT AAVE is on a support after the breakout formed with the bearish flag created. Here we see the price is being supported on the highlighted zone which can possible create a bullish reversal. By any chance of a bearish breakout on this level may invalidate the trade setup.

Consolidation Phase | Wait for breakoutChart 4H TF
AAVE still in consolidation phase in range 54.8 - 57.5
Besides, AAVE has the support by ascending trend line and the resistance at 57.5
AAVE has touched 3 times to the support line so how's about fourth?
Wait a confirmation and see what happen

AAVE 50$ price level stands as strong support. Will it break it?If you look on the chart, 50$ price level stands so far as strong support. And its been 5 times, #AAVE bounced from this level.
In this Technical Analysis I want write more about possible short term moves.
You can see orange line that is Support right now. To open a short position, I would wait the coin to close with 1H - 4H candle (with body) on this line or below it. In this case the coin can drop back to 50$ or even lower.
Long position I would open If i see 4H candle close above the resistance line 56.75$ in this case the coin can bounce to other levels above (red lines) that you can see on the chart. How intense that move will be - currently hard to say. Because we are in Bear market right now. But, some news or Market Makers if they want they will push the price higher.
Thats why manage your risks and put SL to BE always

AaveusdtSitting around the range lows for the bear market..
Broken out of dotted white line but solid green line is sitting just above,
Break that and we probably see a revist of range high or at least mid range at some stage before the end of the year..
That being said the market is seriously bled right now so a turn around could take some time..
Very low liquidity environment
That being said, the obv is still in a bullish trend for the year on this chart at least..
Macd at approximafe low of range also, hinting a double bottom
So it could bounce this month and surprise everyone calling for lower on btc 24k callers, crypto has a habit of frontrunning the last move down so we'll see i spose
Any move lower should be seen as an opportunity for spot accumulation at these levels..

AAVE/USDT Trend is WEAK?Hey traders👋
AAVE coin is another one that caught our attention here with price being at trend and not showing any strong volume there. While trend is supposed to have a volume behind this time it seems to be getting weaker and weaker so we are looking for a price to have a breakdown after what we want to see a re-test.
If this plays our and re-test happens this would be our entry zone!
If you like ideas provided by our team you can show us your support by liking and commenting.
Yours Sincerely,
Swallow Team
Disclamer:
We are not financial advisors. The content that we share on this website are for educational purposes and are our own personal opinions.

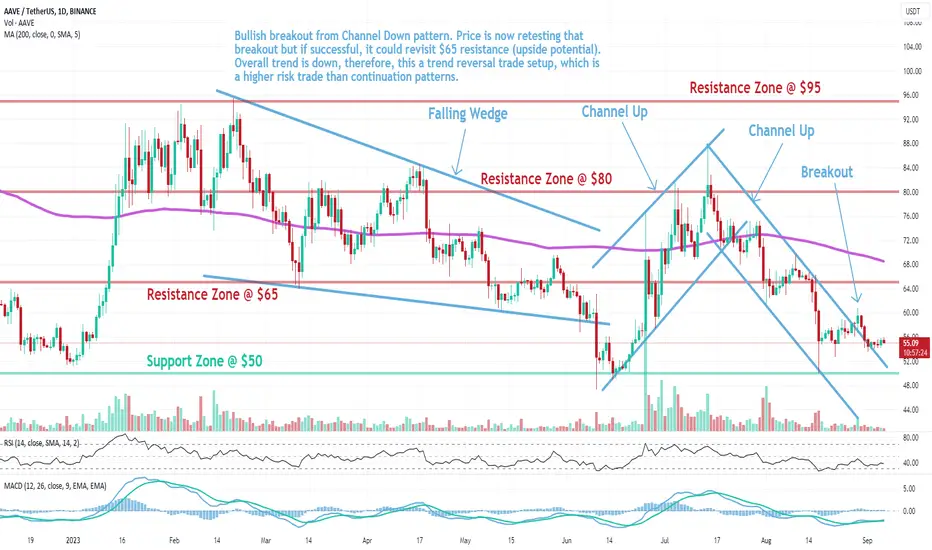
AAVE: Channel Down BreakoutAAVE (AAVE) technical analysis:
Trade setup : Bullish breakout from Channel Down pattern. Price is now retesting that breakout but if successful, it could revisit $65 resistance (upside potential). Overall trend is down, therefore, this a trend reversal trade setup, which is a higher risk trade than continuation patterns.
Pattern : Price was trading in a Channel Down pattern. With complete patterns (i.e. a breakout) – initiate a trade when the price breaks through the channel’s trendlines, either on the upper or lower side. When this happens, the price can move rapidly in the direction of that breakout.
Trend : Downtrend across all time horizons (Short- Medium- and Long-Term).
Momentum is Mixed as MACD Line is above MACD Signal Line (Bullish) but RSI < 45 (Bearish).
Support and Resistance : Nearest Support Zone is $50. The nearest Resistance Zone is $65 (previous support), then $80.
AAVE dump down to $26 - $18 rangeOne of the biggest defi coints is printing a bearish ascending triangle where wave (e) is currently underway.
Once completed, it should take price down to $26 - $18 range. Nice setup to short!

Brief Analysis——AAVEBTC fell yesterday and returned to the price before the pump. Affected by SEC, many tokens have experienced decline. The energy of Grayscale's victory was exhausted. Today's brief analysis will continue to review tokens that have been analyzed in the past. We chose NEAR and AAVE today.
As we expected, AAVE fell further after our last brief analysis. During the rebound in early August, the performance of the bulls was weak, and the price quickly came to the lows in June.
After the last round of decline, the bulls still have not strengthened, and the trading volume is almost half that of the previous two weeks. The nearly half-month rebound only covered the long red candle of Aug.17. The same as NEAR, when the entire market begins to rise, it is difficult for AAVE's bulls to strengthen (the slope of the green arrow is flat), but when the entire market begins to decline, the bears of NEAR was stronger than most tokens. On Wednesday, the bears' attack started again, and the price quickly approached 55, which is a support level.
Conclusion: The high probability decline has not ended. Although AAVE remains neutral on a large scale, you can clearly see the gap between bears and bulls from the chart. The bulls may strengthen after price approaches 55, but a reversal is unlikely. We set new resistance level at 60 and support level at 50.
Disclaimer: Nothing in the script constitutes investment advice. The script objectively expounded the market situation and should not be construed as an offer to sell or an invitation to buy any cryptocurrencies.
Any decisions made based on the information contained in the script are your sole responsibility. Any investments made or to be made shall be with your independent analyses based on your financial situation and objectives.

AAVEUSDT 12HBearish Flag and inverted Cup & Handle pattern on 12h chart. So we will test the support zone. Wait for a breakout.
