Acala Token (ACABTC) Long-Term Bullish Reversal (MACD & RSI)These are the same charts from September, the market was not yet ready for a bullish wave; patience is key.
Strategy: Buy and hold. If prices move to produce a lower low, buy more. It will be all worth it once the bullish breakout develops. Months of bearish action can be deleted within days, that is, ACABTC can grow 100-300% within a few days or weeks once it turns bullish.
Just like last time, it is still early because trading volume is still pretty low but a bullish wave can develop anytime since the bears are also weak, there is no bearish momentum. Just as there is no bullish volume there isn't any bear volume as new lows are being hit. This means that the bearish trend is weak. Once the bearish trend weakens, a reversal can happen anytime.
If you look at the MACD and RSI, we have a long-term bullish divergence (since April 2024) and this predicts a change of trend. The RSI is just coming out of oversold now and the MACD is starting to curve up to produce a bullish cross. These are early signals, but we like it early for accumulation purposes.
Thanks a lot for your support.
Namaste.
ACABTC trade ideas

Acala Token | Reversal Candle & Volume (150% Potential)Here we have an interesting one... Notice on the left side of the chart, late October 2023, the "reversal candle." After this candle prices start to rise; the initial breakout. Then a higher low and high volume comes in. A strong bullish wave.
The same dynamics are now repeating after a major lower low. The lower low is positive because it means that the bears had all the action they needed and wanted.
Mid-August, there is a "reversal candle," another one. This leads to the initial bullish breakout, prices start to rise. This breakout leads to a higher low, this is what I mention in the Bitcoin trade-idea on the section about the "altcoins market update."
Notice how trading volume rises strongly today, on this higher low. This is the start of a new bullish wave (the resumption of the bullish move after the initial breakout).
Additional details on the chart (targets).
Thank you for reading.
Namaste.

ACABTC possible breakoutHi guys,
In a matter of hours/days there is possible breakout from triangle pattern.
Look for candles that will go above or below designated triangle, those will be breakout points. It will decide if we gonna have strong bull ride or the opposite.
Worth to keep an eye on this one for sure.

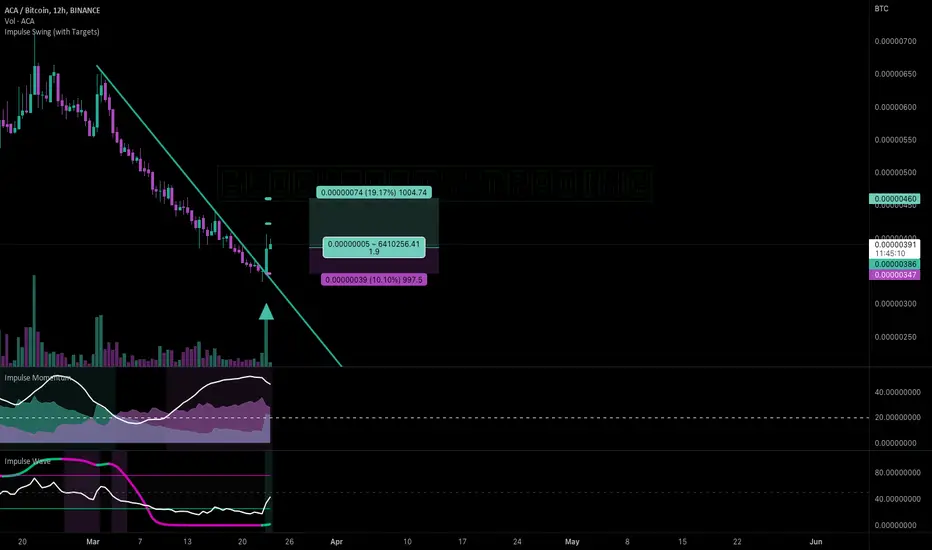
ACABTC - Long - Potential 19.17%Style: SWING
Direction: LONG
Market: SPOT
Risk: 0.25% - 1%
EXCHANGE: BINANCE
#BTC_ACA
TIMEFRAME: 720
ENTRY: 0.00000384
⎿ TP2: 0.0000046
⎿ TP1: 0.00000422
STOP: 0.00000346
Volume breakout and coming up from oversold on the RSI. BTC's sudden moves haven't helped trading against it this week so I'm going 100% to TP1.
$ACA/#BTC [#Acala Token]: BBand_Breakout_&_Resistance_Breakout◳◱ Hey crypto lovers, we've identified bullish signals on the $ACA / $BTC chart through the detection of both a Bollinger Band and a Resistance Breakout. The Bollinger Band indicates a potential bullish trend as the price has moved outside of the upper band, while the Resistance Breakout confirms this trend by showing the price breaking above a key resistance level. Given the alignment of these signals, it may be a good idea to consider entering a long position and targeting higher levels. Our analysis indicates that the key resistance levels are at 0.00000636 | 0.00000686 | 0.00000791 and the major support zones are at 0.00000531 | 0.00000476 | 0.00000371. However, it is important to also consider other factors such as overall market conditions and other technical indicators before making a trade decision.
◰◲ Technical Metrics :
▣ Mrkt Price: 0.00000624 ₿
▣ 24HVol: 19.545 ₿
▣ 24hChng: 4.874%
◲◰ Pivot Points - Levels :
◥ Resistance: 0.00000636 | 0.00000686 | 0.00000791
◢ Support: 0.00000531 | 0.00000476 | 0.00000371
◱◳ Indicators recommendation :
▣ Oscillators: NEUTRAL
▣ Moving Averages: STRONG_BUY
◰◲ Technical Indicators Summary : BUY
◳◰ Market Sentiment Index :
▣ News sentiment score is N/A
▣ Twitter sentiment score is N/A
▣ Reddit sentiment score is N/A
▣ In-depth ACABTC technical analysis on Tradingview TA page
▣ What do you think of this analysis? Share your insights and let's discuss in the comments below. Your like, follow and support would be greatly appreciated!
◲ Disclaimer
Please note that the information and publications provided are for informational purposes only and should not be construed as financial, investment, trading, or any other type of advice or recommendation. We encourage you to conduct your own research and consult with a qualified professional before making any financial decisions. The use of the information provided is solely at your own risk.
▣ Welcome to the home of charting big: TradingView
Benefit from a ton of financial analysis features, instruments and data. Have a look around, and if you do choose to go with an upgraded plan, you'll get up to $30.
Discover it here - affiliate link -

⚡️ #ACA/ BTC - Potential 298% - Long ⚡️⚡️ #ACA/ BTC - Potential 298% - Long ⚡️
Entry Conditions:
- Bullish Divergence
- Wave Reversal
- Nearing Bottom Of Trendline Support
- Descending Wedge
- Minimal Volume to breakthrough to higher targets

ACA/USDT BREAKOUT READY TO PUMP 240%!!Hi guys, This is CryptoMojo, One of the most active trading view authors and fastest-growing communities.
Do consider following me for the latest updates and Long /Short calls on almost every exchange.
I post short mid and long-term trade setups too.
Let’s get to the chart!
I have tried my best to bring the best possible outcome in this chart, Do not consider it as financial advice.
Get some ACA in BTC pair.
Likely to pump.
Buy on spot.
Accumulate in this range:- $0.0000011 to $0.000001170
Target:- $0.000001380 - $0.000001650 - $0.0000024 - $0.000003250 - $0.000004
SL-$0.00001060
DYOR, Not Financial Advice
This chart is likely to help you in making better trade decisions if it did consider upvoting this chart.
Would also love to know your charts and views in the comment section.
Thank you


Acala Token (ACA) formed bullish Gartley for upto 32.5% pumpHi dear friends, hope you are well and welcome to the new trade setup of Acala Token ( ACA ) with Bitcoin pair.
Previously we had a very nice trade of ACA:
Now on a 4-hr time frame, ACA has formed bullish Gartley pattern.
Note: Above idea is for educational purpose only. It is advised to diversify and strictly follow the stop loss, and don't get stuck with trade

Acala Token (ACA) formed bullish Shark for upto 18% moveHi dear friends, hope you are well and welcome to the new trade setup of Acala Token ( ACA ) with BTC pair.
On a 4-hr time frame chart, ACA has formed a bullish Shark pattern.

Acala Token (ACA) Extreme Wick Hits 175% In 2 DaysAcala Token (ACABTC) is removing all the resistance present on the way up... Today's candle upper wick/shadow is really strong printing a total of 175% growth since yesterday's low.
Closing above EMA10 (0.00003120) today can signal upcoming additional growth.
The dashed blue line on the chart is the immediate support.
Namaste.
