ACAUSDT Forming Descending ChannelACAUSDT is shaping up to be an exciting crypto pair to watch, as it is currently trading within a well-defined descending channel pattern. This technical setup is widely recognized by traders as a potential bullish reversal indicator once the price breaks out above the upper trendline. The consisten
Related pairs
Acala Hits Bottom, Which Means Bull Market Next (2800-3500% PP)Acala is now five weeks into the fire. If you read often you will understand clearly what I mean; if you are new, this might not make much sense.
The low happened 14-April here, ACAUSDT. Some weak action and then red. Five weeks red and the action remains relatively sideways, not much change in pri

ACAUSDT 1D Analysis ACA ~ 1D Analysis
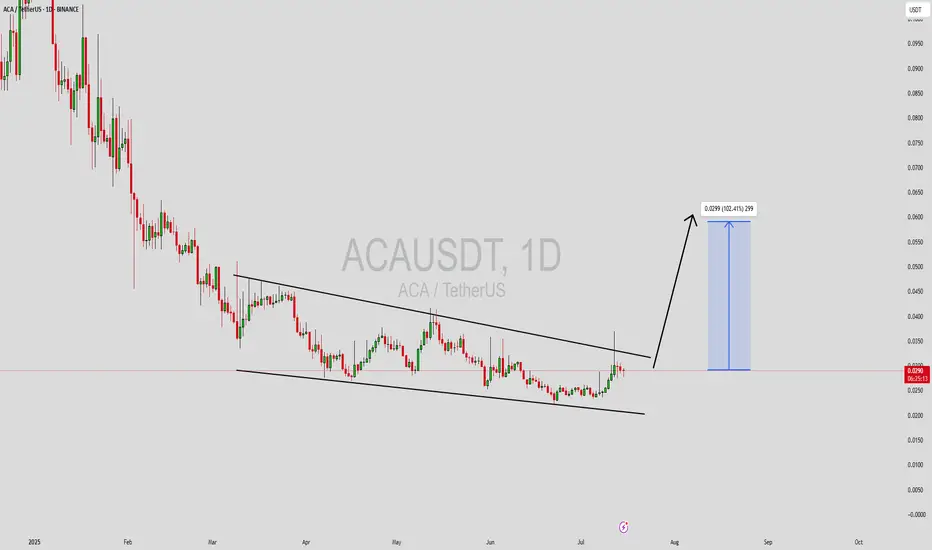
#ACA Buy back gradually from here with a short term target of at least 15%+ from here, and a long term target of $0.1

ACAUSDT 1D#ACA is trading inside a Descending Channel on the daily chart — a pattern that often leads to a bullish breakout.
If the price manages to break above the channel resistance and the daily EMA50, we could see upside momentum toward the following targets:
🎯 $0.0335
🎯 $0.0382
🎯 $0.0475
🎯 $0.0613
⚠️

ACAUSDT forming a falling WedgeACAUSDT is currently displaying a strong falling wedge pattern—a historically bullish reversal structure that typically precedes sharp breakouts. After a prolonged downtrend, the price has formed lower highs and lower lows within a narrowing channel, suggesting decreasing selling momentum. The recen

Acala Hits Bottom —Pre 2025 Bull Market Buy OpportunityLet's start with the long-term linear chart for perspective.
In this chart, we can see that the major decline ended in late 2022. All the action afterward is sideways.
Then we can notice the candles becoming ultra-small. This is the confirmation that the market is in a period of consolidation. At

ACAUSDT 5DACA ~ 5D Analysis
#ACA Buy back from here if you still have a Conviction on this coin with a minimum target of 20%+.

#ACA/USDT#ACA
The price is moving in a descending channel on the 1-hour frame and is adhering to it well and is heading to break it strongly upwards and retest it
We have a bounce from the lower limit of the descending channel, this support is at a price of 0.0340
We have a downtrend on the RSI indicator

ACAUSDT 5DACA ~ 5D Analysis
#ACA Re -visiting this lowest support.
Buy gradually from here if you still have a Conviction on this coin with a short -term target of at least 20%+.

ACAUSDT UPDATEACAUSDT is a cryptocurrency trading at $0.0430. Its target price is $0.0800, indicating a potential 80%+ gain. The pattern is a Bullish Falling Wedge, a reversal pattern signaling a trend change. This pattern suggests the downward trend may be ending. A breakout from the wedge could lead to a strong

See all ideas
Summarizing what the indicators are suggesting.
Oscillators
Neutral
SellBuy
Strong sellStrong buy
Strong sellSellNeutralBuyStrong buy
Oscillators
Neutral
SellBuy
Strong sellStrong buy
Strong sellSellNeutralBuyStrong buy
Summary
Neutral
SellBuy
Strong sellStrong buy
Strong sellSellNeutralBuyStrong buy
Summary
Neutral
SellBuy
Strong sellStrong buy
Strong sellSellNeutralBuyStrong buy
Summary
Neutral
SellBuy
Strong sellStrong buy
Strong sellSellNeutralBuyStrong buy
Moving Averages
Neutral
SellBuy
Strong sellStrong buy
Strong sellSellNeutralBuyStrong buy
Moving Averages
Neutral
SellBuy
Strong sellStrong buy
Strong sellSellNeutralBuyStrong buy
Displays a symbol's price movements over previous years to identify recurring trends.
Frequently Asked Questions
The current price of ACA / TetherUS (ACA) is 0.0274 USDT — it has risen 1.52% in the past 24 hours. Try placing this info into the context by checking out what coins are also gaining and losing at the moment and seeing ACA price chart.
ACA / TetherUS price has fallen by −11.30% over the last week, its month performance shows a 4.30% increase, and as for the last year, ACA / TetherUS has decreased by −51.68%. See more dynamics on ACA price chart.
Keep track of coins' changes with our Crypto Coins Heatmap.
Keep track of coins' changes with our Crypto Coins Heatmap.
ACA / TetherUS (ACA) reached its highest price on Jan 25, 2022 — it amounted to 2.8000 USDT. Find more insights on the ACA price chart.
See the list of crypto gainers and choose what best fits your strategy.
See the list of crypto gainers and choose what best fits your strategy.
ACA / TetherUS (ACA) reached the lowest price of 0.0221 USDT on Jun 22, 2025. View more ACA / TetherUS dynamics on the price chart.
See the list of crypto losers to find unexpected opportunities.
See the list of crypto losers to find unexpected opportunities.
The safest choice when buying ACA is to go to a well-known crypto exchange. Some of the popular names are Binance, Coinbase, Kraken. But you'll have to find a reliable broker and create an account first. You can trade ACA right from TradingView charts — just choose a broker and connect to your account.
Crypto markets are famous for their volatility, so one should study all the available stats before adding crypto assets to their portfolio. Very often it's technical analysis that comes in handy. We prepared technical ratings for ACA / TetherUS (ACA): today its technical analysis shows the sell signal, and according to the 1 week rating ACA shows the sell signal. And you'd better dig deeper and study 1 month rating too — it's sell. Find inspiration in ACA / TetherUS trading ideas and keep track of what's moving crypto markets with our crypto news feed.
ACA / TetherUS (ACA) is just as reliable as any other crypto asset — this corner of the world market is highly volatile. Today, for instance, ACA / TetherUS is estimated as 3.00% volatile. The only thing it means is that you must prepare and examine all available information before making a decision. And if you're not sure about ACA / TetherUS, you can find more inspiration in our curated watchlists.
You can discuss ACA / TetherUS (ACA) with other users in our public chats, Minds or in the comments to Ideas.