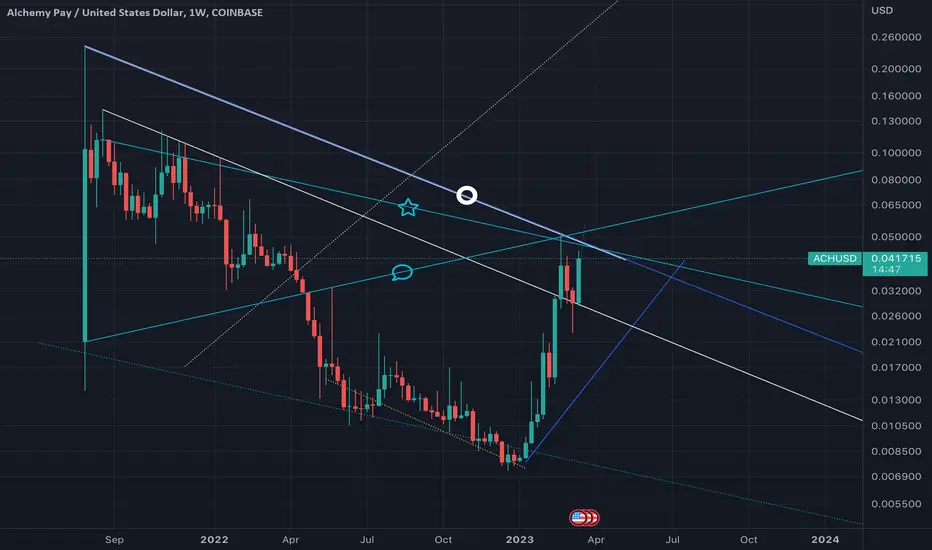
Alxhemy Pay Bearish
Bearish
False Breakout was Bulltrap
SHIB ecosystem is decentralized, Lucie claims
In a tweet published earlier this week, Lucie suggested a reason that might stand behind the recent spree of BONE listings. She believes that exchanges want the token on for their clients because "there is no leading entity behind it." Also, it does not have a CEO or a head office. The developer team spearheaded by the pseudonymous Shytoshi Kusama, which also created SHIB and LEASH and are working on Shibarium and the SHIB metaverse now, will eventually step down, Lucie claims.
She insists that the whole Shiba Inu ecosystem is being created to function as "a fully decentralized ecosystem and no one will ever be in charge." According to her, it will be the SHIB army that will "lead and make the most important decisions."
TSXV:BONE got listed three times this week. Do you know why?This is because it is known that there is no leading entity behind it.There is no CEO or office and the developers are building it but will eventually step away, just like everyone else. The entire Shiba Ecosystem is…
ACHUSD trade ideas

$ACH to return to neckline for support bounceYesterday I covered Head & Shoulders TOPS. Today Studying INV H&S Bottoms!As I was trying to fit the pattern into FWB:ACH I came up with this chart, lets see if it completes as predicted. Pay attention to the Volume profile

ACH April Update #2ACH April Update #2
Log Chart
1D Daily Chart
- Yellow Channel has been going on for months.
- Clear the current resistance and send it to the top of the channel.
- Top of the channel also lining up with the current weekly resistance area :)

ACH April UpdateACH/USD April Update
Log Chart
Weekly Chart
- consistently putting higher highs and higher lows
- Clear the big highs and blast towards the next resistance levels ranging from 0.058 - 0.065

ACH Reversal TriangleI think ACH has formed a reversal triangle on the week view. The measured move takes us roughly right back to the trend line where it found support in December. I think the price will end up between .007 and .005. Keep in mind it won't be one candle straight down to that area. This will take time, potentially months to get down there, but that is where I will be looking to buy.

ach / usd weekly linearach / usd weekly linear
standard view
Trendline view
1. Dark Blue Line with Gear: Highest points trend line about to break. will be bullish and will indicate a new local high
2. Blue Line with Chat Box: About to break. Break above and it is also bullish
Linear and Weekly Trendlines lining up. Some are valid statements on both views. There should be heavy resistance around .5-.6
I think log view has more respect, but can't ever ignore the linear views, especially when they are lining up with the log

ach / usd weeklyach / usd weekly chart
Logarithmic View
Trend lines opinions
1. White Line with White Circle: Highest points possible on chart being connected. Any type of break upward the white trend line will likely result in more highs.
2. Blue Line with Blue Star: Highest points possible for Closed Candles on the weekly chart. A weekly CLOSE above will indicate more highs.
3. Blue Line with Blue Chat: Connecting three points on the weekly time frame that are showing high points of confluence. Break above this and retest will be extremely bullish.
ACH still has bullish tendenciesWhen the market takes a breath, it's important to remember that it's a natural part of its cycle and to exercise patience instead of making impulsive decisions. Rushing to take action during a temporary lull in the market can result in missed opportunities or even losses, so waiting it out can often be the best course of action.
ACH had an impressive run and we captured over 500% on this at the peak when we closed everything out completely. Personally, I have bouht back my last sell which I intended to be my "moon bag" (it was 20% of my original position) and I was able to gain 20% holdings with that accumulation. Now we're in a waiting stage.
Lets focus on a couple things - first Elliott Wave Theory. Elliott Wave Theory is highly subjective as it relies on the interpretation of wave patterns and can vary greatly between analysts. This subjectivity can lead to differing opinions and potential inconsistencies in applying the theory to trading decisions.
From the lows to where we are, I don't see a completed impulse, which means I think we're in a wave 3 on a larger degree still. This would indicate that we could still move down to 0.027 before moving higher, but ultimately a move to 0.068 seems quite likely and I would expect further resistance there.
Now, lets talk about the wave master. The green wave is almost completely reset on the daily and unless it takes out 0.014, it's making serious hidden bullish divergence (lower low on indicator compared to much higher low on the price action. This would indicate that there's a big move coming. Red and white wave, while still in their infancy, are looking really good, too.
It's important to practice patience when investing and wait for the market to complete its cycle instead of trying to time the market. Additionally, avoiding greed and focusing on long-term gains can help you avoid making impulsive decisions that may lead to losses. Such as if you decided to start buying this at 4 cents or higher. You'd be sweating now, more than likely.

Bearish indicators for 1H chartLooking at the ACH coin after the recent 30% in one day gain. Bearish indicators for the one hour chart after initial price drive is dried up.

ACH is a monster! Are we done for now?CLEAR THE WAY... well, that time is over.
We are now approaching significant resistance. Right now ACH is holding pretty well up here, but a pullback to 0.034 or potentially 0.027 is on the cards right now.
Something is going to happen to crypto in the next 2-3 weeks and it currently doesn't look all that great. Take the plays that you've made a significant bit on and move it to cash unless it's in a position where you can place a reasonable stop and not lose money.
I've changed my count a bit. Check it out.

Clear the way for ACHI'd like to give a little update on our friend ACH. From the lows, we can see there are several spikes in price action. It started in late December 2022 where there were two quick spikes when price discovery was near the lows.
Then things got really interesting. Here's what I love about crypto and alts in particular, the spikes that you typically see are followed by more sell offs. Take a look at October 14 for example. We can see a big spike that lasted roughly a day and it was followed by a sell off that led to new lows in early November.
So far that is not the case for ACH. Now certainly the market can take a downturn at any time and it probably will. I'll update the count as the price action evolves, but as of right now, we've gotten above some significant resistance, including that resistance from October 14 2022.
Additionally, we saw similar spikes on January 16 2023 but the difference this time is it did not lead to new lows. It actually led to another local high and then, as I previously mentioned, taking out the important resistance from October, which we are still above.
If this EWT count is intact, we should see a further pullback to at least 0.0166 before moving higher into at least 0.027 but more likely we will reach 0.031.
As with anything related to technical analysis, things can and do change often. I'll keep track of this count here on TradingView for my followers that are interested. There will be several trading opportunities coming down the road if you are not an ACH holder.
Is this the best place to enter? I'd say no. There are better places to find a well risk managed entry so be patient and wait for BTC to correct a little bit.

Can ACH keep going?Watching ACH and have been for weeks. Here's my primary observation right now.
We've had several areas that acted as support on the way down that broke.
Ever since January 14, we've been breaking those support levels which were acting like resistance and we keep flipping them. Until some important support levels get taken out, I'm going to remain bullish.
Disclaimer - I purchased ACH below 0.01 - it was closer to 0.008 and I locked in profit as you should as soon as it hit 100%. Now the trade is 230% but that shouldn't be a reason for you to fomo. Watch for good retests of levels (outlined in the chart) for a potential entry.
Crypto will get a pullback eventually. Don't go heavy into positions like this one now. That time has come and gone.


ACHUSD: Pullback To Form Potential Inverse Head and ShouldersACHUSD has some Bearish Divergence on th RSI at the list price and the 200SMA and looks like it could be setting up for a Pullback. If it pulls back we should look at the potential for it to form a Right Shoulder that could lead to a bullish breakout on a later date.

$ACH is looking good! $ACH is looking to pop! This Real-world use of collateral coin is being trusted by VISA already. It's only a matter of time where merchants will be accepting crypto and they need a retail collateral token and ACH looks like a great candidate. Im in long-term LONG on this one.


Halfway to the resistance line. 🚀Looking good for a huge breakout. Bottom of the markets are always scary for most people.
I like the volitility because you can usually 10x your main holdings before the actual bullrun begins.
Let's complete this pattern before Friday. 🚀📈📈📈

50% Profit - $ACHThe best thing about this purchase was that I woke up in time to sell, that I didn't put a TP or a SL, if I had, my SL would have been executed and I would have -3%.
Sometimes something good comes out of the mistakes we make.
Control your own risk.
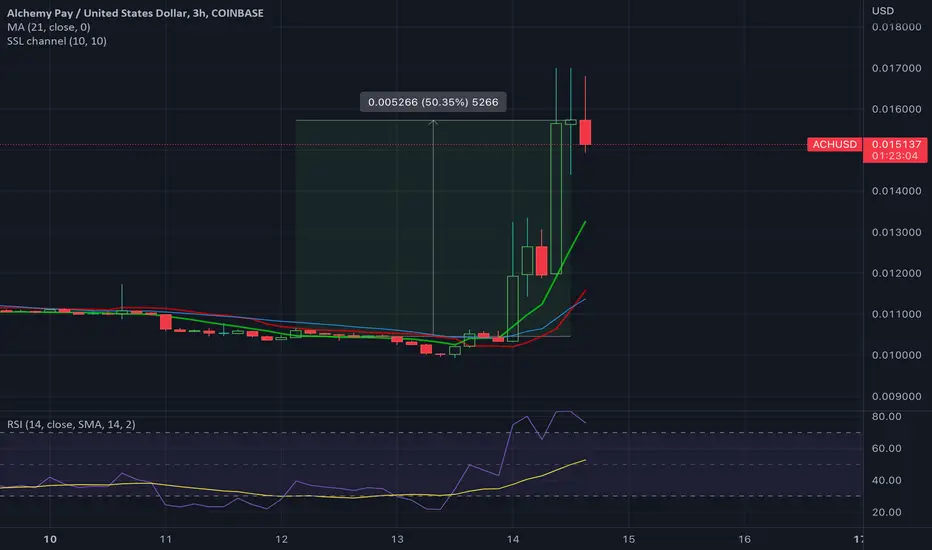
$ACH about to take off?First let's talk about $ACH, what it is, and what it works for...
Alchemy Pay is a gateway payment provider for transacting between fiat and cryptocurrency, is a payment solutions provider that seamlessly connects fiat and crypto economies for global consumers, merchants, developers, and institutions. It provides online and offline merchants with convenient acceptance of both fiat and crypto and makes crypto services and platforms accessible to mainstream users.
Now... The reason why this idea arises is because on the weekly chart the MA21 finally crossed a bullish candlestick, this is the first time this has happened, let's remember that in most cases (and after a more complete analysis) when the MA21 or 14 crosses below the candles it is the start of a new uptrend, regularly when this happens on a 4hr chart or less it is a signal to wait between 5% and 10% when it happens on a chart daily this can indicate between 10% to 25%, and on a weekly chart above 25%, however, as I mentioned this is the first time it has happened, it is a relatively young project.
The SSLChannel; It is the second time since the beginning of the project that it shows an up trend, let us remember that this happens when the green line crosses the red line upwards and the red line is now positioned below in an up trend. This is the opposite with a downtrend.
The RSI; From May to July it was oversold, and days later the SMA14 crossed and positioned below the RSI, and in September, the RSI went back into oversold and until October 3 a new trend was set, and the SMA14 crossed back below the RSI.
Chart Patterns; Just before the last candle I see a Morning Star, I also see a small accumulation and market indecision in 5 candles from June to July, Falling Wedge, a clear Support between June and early October and a Bullish Engulfing.
So let's see what happens in the next few weeks.
Control your own risk.
This is not an advertisement or a buy signal.

5% profit in $ACH executed Just as i said yesterday.
Always put SL and TP, whales will always want to take your money no matter how little it seems
Control your own risk

Buying $ACHTrading Volume 24h
$4,975,775.88 +1.84%
MA21 crossing below candles
SMA14 crossing RSI
Minimum 5% profit expected - SL at -3%

$ACH easy 15% profitJust the RSI for a good profit.
My goal is not to give you buying signals, it is to help you understand how to identify the signals

Possible ACH Long. Break out of wedge ..my first target would be 0.03 range . Slightly less . Black swan candle to the upside target .. between 0.05 - 0.07. Break down at wedge resistance negates long at this time. Likely new lows at that point. FPM. DONT FOLLOW ME.. YOUR LIKELY TO GO BROKE. FEETY PAJAMA MIKE.. = SQUASHER OF DREAMS , DESTROYER OF FINANCIAL ACOUNTS.
