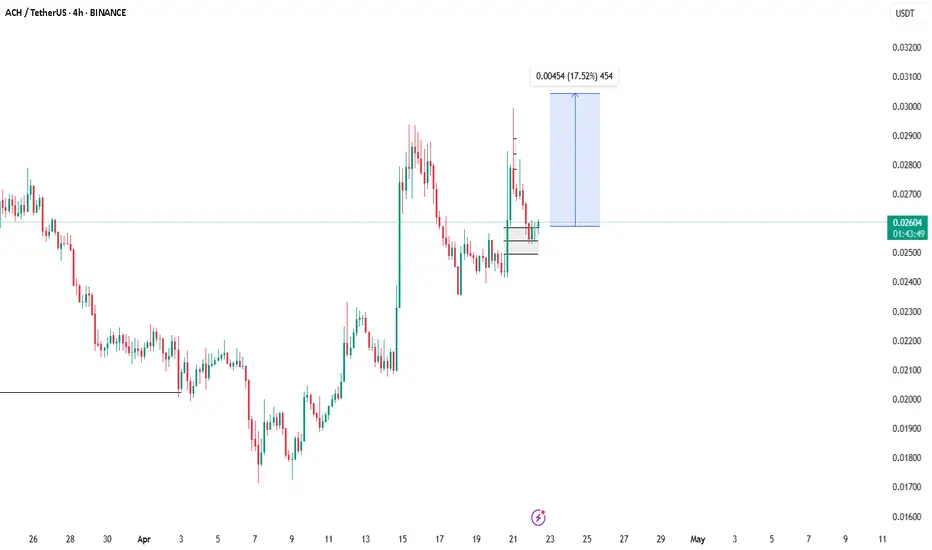
ACHUSDTHello everyone. This is purely my vision in connection with the resignation of the head of the Federal Reserve, Jerome Powell. The lending rate will be reduced and this will cause a reaction in the markets. I consider this seller's block as the first stopping point.

ACH/USDT at a Historical Pivot Zone — Is a Major Reversal🔍 In-Depth Weekly Chart Analysis of ACH/USDT
ACH/USDT is currently retesting a critical historical demand zone between $0.01876 – $0.02263, which has consistently acted as a major accumulation area since late 2022. This zone has served as the launchpad for multiple bullish moves in the past and is

#ACH/USDT#ACH
The price is moving within a descending channel on the 1-hour frame and is expected to break and continue upward.
We have a trend to stabilize above the 100 moving average once again.
We have a downtrend on the RSI indicator, which supports the upward move by breaking it upward.
We have a s

ACHUSDT 1W AnalysisACH ~ 1W Analysis
#ACH This trade is very high risk. Buy from here if you still have confidence in this coin with a short term target of 20%+.

Achusdt big short to $0.0186Achusdt big short
Roughly 5 RR
Stop: $0.020840 area
TP: $0.0186 area
DTT edge applied.

ACH at support zoneSuccessfully breakout this resistant line with a short -term target of at least +10%

ACH Update!Hello Traders, 👋
I hope you're all doing well!
Here’s a quick update on ACH on the weekly timeframe 🕒:
ACH is currently forming an ascending triangle, a bullish pattern that often leads to a breakout once price clears the resistance trendline. On higher timeframes, this setup tends to perform wel

Alchemy Pay - May 2025Let’s see how this turns out.
This is not investment advice. Always do your own research!

ACHUSDT ShortThe ACHUSDT ticker has sharply deviated from both the 4-hour and daily EMA50 levels without undergoing a retest. I anticipate a price correction towards these EMAs within the next few days. Targets are marked on the chart.

See all ideas
Displays a symbol's price movements over previous years to identify recurring trends.