Achusdt big short to $0.0186Achusdt big short
Roughly 5 RR
Stop: $0.020840 area
TP: $0.0186 area
DTT edge applied.
ACHUSDT trade ideas

ACH at support zoneSuccessfully breakout this resistant line with a short -term target of at least +10%

ACH Update!Hello Traders, 👋
I hope you're all doing well!
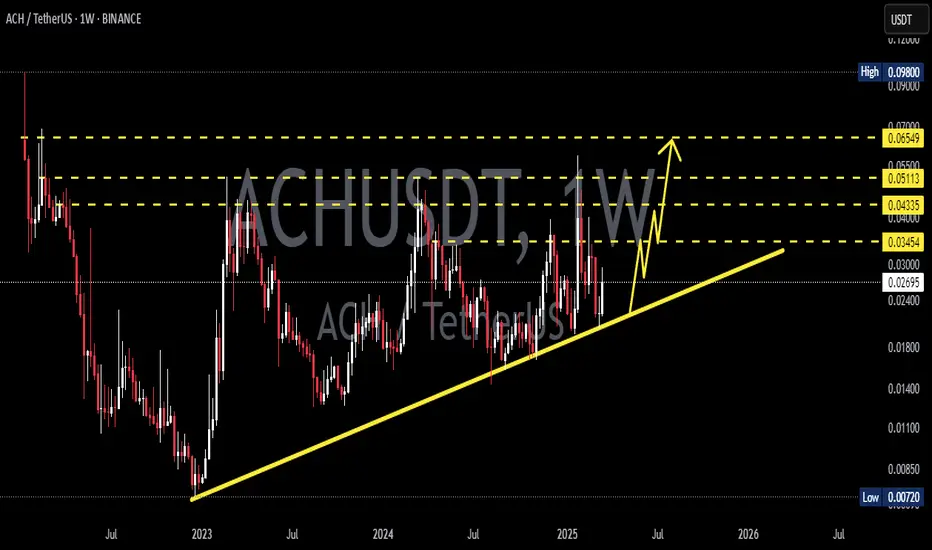
Here’s a quick update on ACH on the weekly timeframe 🕒:
ACH is currently forming an ascending triangle, a bullish pattern that often leads to a breakout once price clears the resistance trendline. On higher timeframes, this setup tends to perform well — and if it plays out, we could see up to a 60% gain as it approaches the resistance level 📈.
🔹 Trading Strategy:
~ Entry: CMP or $0.021
~Type: Spot or 2–3x leverage
~ Holding Period: Until end of June 2025
📝 Note: Always do your own research and analysis before investing.
Best regards,
Dexter ✌️

Alchemy Pay - May 2025Let’s see how this turns out.
This is not investment advice. Always do your own research!

ACHUSDT ShortThe ACHUSDT ticker has sharply deviated from both the 4-hour and daily EMA50 levels without undergoing a retest. I anticipate a price correction towards these EMAs within the next few days. Targets are marked on the chart.

Alchemy Pay - April 2025Potential Bull Flag for ACH. Watch carefully. This chart is not investment advice. Always do your own research!

ACH/USDT Analysis – Joining the Long SideWe are considering a continuation of the long position on this coin through two scenarios:
a false breakout below the $0.02664 level,
or a test and reaction from the volume zone at $0.025–$0.024.

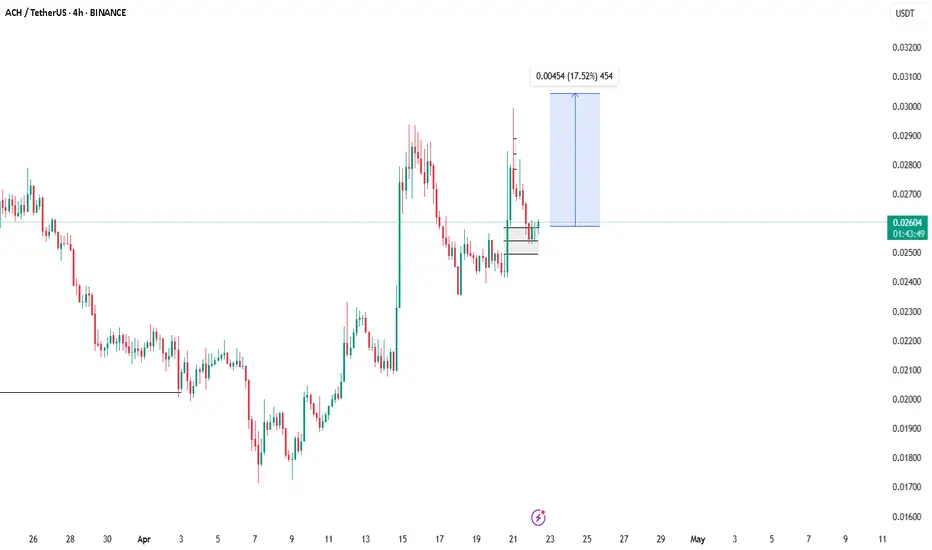
ACH/USDT - Potential Bounce Incoming 30%+ Gains PossibleI'm analyzing the ACH/USDT 4-hour chart and spotting signs of a potential rebound. Here’s what I’m seeing:
✅ Support Zone: Price is testing a key support level around $0.02119, which has held strong in the past. The market appears to be accumulating in this area.
✅ EMA Crossovers: The chart shows a bearish crossover between the 12 EMA and 20 EMA, but watch for a bullish reversal as price approaches this support. Potential for a rebound if the EMAs cross back to the upside.
✅ Volume Delta Analysis: There's a notable increase in volume with a Delta Volume of 28.42%, indicating heightened interest at these levels.
✅ Reversal Probability: The chart shows an impressive 85.6% reversal probability, suggesting a strong chance of a bullish move soon.
✅ Targets: Looking for a potential 30%+ bounce towards key resistance levels at $0.02559, $0.02657, and $0.02845.
📉 Risk Management: Setting a stop loss slightly below the $0.02119 support level to minimize risk in case of further downside.
📈 If support holds and momentum shifts, a strong move upward could follow. Stay vigilant!
🚨 Not financial advice. Always do your own research.

Long Entry Signal for ACH/USDT - Bullish Setup (Daily Chart)
Symbol:
Timeframe: Daily
Analysis:
MLR > SMA: The MLR (blue) is above the SMA (pink), signaling a bullish trend.
MLR > BB Center: MLR exceeds the Bollinger Bands Center Line (orange), showing strong bullish momentum.
PSAR: PSAR dots (black) are below the price, reinforcing the uptrend.
Price > SMA 200: Price is above the 200-period SMA (red), indicating long-term bullish strength.
Trade Idea:
Entry: Consider a long position at the daily close.
Stop Loss: Place SL at the current PSAR level to limit downside risk.
Follow Me: Follow me for exit or profit-taking opportunities.
Outlook: All indicators align for a bullish move. Stay alert for reversal signals or trend shifts.
Risk Warning: Not financial advice, trade at your own risk

ACHUSDT (1H) - Technical Analysis & Trade Setup📌 Market Overview:
The price is currently at 0.02783, forming a range-bound consolidation after an initial bullish move.
A potential breakout setup is visible, with an entry at the current market price (CMP).
The risk-to-reward ratio suggests a bullish trade setup with defined stop-loss and take-profit levels.
📈 Trade Plan: Long Position (BUY Setup)
🎯 Entry: At Current Market Price (CMP) ~0.02783
🎯 Take Profit Targets:
First Target (Resistance Level): 0.03155
🔻 Stop-Loss:
Below 0.02675, as a drop below this level could trigger further downside.
🔴 Bearish Scenario (Trade Invalidation)
If price fails to hold above 0.02700, a breakdown could lead to further downside.
A drop below 0.02675 may invalidate the bullish setup.

ACHUSDT 1WACH ~ 1W Analysis
#ACH This coin is still in a bullish trend. Buy when re -testing this support with a short -term target of at least 15%+.
Bearish opportunity in ACH1. We want price to at least head to the order blck meanthreshold
2. We have structure shift in H1
2. We have turtlesoup confirming liquidity grab
4. We are at H1 Orderblocks
ALTERNATIVE SCENARIO;
We have very clean buyside in 0.024228 and 0.024228 That pose a risk to downside orderflow

Ach longNice wedge formation .
Short term pump towards 4 cents region.
We should consider that btc can still go lower and drag alts a little bit more to the downside but , this position is for leverage , if u want spot buys i think now is the right time buy alts .

Alchemy Pay - March 2025A possible descending wedge for the short term. The price is in a good zone.
This chart is not investment advice. Always do your own research!

IS ACH A DEAL?When you look at the chart, this crypto is hit or miss. I used to enjoy the spikes, but as time has passed, I would like to see ACH mature in its growth. With all of ACH's recent news, you would expect the moves to start lasting longer, and in a way it has. I will call these growing pains, but with all that being said, ACH has broken through the .786 on the fib and is approaching its channel bottom. We could see a nice move up, given that March going into April is ordinarily decent for crypto. It seems we are all waiting for our Alt season to take off so we can take our profits. I'm bullish only because everyone is bearish with FUD. I look forward to the day when ACH surpasses its .20 and reaches a new ATH.
ACH on the Hourly is oversold, which is one of the big keys to trading this crypto. You need to look for your timing, and know when it spikes, to take profits. ACH will boom again really soon, so hang on!

Bullish Opportunity in ACH 1. We have price reacting off the parent model 22
2. We have price reacting off the H4 OB Wick
3. We have equal highs and Buyside to attack

Long Signal Entry for ACH/USDT
Based on the daily chart for ACHUSDT on Bybit, here's a concise analysis:
MLR vs. SMA: The MLR (blue) is above the SMA (pink), indicating a bullish trend.
MLR vs. BB Center: The MLR is above the BB Center Line (orange), suggesting bullish momentum.
PSAR: The PSAR dots (black) are under the price, confirming a bullish trend.
Price vs. SMA 200: The price is above the 200-period SMA (red), supporting a long-term bullish trend.
Current Strategy: Since all entry conditions for a long position are met (MLR above SMA, MLR above BB Center, PSAR under price, price above SMA 200), you might consider entering a long position. You can enter now or wait for the close of the day, depending on your availability. Waiting for the close of the day would be preferred to confirm the trend.
Stop Loss (SL): Set the stop loss at the current level of the PSAR dots to manage risk.
Monitor My Idea: Keep monitoring my idea for any changes in trend or potential profit-taking opportunities.

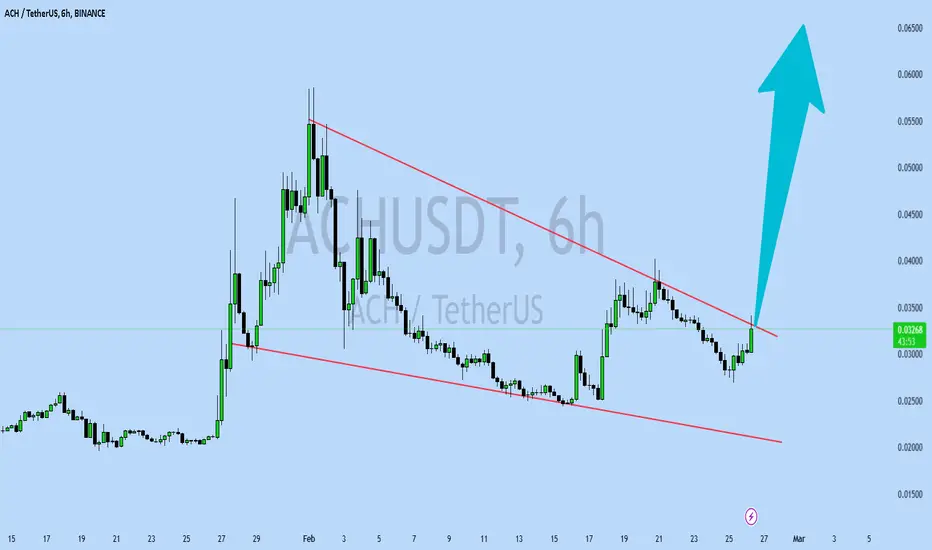
ACHUSDT UPDATEACHUSDT is a cryptocurrency trading at $0.03285. Its target price is $0.06500, indicating a potential 90%+ gain. The pattern is a Bullish Falling Wedge, a reversal pattern signaling a trend change. This pattern suggests the downward trend may be ending. A breakout from the wedge could lead to a strong upward move. The Bullish Falling Wedge is a positive signal, indicating a potential price surge. Investors are optimistic about ACHUSDT's future performance. The current price may be a buying opportunity. Reaching the target price would result in significant returns. ACHUSDT is poised for a potential breakout and substantial gains.
ACH/USDTKey Level Zone: 0.035300 - 0.036000
HMT v6 detected. The setup looks promising, supported by a previous upward/downward trend with increasing volume and momentum, presenting an excellent reward-to-risk opportunity.
HMT (High Momentum Trending):
HMT is based on trend, momentum, volume, and market structure across multiple timeframes. It highlights setups with strong potential for upward movement and higher rewards.
Whenever I spot a signal for my own trading, I’ll share it. Please note that conducting a comprehensive analysis on a single timeframe chart can be quite challenging and sometimes confusing. I appreciate your understanding of the effort involved.
Important Note :
Role of Key Levels:
- These zones are critical for analyzing price trends. If the key level zone holds, the price may continue trending in the expected direction. However, momentum may increase or decrease based on subsequent patterns.
- Breakouts: If the key level zone breaks, it signals a stop-out. For reversal traders, this presents an opportunity to consider switching direction, as the price often retests these zones, which may act as strong support-turned-resistance (or vice versa).
My Trading Rules
Risk Management
- Maximum risk per trade: 2.5%.
- Leverage: 5x.
Exit Strategy
Profit-Taking:
- Sell at least 70% on the 3rd wave up (LTF Wave 5).
- Typically, sell 50% during a high-volume spike.
- Adjust stop-loss to breakeven once the trade achieves a 1.5:1 reward-to-risk ratio.
- If the market shows signs of losing momentum or divergence, ill will exit at breakeven.
The market is highly dynamic and constantly changing. HMT signals and target profit (TP) levels are based on the current price and movement, but market conditions can shift instantly, so it is crucial to remain adaptable and follow the market's movement.
If you find this signal/analysis meaningful, kindly like and share it.
Thank you for your support~
Sharing this with love!
HMT v2.0:
- Major update to the Momentum indicator
- Reduced false signals from inaccurate momentum detection
- New screener with improved accuracy and fewer signals
HMT v3.0:
- Added liquidity factor to enhance trend continuation
- Improved potential for momentum-based plays
- Increased winning probability by reducing entries during peaks
HMT v3.1:
- Enhanced entry confirmation for improved reward-to-risk ratios
HMT v4.0:
- Incorporated buying and selling pressure in lower timeframes to enhance the probability of trending moves while optimizing entry timing and scaling
HMT v4.1:
- Enhanced take-profit (TP) target by incorporating market structure analysis
HMT v5 :
Date: 23/01/2025
- Refined wave analysis for trending conditions
- Incorporated lower timeframe (LTF) momentum to strengthen trend reliability
- Re-aligned and re-balanced entry conditions for improved accuracy
HMT v6 :
Date : 15/02/2025
- Integrated strong accumulation activity into in-depth wave analysis

ACH/USDT H-1 – Bearish Reversal Setup & Trade PlanACH/USDT) is currently showing signs of a potential bearish reversal after forming a double top near the resistance zone. Additionally, the RSI divergence suggests weakening bullish momentum, increasing the probability of a downward move.
Trade Setup:
📌 Entry Price: 0.03367 (Below neckline support)
📌 Stop Loss: 0.03753 (Above resistance to avoid stop hunts)
📌 Take Profit 1: 0.02981
📌 Take Profit 2: 0.02589
Technical Outlook:
🔹 Double Top Formation: A clear bearish pattern, signaling a potential trend reversal.
🔹 RSI Divergence: Momentum is weakening, suggesting a shift from buyers to sellers.
🔹 Breakdown Potential: If the price breaks below the neckline, further downside movement is expected.
📊 Strategy:
Traders should watch for a confirmed breakdown below the neckline before entering short positions. If rejection occurs and the price moves back above resistance, reconsideration may be needed.
💡 Trade Wisely & Manage Risk Effectively! 🚀

ACHUSDT(AlchemyPay) Updated till 18-02-25ACHUSDT(AlchemyPay) Daily timeframe range. last pump fully retraced now its trying to push back for recovery. confirm close above 0.03076 can send it to 0.04700 if volume keeps up. local support at 0.01999.

Alchemypay/USDT clean pull back very Bullish in my opinion on this stage in long term movement of ach and more importantly fact that fantastic team and developers of this coin i think good jumping will be able to happen and i thimk good strategic plan from ceo and team in good chart point with good time ⌚
if if if market be able to keep strong enough alchemy will explode
