ACHUSDT trade ideas

$ACH technically sound for upsideLittle birdie said ACH is a buy, upon checking it we see a nice double bottom break and retest (marked by green line) which tells us the retracement is done and is aiming for $0.06. We're going to pick some low hanging fruit and profit at $0.03 and $0.05.

Achusdt Buy opportunityACHUSDT is currently demonstrating a potential Adam and Eve formation, a notable bullish reversal pattern, with the price in the process of establishing the Eve component, characterized by an ascending series.
The analysis includes a critical resistance level; a breach of this level should prompt a strategic entry on the pullback, aligning with our bullish thesis.
Additionally, a designated buy-back zone has been established to capitalize on potential market entry opportunities, with a stop-loss positioned beneath the anticipated bottom of the Eve formation.
The objective target of this setup is explicitly marked on the chart.
We invite and appreciate your engagement with our analysis.
Thank you for your contributions.

ACH/USDTWarning Technical analysis is not financial advice
BINANCE:ACHUSDT give my trading system sign of strength
1-taken previous weekly low This is the fuel point to move
2- range has been deviation
3- successful auction after ranging and previous weekly low
4- retest to volume profile value area high
5- the liquidity is resting on the opposite side
-current year mid as a liquidity must be taken like a magnet
- previous monthly high a liquidity target
➖
📈COIN : BINANCE:ACHUSDT
CEX. : BINANCE - SPOT
➖
ENTRY : 0.01972
➖
TARGETS :
T1 : 0.02196 (1/1R)
T2 : 0.03092
T3 : 0.03784
Long term T4
➖
STOP : 0.01748
➖
💡HINTS:
1️⃣ • Sell (25% to 50%) on (T1) and don't move your stop lose
2️⃣ • Sell 50% on (T2) and move ur stop lose to entry point
3️⃣ • You are safe now and the next 25% up to you
4️⃣ • Very important: stop lose = jump from ship and keep alive
5️⃣ • Stop is activated When a one candle closes below the stop level of the same time frame of the signal

Big move incoming Holding very important support that failed to do so since more than 2 years ago.
2-5x

ACH: Perfect EntryACH is a strong fundamental-backed project with undervalued pricing. When we look at the coins currently in the top 100, we can see how crappy and unsuccessful projects have reached huge market capitalizations. Alchemy bridges the gap between crypto and fiat, making adoption much easier.
While the short-term target is $0.02, the long-term goal is $0.1.
Buy and HODL for the rest of the cycle.


ACHUSDT.PACHUSDT.P is in bullish trend.
Bearish divergence shown in RSI.
Rising wedge reversal pattern also form which is confirming that the trend will be reverse from this level.
we further confirm before entring the trade if this will break the wedge pattern and also break the last HL then we will enter into the trade.

ACH ANALYSIS (1D)We have a FLIP supply range on the chart.
We are expected to move towards the specified targets from this range.
From the point of view of the wave count, it seems that we are in the cream of wave C of this diametric, which is marked on the chart. To complete the diametric wave D, we seem to move down.
Closing a daily candle above the SWAP range will invalidate the analysis
For risk management, please don't forget stop loss and capital management
When we reach the first target, save some profit and then change the stop to entry
Comment if you have any questions
Thank You

ACH On the way to pumpI see a good setup on ACH. Classic setup we have seen lot of times together, i expect a small dump, retest of trendline and pump.

ACHUSDT.P 6 Hour t/f possible greedy longWatching for a possible bounce on a test of the lower falling wedge trend line with confluence to the .786 fibs level , fib was taken from last previous leg up , watch for liquidity

AHCUSDT So Bitcoin’s dominance is falling and funds are flowing into altcoins. This is one of the good buying options in the sweet zone.
Working on targets: 1) Bullish wedge. 2) Wulf waves

my 3rd ever drawing and this time it's a drawing on ACHwhat are your thoughts on the ACH? it's either gonna go up to $0.023 or go down back to $0.012

Alchemy Pay (ACH)On the above 4-day chart price action has corrected over 90% since the sell signal in August 2021 (not shown). Now is a good opportunity to go long. Why?
1) A strong buy signal prints. (not shown).
2) Price action resistance breakout.
3) Strong positive divergence between price action and multiple oscillators. This divergence occurs over a 80 day period.
Is it possible price action could fall further? Sure.
Is it probable? No.
Ww
Type: trade
Risk: <=6% of portfolio
Timeframe: Don’t know.
Return: Don’t know.

Diamond bottom: ACHIt seems that a diamond bottom pattern is forming on ACH, suggesting the potential for an upward price movement.

ACHUSD: Bullish Consolidation Above Support LineBack in October ACHUSDT confirmed a Double Bottom at the PCZ of a Bullish Gartley and has since climbed back above the major Support/Resistance Zone represented by the green horizontal line as well as the 200 SMA and 55EMA and has formed a Channel of Ascending Consolidation.
In addition, it is doing this while trading to the right of a previously Bearish Trend line, so if we can get some true follow through from this action, I would be looking for a 50%, 61.8%, and 0.886% retrace target.

ACHUSDT- Projecting a 60% Rise Amidst Bullish SignalsACHUSDT continues its movement within the ascending channel, showing consistent respect for each demand zone that previously acted as supply areas. These strong bullish indications affirm the uptrend, significantly boosting the probability of further price escalation.
Expectations lean towards ACH rising to the top of the extended ascending channel, aligning with the 241.4% Fibonacci retracement level. This could potentially result in an exciting 60% rise in the coming weeks.


ACH $ACH Moving higher to hit supply zoneLooks like it wants to reclaim 0.03 where it will find supply and resistance. It's operating and following on a W wave pattern so expecting it to go higher in the short to medium term.
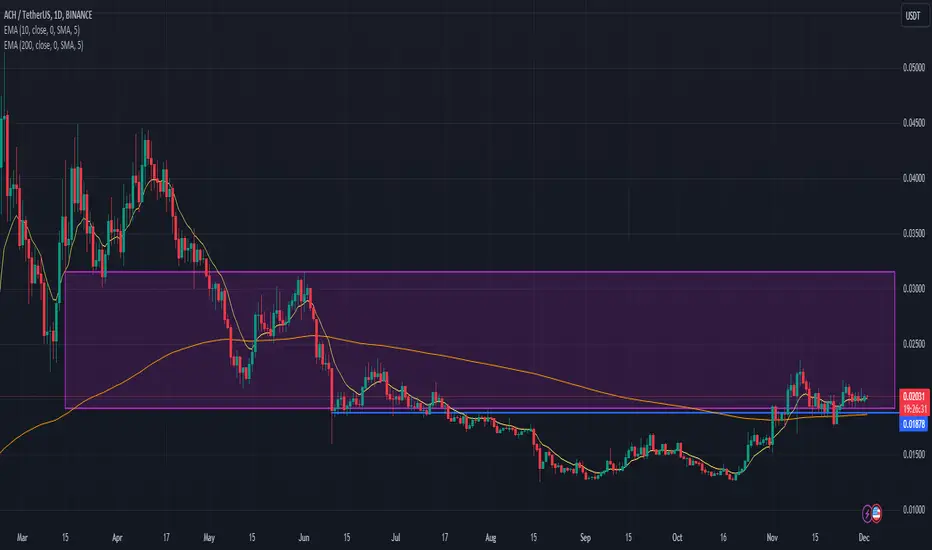
ACH#ACH/USDT
One of the easiest charts
We can see that 0.01779$ price zone was a resistant zone for long period of time
Currently we see the breakout and retest of 0.01779$
Some accumulation above 0.01779$ will be positive for the continuation of the bullish trend towards to 1st strong resistance. - 0.02779$
Where important to see the breakout. If it does - then next stop is at around 0.04062$
Bullish trend invalidates if the coin comes back to 0.01779$ and closes H4, H6, D candles below.

ACH Short TradeShorting ACH´s failed breakout in the 1H timeframe.
Strong volume on the failure and RSI divergence support this trade idea.
All levels are on the chart.

#ACH/USDT is holding Diagonal Trendline as a support in 4-Hour T#ACH/USDT is holding Diagonal Trendline as a support in 4-Hour TF!
FWB:ACH is holding PDL as a support. The major resistance level is PWH $0.216. Wait for BO to open a long position.

✴️ Alchemy Pay | Multiple Bullish Signals (260% Growth Target) A combination of bullish signals are all pointing towards a strong price jump for Alchemy Pay (ACHUSDT).
Bullish signals
➖ Higher low (mapped on the chart)
➖ Double bottom (short-term)
➖ Rising volume.
➖ Four green sessions.
➖ Current session trading above EMA50.
➖ Falling wedge pattern breaks bullish.
➖ Strong RSI.
👉 We have a 75% and a 260% target for the coming weeks.
You can define your own risk.
Remember to have a strategy before trading for maximum success.
Thank you for reading.
Namaste.
