EURO50 trade ideas

Euro Stoxx 50 - bullishIs this a possible count for this index? So many possible permutations that these markets can take at the moment but they seem to keep going up.....


STOXX 50, Flag-Formation Forming, Here Is What To Consider Now! Hello Traders Investors And Community, welcome to this analysis where we are looking at the EURO STOXX 50 INDEX, its recent events, the current formational structure, what to anticipate the next times, and how to handle the upcoming situation. Major global markets have recovered from the huge corona-breakdowns seen this year but the big question now is if this recovery is sustainable as there are still big divergences between the real economy and the stock market, therefore it is important to note that the bear market is still not confirmedly over yet and that increase in corona rumors can lead to increase of bearishness in the long-run, as the S&P is near its all-time-high-conditions where the next times will be crucial and will prove if new highs in the major indices can establish sustainably or bearishness settles again, so is also STOXX 50 forming a bullish formation in the short-term which can lead it to test crucial higher levels.
When looking at my chart you can watch there that the index is trading in this huge possible bull-flag-formation which is marked in blue where it already several times confirmed the upper and lower boundary, as such a formation is normally bullish it can confirm as those when it happens properly, therefore, it is from high importance to not only hold the lower boundary of the flag sustainable but also the 40-EMA marked in red and the 300-EMA marked in black to form an EMA-bounce here before it can move on to confirm the flag when this doesn't happen and the index fails at the EMA-structure and the lower boundary to fall below it this will cause bearish pressure where lower levels will be reached within the high possible spectrum. Currently, the wave D and E can form which will finish the wave count and possibly also the big bull-flag which will activate higher targets with a decisive move above the upper boundary.
The current situation is a situation where the index has to show if the flag-formation holds and confirms properly or shows to invalidate it which can happen when price closes below the lower boundary. When the bullish scenario plays out accordingly the index can move to its targets but there are still important resistance-clusters lying which first need to be taken out before considering any further substantial bullishness in the middle-to-long-run before this does not happen the index can still reverse and as there are already big divergences in the real economy and stock where many retailers rushing into while smart-money staying out the rallies are highly speculative backed and therefore the bearish scenario should not be kept aside when considering the longer-term perspective and in this case, it is important to not get too overly speculative of possible upcoming rallies and keep the reverse perspective in mind before there isn't validation.
In this manner, thank you for watching, support for more market insight and have a good day!
There are many roads to prosperity, but one must be taken.
Information provided is only educational and should not be used to take action in the markets

EU50 - EURO STOXX 50Hello Traders, if you agree with my idea put a like and feel free leave a comment to link your trading ideas.
Follow me for weekly analysis of swing trading support/resistance , fibonacci retracements, COT data.
For informations feel free to contact me.
Thanks for your support!

EU50EUR_ Targeted Aea Reached to Long As we are still in a bullish trend this trend has showed no signs of weakness and seems as if it is a continuous trend to the upside. we waiting for long confirmations on smaller time frames.
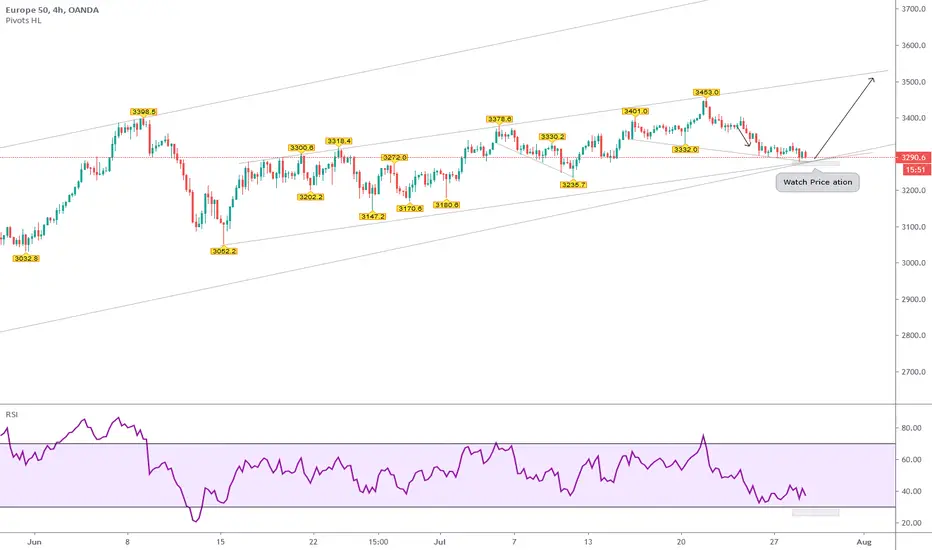


Euro stoxx50Would be looking to sell this when it retests to 3395 asuming it doest break above 3401. looking at selling to 3345 taking partials and breaking even at 3373.

Euro Stoxx 50 - Are you a believer?? If you believe in correlation among markets\risk assets, then you definitively want to keep an eye on the Euro Stoxx 50, Europe's most important stock market (along with the DAX 30). The pan-European index finds itself against 20 year falling channel resistance (RED), from which some catastrophic crashes have taken place in the past: 2000, 2007, 2015, and no less than NINE failed attempts to break above said resistance in the last 38 months alone!! If you watch carefully\zoom in on recent action, you'll se that price also finds itself just below the 50 and 200 weekly MAs... no matter how you like to trade, this are three BIG TIME resistances holding back the index. I'm of the opinion that whatever happens here for the Euro Stoxx 50, the same identical thing will happen to indexes in the US and around the world. Never underestimate Europe's ability to pull the whole world up OR down!! A breakout here, as unlikely as it may seem, would be very positive for US equity, while a rejection would almost surely spell trouble for global stocks. Watch this situation as it unfolds to have a crucial heads-up in your trading... if you know anything about what's going on in the Eurozone, then you probably know that this may very well be a historic junction!!
Full disclosure: while I own some European stocks, and many stocks in general (54% of total assets at this time), I have currently NO position on the Euro Stoxx 50.


EuroStoxx Long Futures Sep 21'20 ContractTrading Sep Futures with a Long bias based on the thesis:
US DJ, S&P rally seems to be peaking on its post-COVID rally.
ECO data out from the US generally seems strong as well.
Believe that international indices like NIFTY and STOXX will follow-suit.
Risk: Most of the rally has been done, hence watch for range trading from now till Sep.

Europe50 SELLCurrently trends are bullish approximately in all markets but in terms of technical We claim with high certainty that Strong bearish coming soon in all stock market and in terms of fundamental The reason can be described as a fear of 2nd wave of Coronavirus.
If you found this analysis useful, please like it and share it with others so they can benefit from it too.

EURO STOXX 50 (SHORT)EURO STOXX 50 - the opportunity is a SHORT with pricing collapsing to the BLUE zone and then huge potential falling of the cliff to the blue zone. as the crash unfolds and i have more data i will have a better outlook in prices falling to the YELLOW zone


EURO STOXX (wait for buying opportunity)EURO STOXX: we waiting for a downward move, causing havoc (year: 2020 - 2022) before buying, in anticipation of a multi decade bull market.
