London Stock Market Rally: From 7500 to 8700 The London Stock Index rally has commenced at the 7500 mark, with expectations that the upward movement will reach a peak around the 8700-pound level.
Following this anticipated high point, a price correction is likely to begin, moving towards the possible first and second target levels.
keeping an eye on potential opportunities during the correction phase.
UK100 trade ideas

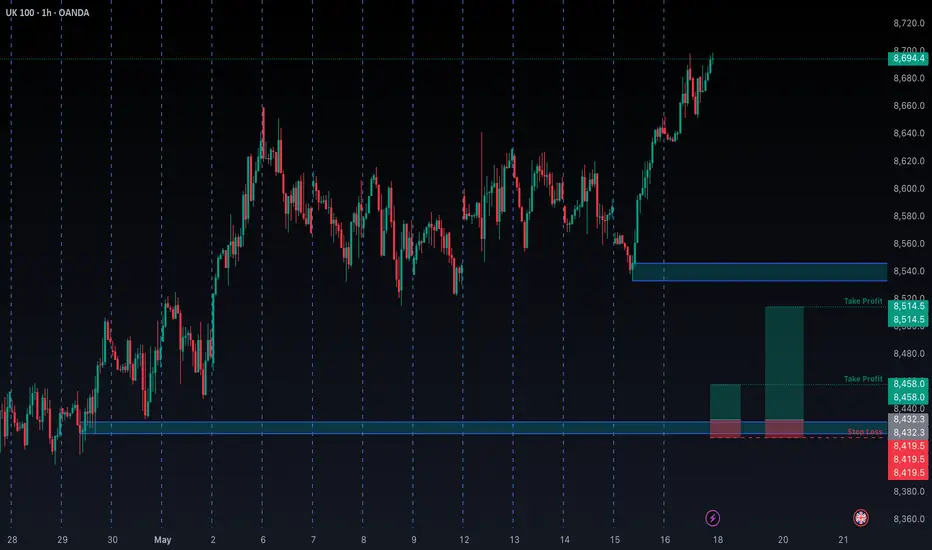
Trendline Break Continuation The price has been on a bullish trend and broke a larger trendline, now we see a smaller trendline as a continuation, followed by a pullback and now the price looks to make a bullish impulse at a higher high
WE ONLY TRADE PULLBACKS
UK100 - STRATEGY TO MAKE MILLIONSTeam, you have been killing the UK100 last week,
YESTERDAY, we will the AUS200
every day is a winning for us. I am about to make a video of education on how to kill the market daily!
Today we are preparing to short UK at 8742-8756
DOUBLE UP the short at 8785-96
Target range 1 at 8705-15
Target range 2 at 8672-8658
Remember: be humble, be focused and always care about risk management. Now, let's kill the UK100 market together.

FTSE 100: Bearish Order flowBearish Crab Pattern via the 1H timeframe. Let's see how this plays out.
There's also an order block at the bottom on the H4 timeframe. Maybe price could go bearish to mitigate it. As they say, false move beginning of the week.

Potential Buy Zone on FTSEI have several swing trade zones marked up on the FTSE, here's one of them.
Potential Buy Zone for the FTSEI have several swing trade zones marked up on the FTSE, here's one of them.

FTSE 100 Wave Analysis – 16 May 2025
- FTSE 100 broke the resistance level 8650.00
- Likely to rise to resistance level 8800.00
The FTSE 100 index recently broke the resistance level 8650.00, which stopped the previous medium-term impulse wave (1) at the start of this month.
The breakout of the resistance level 8650.00 should accelerate the active medium-term impulse wave (3) from the start of May.
Given the improved sentiment across the global equity markets, the FTSE 100 index can be expected to rise to the next resistance level 8800.00, which has been reversing the price from the start of February.

Can FTSE100 keep the momentum all the way to the all-time high?The FTSE:UKX bulls continue to show resilience and push the index higher. But the big question is, can we see a move all the way to the current all-time high?
Let's dig in...
MARKETSCOM:UK100
Let us know what you think in the comments below.
Thank you.
77.3% of retail investor accounts lose money when trading CFDs with this provider. You should consider whether you understand how CFDs work and whether you can afford to take the high risk of losing your money. Past performance is not necessarily indicative of future results. The value of investments may fall as well as rise and the investor may not get back the amount initially invested. This content is not intended for nor applicable to residents of the UK. Cryptocurrency CFDs and spread bets are restricted in the UK for all retail clients.

UK100 - FTSE100 - TIME TO MAKE MILLION ON SHORTHi Everyone,
I hope yesterday you enjoy 450-500 points on DOW/US30 when we have two long and two target hit
last 2-3 days we avoid the US30 because we wait for the good set up.
Same as UK we short last two day but we didn’t short yesterday.
Now you are going to kill the UK100 together
Please watch the CHART carefully as we want to EXTRA Short price at 8668-8682 ranges
DO not be afraid. I am PRO trader if you go to my profile and check out and click the video.
I show you how to make $5000 simple every week.
Also follow the 1st target at 6622-15. TAKE partial 30%-50% and BRING stop loss to BE
NOTE: once you took and it move back hit stop loss - SHORT AGAIN,
Second target at 8596-8582
Hope you enjoy the TRADE yesterday on US30, you can check trading view chart post yesterday!

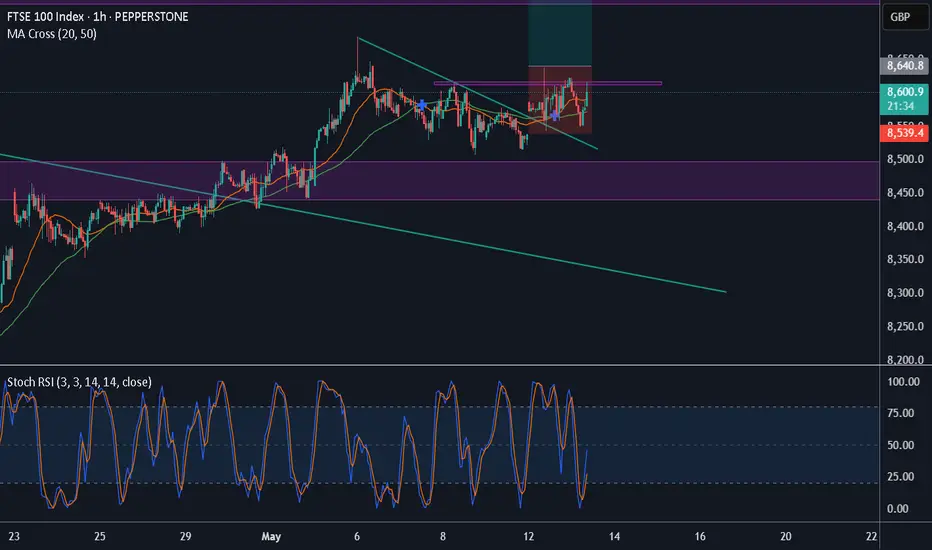
UK100 | Sideways | ShortUK100 is moving sideways and printing peaks between the support and resistance areas.

FTSE100 INTRADAY sideways consolidation supported at 8454The FTSE 100 is showing bullish momentum, supported by an ongoing uptrend. Recent price action suggests a breakout above a period of sideways consolidation, indicating strong buying interest.
Key Support: 8454 – This was the previous consolidation zone and now acts as a critical level.
If the index pulls back to 8454 and holds, it may resume the uptrend with potential upside targets at:
8650 (near-term resistance)
8730, then 8825 (longer-term targets)
Bearish Scenario: A daily close below 8454 would weaken the bullish case and could lead to a decline toward:
8373 (next support)
Then 8272 and possibly 8100 if selling pressure increases
Conclusion:
The FTSE 100 remains bullish above 8454. Watch for a bounce from this level to confirm further upside. A break below would shift the outlook to bearish in the short term.
This communication is for informational purposes only and should not be viewed as any form of recommendation as to a particular course of action or as investment advice. It is not intended as an offer or solicitation for the purchase or sale of any financial instrument or as an official confirmation of any transaction. Opinions, estimates and assumptions expressed herein are made as of the date of this communication and are subject to change without notice. This communication has been prepared based upon information, including market prices, data and other information, believed to be reliable; however, Trade Nation does not warrant its completeness or accuracy. All market prices and market data contained in or attached to this communication are indicative and subject to change without notice.

UK100 - time to SHORT and send UK into recession.SHORT UK100 at 8610, add more at 8622, (8638-42) and 8667-71)
Target 1 at 8592-8285
Target 2 at 8571-8564
Target 3 at 8549-8339
Once it hit first target, take 30% partial and bring stop loss to BE
It time to kill the UK100 and send them into recession.

FTSE Intra-day 15min 09-May-25Disclaimer: easyMarkets Account on TradingView allows you to combine easyMarkets industry leading conditions, regulated trading and tight fixed spreads with TradingView's powerful social network for traders, advanced charting and analytics. Access no slippage on limit orders, tight fixed spreads, negative balance protection, no hidden fees or commission, and seamless integration.
Any opinions, news, research, analyses, prices, other information, or links to third-party sites contained on this website are provided on an "as-is" basis, are intended only to be informative, is not an advice nor a recommendation, nor research, or a record of our trading prices, or an offer of, or solicitation for a transaction in any financial instrument and thus should not be treated as such. The information provided does not involve any specific investment objectives, financial situation and needs of any specific person who may receive it. Please be aware, that past performance is not a reliable indicator of future performance and/or results. Past Performance or Forward-looking scenarios based upon the reasonable beliefs of the third-party provider are not a guarantee of future performance. Actual results may differ materially from those anticipated in forward-looking or past performance statements. easyMarkets makes no representation or warranty and assumes no liability as to the accuracy or completeness of the information provided, nor any loss arising from any investment based on a recommendation, forecast or any information supplied by any third-party.

FTSE INTRADAY Bullish Flag continuation pattern?The FTSE 100 is showing bullish momentum, supported by an ongoing uptrend. Recent price action suggests a breakout above a period of sideways consolidation, indicating strong buying interest.
Key Support: 8454 – This was the previous consolidation zone and now acts as a critical level.
If the index pulls back to 8454 and holds, it may resume the uptrend with potential upside targets at:
8650 (near-term resistance)
8730, then 8825 (longer-term targets)
Bearish Scenario: A daily close below 8454 would weaken the bullish case and could lead to a decline toward:
8373 (next support)
Then 8272 and possibly 8100 if selling pressure increases
Conclusion:
The FTSE 100 remains bullish above 8454. Watch for a bounce from this level to confirm further upside. A break below would shift the outlook to bearish in the short term.
This communication is for informational purposes only and should not be viewed as any form of recommendation as to a particular course of action or as investment advice. It is not intended as an offer or solicitation for the purchase or sale of any financial instrument or as an official confirmation of any transaction. Opinions, estimates and assumptions expressed herein are made as of the date of this communication and are subject to change without notice. This communication has been prepared based upon information, including market prices, data and other information, believed to be reliable; however, Trade Nation does not warrant its completeness or accuracy. All market prices and market data contained in or attached to this communication are indicative and subject to change without notice.

UK100 – Buy Limit Trade Setup (Intraday Idea)Expires: 09/05/2025 21:00
Trade Summary
Type: Buy Limit
Entry: 8465
Target: 8669
Stop Loss: 8394
Risk/Reward Ratio: ~2.9:1
Duration: Intraday
Technical View
Price action suggests a bottoming formation, which is typically a precursor to a bullish reversal.
Short-term pullback expected to offer a buying opportunity near the 8465 level.
Trend bias remains upward, and any dips are viewed as entry opportunities within this context.
Buying near bespoke support levels could improve risk/reward positioning.
Further upside expected with resistance at 8620, then 8915.
Key Technical Levels
Support Levels: 8390 / 8225 / 8060
Resistance Levels: 8620 / 8915 / 9290
Disclosure: I am part of Trade Nation's Influencer program and receive a monthly fee for using their TradingView charts in my analysis.

FTSE 100 H4 | Potential bullish bounceThe FTSE 100 (UK100) is falling towards an overlap support and could potentially bounce off this level to climb higher.
Buy entry is at 8,474.09 which is an overlap support that aligns close to the 23.6% Fibonacci retracement.
Stop loss is at 8,150.00 which is a level that lies underneath an overlap support.
Take profit is at 8,744.02 which is a multi-swing-high resistance.
High Risk Investment Warning
Trading Forex/CFDs on margin carries a high level of risk and may not be suitable for all investors. Leverage can work against you.
Stratos Markets Limited (tradu.com):
CFDs are complex instruments and come with a high risk of losing money rapidly due to leverage. 63% of retail investor accounts lose money when trading CFDs with this provider. You should consider whether you understand how CFDs work and whether you can afford to take the high risk of losing your money.
Stratos Europe Ltd (tradu.com):
CFDs are complex instruments and come with a high risk of losing money rapidly due to leverage. 63% of retail investor accounts lose money when trading CFDs with this provider. You should consider whether you understand how CFDs work and whether you can afford to take the high risk of losing your money.
Stratos Global LLC (tradu.com):
Losses can exceed deposits.
Please be advised that the information presented on TradingView is provided to Tradu (‘Company’, ‘we’) by a third-party provider (‘TFA Global Pte Ltd’). Please be reminded that you are solely responsible for the trading decisions on your account. There is a very high degree of risk involved in trading. Any information and/or content is intended entirely for research, educational and informational purposes only and does not constitute investment or consultation advice or investment strategy. The information is not tailored to the investment needs of any specific person and therefore does not involve a consideration of any of the investment objectives, financial situation or needs of any viewer that may receive it. Kindly also note that past performance is not a reliable indicator of future results. Actual results may differ materially from those anticipated in forward-looking or past performance statements. We assume no liability as to the accuracy or completeness of any of the information and/or content provided herein and the Company cannot be held responsible for any omission, mistake nor for any loss or damage including without limitation to any loss of profit which may arise from reliance on any information supplied by TFA Global Pte Ltd.
The speaker(s) is neither an employee, agent nor representative of Tradu and is therefore acting independently. The opinions given are their own, constitute general market commentary, and do not constitute the opinion or advice of Tradu or any form of personal or investment advice. Tradu neither endorses nor guarantees offerings of third-party speakers, nor is Tradu responsible for the content, veracity or opinions of third-party speakers, presenters or participants.

FTSE INTRADAY consolidation zone retest The FTSE 100 is showing bullish momentum, supported by an ongoing uptrend. Recent price action suggests a breakout above a period of sideways consolidation, indicating strong buying interest.
Key Support: 8454 – This was the previous consolidation zone and now acts as a critical level.
If the index pulls back to 8454 and holds, it may resume the uptrend with potential upside targets at:
8650 (near-term resistance)
8730, then 8825 (longer-term targets)
Bearish Scenario: A daily close below 8454 would weaken the bullish case and could lead to a decline toward:
8373 (next support)
Then 8272 and possibly 8100 if selling pressure increases
Conclusion:
The FTSE 100 remains bullish above 8454. Watch for a bounce from this level to confirm further upside. A break below would shift the outlook to bearish in the short term.
This communication is for informational purposes only and should not be viewed as any form of recommendation as to a particular course of action or as investment advice. It is not intended as an offer or solicitation for the purchase or sale of any financial instrument or as an official confirmation of any transaction. Opinions, estimates and assumptions expressed herein are made as of the date of this communication and are subject to change without notice. This communication has been prepared based upon information, including market prices, data and other information, believed to be reliable; however, Trade Nation does not warrant its completeness or accuracy. All market prices and market data contained in or attached to this communication are indicative and subject to change without notice.

PineScript v6: Conditional Expressions from Libraries
I thought it appropriate to make some quick notes on calling conditional expressions from PineScript v6 libraries, seeing as I have recently updated all of my libraries to v6 and most of my function exports output booleans or values that are ultimately derived from other functions that output booleans.
When calling functions in v6 that output booleans or values derived from other functions that output booleans, it is best practice to first declare the function return globally before you use said output as input for anything else.
For example, instead of calling my swing low and uptrend functions (which both return booleans) as part of a broader conditional expression:
//@version=6
indicator('Example Conditional Expression 1')
import theEccentricTrader/PubLibSwing/3 as sw
import theEccentricTrader/PubLibTrend/2 as tr
uptrend = sw.sl() and tr.ut()
plotshape(uptrend)
I would first declare the function returns as global variables and then call the broader conditional expression using said variables:
//@version=6
indicator('Example Conditional Expression 2')
import theEccentricTrader/PubLibSwing/3 as sw
import theEccentricTrader/PubLibTrend/2 as tr
sl = sw.sl()
ut = tr.ut()
uptrend = sl and ut
plotshape(uptrend)
This demonstrates different behaviour from v5, where you could combine functions that output booleans in conditional expressions without error or warning.
The same also applies to functions that output values derived from other functions that output booleans. In the example below, my swing low price and bar index functions output float and integer values, respectively, but these values are derived from the swing low function, which is a function that returns a boolean. So these return values should also be first declared globally for later use, just like the swing low and uptrend functions:
//@version=6
indicator('Example Conditional Expression 3', overlay = true)
import theEccentricTrader/PubLibSwing/3 as sw
import theEccentricTrader/PubLibTrend/2 as tr
sl = sw.sl()
ut = tr.ut()
slp_0 = sw.slp(0)
slpbi_0 = sw.slpbi(0)
slp_1 = sw.slp(1)
slpbi_1 = sw.slpbi(1)
if sl and ut
line.new(slpbi_1, slp_1, slpbi_0, slp_0, color = color.green)

UK100 FTSEWhat is UK100?
UK100, commonly known as the FTSE 100 Index or the Footsie, is the United Kingdom’s premier stock market index. It tracks the performance of the 100 largest and most highly capitalized blue-chip companies listed on the London Stock Exchange (LSE). The index is capitalization-weighted, meaning companies with larger market caps have a greater influence on the index’s movements.
As of March 2025, the FTSE 100 had a total market capitalization of approximately £2.12 trillion.
The index includes many internationally focused companies, so its performance is influenced by global economic factors and currency exchange rates, not just the UK economy.
Does Bond Yield Affect UK100?
Yes, bond yields significantly affect the FTSE 100 in several ways:
Rising UK government bond yields (gilts) increase borrowing costs for companies, which can reduce profits and weigh on stock prices, including those in the FTSE 100.
Higher bond yields also make fixed-income investments more attractive relative to equities, potentially causing capital to flow out of stocks and into bonds, putting downward pressure on the index.
Conversely, falling bond yields lower borrowing costs and often encourage investment in equities, supporting the FTSE 100.
Bond yield movements are also influenced by monetary policy expectations, inflation outlook, and fiscal policy, which indirectly impact stock valuations.
Recent volatility in German and UK bond yields has caused ripple effects in the FTSE 100, reflecting concerns about interest rates and economic outlook.
Major Companies That Make Up UK100 (Selected Key Constituents)
The FTSE 100 includes companies from various sectors such as banking, energy, healthcare, consumer goods, and industrials. Some of the largest and most influential companies by market capitalization as of 2025 include:
Company Sector Approx. Market Cap (2025)
AstraZeneca Healthcare £190+ billion
Shell Energy £185+ billion
HSBC Holdings Banking & Financials £130+ billion
Unilever Consumer Goods £100+ billion
Rio Tinto Mining & Materials £95+ billion
BP Energy £85+ billion
GlaxoSmithKline (GSK) Healthcare £75+ billion
Diageo Consumer Goods Large-cap
Barclays Banking & Financials Large-cap
British American Tobacco Consumer Goods Large-cap
The FTSE 100 covers 20 industry sectors, with Banks, Health Care, Industrial Goods & Services, and Energy sectors making up about 50% of the index’s total capitalization.
Summary
What is UK100? The FTSE 100 Index, tracking the 100 largest UK-listed companies by market cap
Bond Yield Impact Rising yields increase borrowing costs and attract capital to bonds, often pressuring stocks; falling yields support equities
Key Companies AstraZeneca, Shell, HSBC, Unilever, Rio Tinto, BP, GSK, Diageo, Barclays, British American Tobacco
In conclusion, the UK100 (FTSE 100) is a major UK stock market index heavily influenced by global economic factors, including bond yields. Movements in UK government bond yields affect corporate borrowing costs and investor asset allocation decisions, thereby impacting the FTSE 100’s price action. The index is dominated by large multinational companies across diverse sectors, making it a broad indicator of UK-listed blue-chip performance

FTSE100 INTRADAY bullish breakout supported at 8454The FTSE 100 is showing bullish momentum, supported by an ongoing uptrend. Recent price action suggests a breakout above a period of sideways consolidation, indicating strong buying interest.
Key Support: 8454 – This was the previous consolidation zone and now acts as a critical level.
If the index pulls back to 8454 and holds, it may resume the uptrend with potential upside targets at:
8650 (near-term resistance)
8730, then 8825 (longer-term targets)
Bearish Scenario: A daily close below 8454 would weaken the bullish case and could lead to a decline toward:
8373 (next support)
Then 8272 and possibly 8100 if selling pressure increases
Conclusion:
The FTSE 100 remains bullish above 8454. Watch for a bounce from this level to confirm further upside. A break below would shift the outlook to bearish in the short term.
This communication is for informational purposes only and should not be viewed as any form of recommendation as to a particular course of action or as investment advice. It is not intended as an offer or solicitation for the purchase or sale of any financial instrument or as an official confirmation of any transaction. Opinions, estimates and assumptions expressed herein are made as of the date of this communication and are subject to change without notice. This communication has been prepared based upon information, including market prices, data and other information, believed to be reliable; however, Trade Nation does not warrant its completeness or accuracy. All market prices and market data contained in or attached to this communication are indicative and subject to change without notice.

Bullish momentum to extend?UK100 is reacting off the pivot which has been identified as a pullback support and could rise to the pullback resistance.
Pivot: 8,462.50
1st Support: 8,326.30
1st Resistance: 8,722.80
Risk Warning:
Trading Forex and CFDs carries a high level of risk to your capital and you should only trade with money you can afford to lose. Trading Forex and CFDs may not be suitable for all investors, so please ensure that you fully understand the risks involved and seek independent advice if necessary.
Disclaimer:
The above opinions given constitute general market commentary, and do not constitute the opinion or advice of IC Markets or any form of personal or investment advice.
Any opinions, news, research, analyses, prices, other information, or links to third-party sites contained on this website are provided on an "as-is" basis, are intended only to be informative, is not an advice nor a recommendation, nor research, or a record of our trading prices, or an offer of, or solicitation for a transaction in any financial instrument and thus should not be treated as such. The information provided does not involve any specific investment objectives, financial situation and needs of any specific person who may receive it. Please be aware, that past performance is not a reliable indicator of future performance and/or results. Past Performance or Forward-looking scenarios based upon the reasonable beliefs of the third-party provider are not a guarantee of future performance. Actual results may differ materially from those anticipated in forward-looking or past performance statements. IC Markets makes no representation or warranty and assumes no liability as to the accuracy or completeness of the information provided, nor any loss arising from any investment based on a recommendation, forecast or any information supplied by any third-party.

Bullish continuation?UK100 has reacted off the pivot and could potentially rise to the 1st resistance.
Pivot: 8,462.50
2st Support: 8,326.30
1st Resistance: 8,626.49
Risk Warning:
Trading Forex and CFDs carries a high level of risk to your capital and you should only trade with money you can afford to lose. Trading Forex and CFDs may not be suitable for all investors, so please ensure that you fully understand the risks involved and seek independent advice if necessary.
Disclaimer:
The above opinions given constitute general market commentary, and do not constitute the opinion or advice of IC Markets or any form of personal or investment advice.
Any opinions, news, research, analyses, prices, other information, or links to third-party sites contained on this website are provided on an "as-is" basis, are intended only to be informative, is not an advice nor a recommendation, nor research, or a record of our trading prices, or an offer of, or solicitation for a transaction in any financial instrument and thus should not be treated as such. The information provided does not involve any specific investment objectives, financial situation and needs of any specific person who may receive it. Please be aware, that past performance is not a reliable indicator of future performance and/or results. Past Performance or Forward-looking scenarios based upon the reasonable beliefs of the third-party provider are not a guarantee of future performance. Actual results may differ materially from those anticipated in forward-looking or past performance statements. IC Markets makes no representation or warranty and assumes no liability as to the accuracy or completeness of the information provided, nor any loss arising from any investment based on a recommendation, forecast or any information supplied by any third-party.

UK100 Bulls Charging – Will They Breach 8,490 or Stall?Price is currently consolidating just below the 8,490 🔼 resistance after a strong bullish rally. The structure remains bullish with consistent higher lows, and price is testing a key supply-turned-resistance zone. Bulls need a clear breakout to maintain momentum.
Support at: 8,378 🔽, 8,165 🔽, 7,935 🔽, 7,600 🔽
Resistance at: 8,490 🔼, 8,625 🔼, 8,729 🔼
Bias:
🔼 Bullish: A confirmed breakout above 8,490 could trigger a continuation toward 8,625 and 8,779.
🔽 Bearish: Rejection at 8,490 or break below 8,378 could initiate a drop back to 8,165 or lower.
📛 Disclaimer: This is not financial advice. Trade at your own risk.
