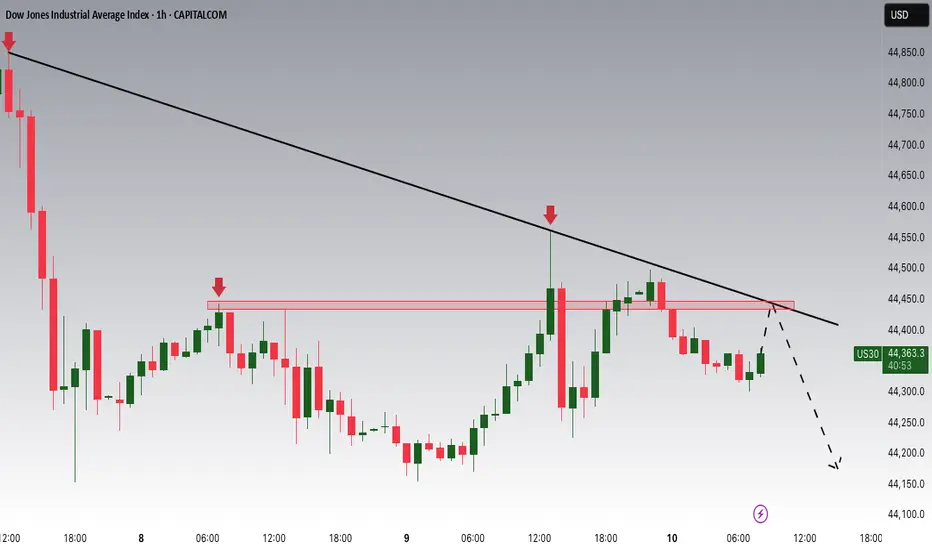
Do you agree with a big profit in US30?
Hello friend
Do you think the orange line will break?
What if it breaks?
Just wait and collect the money.
If you liked my analysis, please support me by liking, commenting and subscribing. Thanks friend
USAIND trade ideas

US30: Move Up Expected! Long!
My dear friends,
Today we will analyse US30 together☺️
The in-trend continuation seems likely as the current long-term trend appears to be strong, and price is holding above a key level of 44,393.91 So a bullish continuation seems plausible, targeting the next high. We should enter on confirmation, and place a stop-loss beyond the recent swing level.
❤️Sending you lots of Love and Hugs❤️

Dow Jones Potential DownsidesHey Traders, in today's trading session we are monitoring US30 for a selling opportunity around 44,450 zone. Dow Jones is trading in a downtrend and currently is in a correction phase in which it is approaching the trend at 44,450 support and resistance area.
Trade safe, Joe.
First obvious major clue may be stronger than the second.I think this shows a clear direction in price action. Strong moves addition to bullish trend line and internal structure. Now at the moment, I am looking at the trend line as a major attraction point in the current moment. Some opinions may say that it's more correct to sell down lower from the trend line, and that might be correct. Although, at this moment, price has yet to have a proper pullback after a clean breakout below. It might honestly just be too obvious that it'd go down lower after retesting trend line, so in my opinion, I think the most clear entry right now is to buy now at a low point, might as well be called a liquidity pool. So right now in this strong trend change, the next obvious major potential for move is going to be back at trend line. The next obvious move will be even more obvious, so then it might also be lacking stability, but until then, my focus here is to buy within a potential deep pullback.
US30 BUY IDEA🔍 Key Technical Highlights:
• Demand Zone Entry:
• Price tapped into a strong demand zone (gray box) around 44,280 – 44,330, signaling potential institutional buying interest.
• Liquidity Grab:
• Sell-side liquidity has been swept just below the previous lows, which aligns with a classic SMC liquidity manipulation before a bullish move.
• Projected Market Structure Shift:
• Price is forming a higher low, hinting at a potential reversal and bullish BOS (Break of Structure).
• Expecting a multi-leg bullish move, targeting 44,812 area, filling imbalance and reaching premium zones.
• Risk-Reward Outlook:
• Stop loss placed just below the demand zone.
• Take profit aligned with previous highs and inefficiency zone — a favorable R:R ratio for swing traders.
⸻
🧠 Smart Money Narrative:
1. Sweep of liquidity below demand.
2. Institutional buy orders triggered.
3. Low-risk buy opportunity with clear internal structure shift.
4. Bullish continuation toward premium pricing and unfilled imbalances.

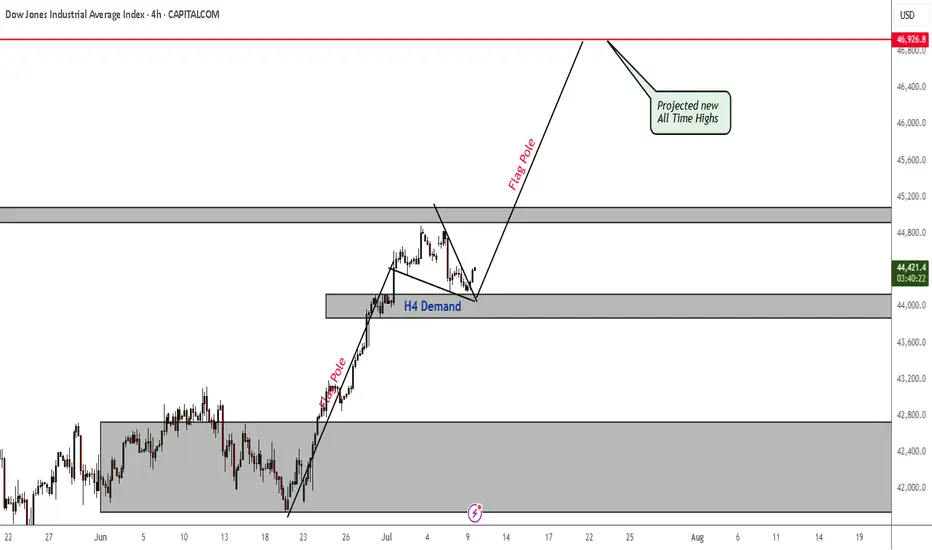
US30 Projected All Time Highs As Bullish Trend ResumesPrice is currently being supported by an H4 demand zone. If this demand zone continues to hold and apply pressure to the upside, we will soon be seeing new all time highs. Which really should not surprise us because as we all know, indices are generally bullish long term.
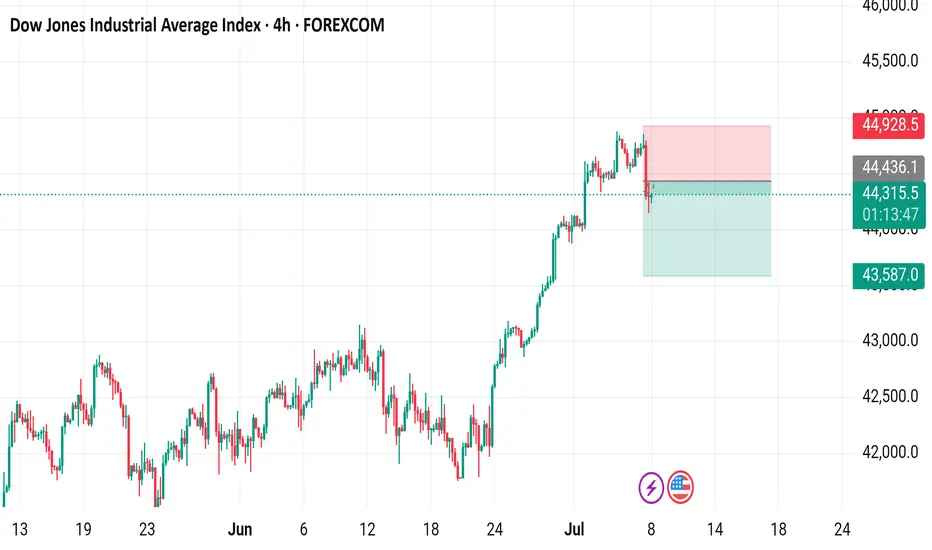
Dow Jones Industrial Average Index - 4h Chart (FOREXCOM)4-hour candlestick chart of the Dow Jones Industrial Average Index (US30) showing the price movement from late June to early July 2025. The current price is 44,314.0, with a slight increase of +23.0 (+0.05%). The chart includes buy and sell signals at 44,316.5 and 44,310.5 respectively, with highlighted resistance and support zones. The index has shown a general upward trend with some volatility over the period.
Market ViewMarket Structure Shift
Previous Day Low Breach
London Session
Divergence
Watch
Trade
Manage
Smile

US30 H4 I Bearish Reversal Based on the H4 chart, the price is approaching our sell entry level at 44576.41, a pullback resistance.
Our take profit is set at 44162.08, an overlap support.
The stop loss is set at 44922.32, a swing high resistance.
High Risk Investment Warning
Trading Forex/CFDs on margin carries a high level of risk and may not be suitable for all investors. Leverage can work against you.
Stratos Markets Limited (tradu.com ):
CFDs are complex instruments and come with a high risk of losing money rapidly due to leverage. 63% of retail investor accounts lose money when trading CFDs with this provider. You should consider whether you understand how CFDs work and whether you can afford to take the high risk of losing your money.
Stratos Europe Ltd (tradu.com ):
CFDs are complex instruments and come with a high risk of losing money rapidly due to leverage. 63% of retail investor accounts lose money when trading CFDs with this provider. You should consider whether you understand how CFDs work and whether you can afford to take the high risk of losing your money.
Stratos Global LLC (tradu.com ):
Losses can exceed deposits.
Please be advised that the information presented on TradingView is provided to Tradu (‘Company’, ‘we’) by a third-party provider (‘TFA Global Pte Ltd’). Please be reminded that you are solely responsible for the trading decisions on your account. There is a very high degree of risk involved in trading. Any information and/or content is intended entirely for research, educational and informational purposes only and does not constitute investment or consultation advice or investment strategy. The information is not tailored to the investment needs of any specific person and therefore does not involve a consideration of any of the investment objectives, financial situation or needs of any viewer that may receive it. Kindly also note that past performance is not a reliable indicator of future results. Actual results may differ materially from those anticipated in forward-looking or past performance statements. We assume no liability as to the accuracy or completeness of any of the information and/or content provided herein and the Company cannot be held responsible for any omission, mistake nor for any loss or damage including without limitation to any loss of profit which may arise from reliance on any information supplied by TFA Global Pte Ltd.
The speaker(s) is neither an employee, agent nor representative of Tradu and is therefore acting independently. The opinions given are their own, constitute general market commentary, and do not constitute the opinion or advice of Tradu or any form of personal or investment advice. Tradu neither endorses nor guarantees offerings of third-party speakers, nor is Tradu responsible for the content, veracity or opinions of third-party speakers, presenters or participants.

Dow Jones Extends Rally Toward New HighsOver the past two trading sessions, the Dow Jones Industrial Average has gained nearly 1%, approaching the all-time high zone near 45,000 points. For now, the bullish bias remains intact, supported by the Federal Reserve’s announcement that a rate cut may occur later this year, despite renewed concerns over a potential reignition of trade war tensions. If buying pressure holds in the short term, this could fuel further upward momentum, potentially pushing the index to new record levels.
Consistent Uptrend
The recent bullish swings have sustained a steady level of investor confidence, allowing the upward trend to remain unbroken. So far, there hasn’t been any significant selling correction strong enough to break the structure, meaning the dominant long-term uptrend remains intact. This continues to be the most important technical pattern to monitor, although the index is once again testing previous highs, where short-term selling corrections may emerge.
Technical Indicators
RSI: The RSI line is hovering near the overbought level around 70, suggesting that buying momentum has created an imbalance in market forces. This may open the door to a potential technical pullback as the index approaches historical highs.
ADX: The ADX line continues to rise above the neutral 20 level, maintaining a steady upward slope in recent sessions. If this trend continues, it could indicate increasing strength behind the current uptrend, especially if key resistance levels are broken.
Key Levels:
44,970 – Major Resistance: This level marks the all-time high and serves as the most important short-term resistance. A breakout above it could strengthen the bullish bias, open the door to new record highs, and further confirm the ongoing uptrend.
43,863 – Intermediate Support: A technical indecision zone seen in late February. A drop below this level may trigger a period of short-term neutrality or sideways movement.
42,756 – Critical Support: This zone aligns with the 50- and 200-period moving averages, making it a key technical area. A break below this level may signal the end of the current bullish trend and initiate a deeper correction.
Written by Julian Pineda, CFA – Market Analyst

US30 Sell IdeaSelling in the 44815–44886 zone, targeting a drop to 44476.50 with a stop loss at 44927.50 to cap risk. This setup aims to catch a pullback from resistance after the recent upward move, expecting the price to retrace toward the lower support area. Trade with discipline and wait for bearish confirmation around the entry zone.

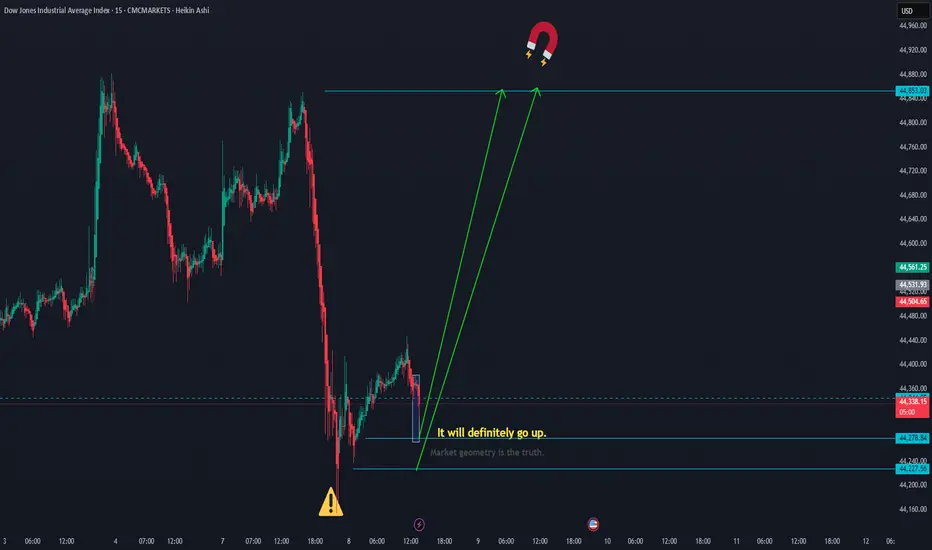
The dowjones should move upThe Dow Jones should move up to 44,853.
The levels 44,278.84 and 44,227.56 are good potential points for a bullish reversal. CMCMARKETS:US30
US30: Buy ideaBuy idea on US30 as you can see on the chart because we have a good intersection between the resistance line and the support line.

US30 Consolidates Below Resistance – Tariff Risks LoomUS30 – Market Overview
The price is currently consolidating within the range of 44490 to 44180, awaiting a breakout to determine the next directional move.
Bearish Scenario:
As long as the price trades below 44490, we expect bearish volatility to retest 44180.
A confirmed 1H close below 44180 would open the path toward 43960 and 43760.
Bullish Scenario:
If the price closes above 44490, it will likely trigger a bullish move toward 44750, with potential extension to 44970 ATH and beyond.
Note: Market sentiment remains sensitive to tariff-related developments, which may drive sharp moves in either direction.
Pivot Level: 44490
Support: 44180, 43960, 43770
Resistance: 44750, 44960, 45100

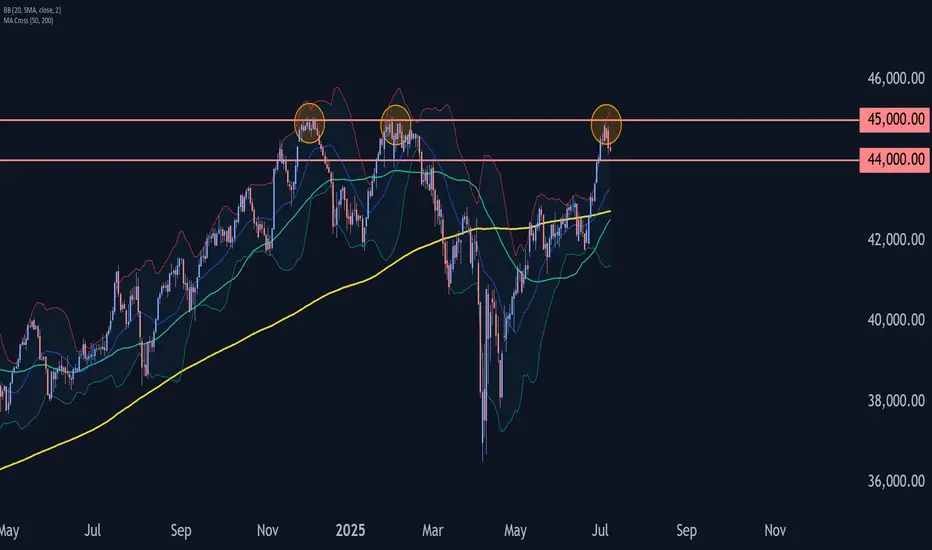
Dow Jones Wave Analysis – 8 July 2025- Dow Jones reversed from long-term resistance level 45000.00
- Likely to fall to support level 44000.00
Dow Jones index recently reversed down from the resistance zone located between the long-term resistance level 45000.00 (which has been steadily reversing the price from the end of November) and the upper daily Bollinger Band.
The downward reversal from this resistance zone stopped the previous medium-term ABC correction (2) from the start of April.
Given the strength of the resistance level 45000.00 and the overbought daily Stochastic, Dow Jones index can be expected to fall to the next support level 44000.00 (target price for the completion of the active impulse wave i).
US 30 is still bullish OverallThe Buy set up remains higher probability set up till we get a bearish confirmation and if that happens very instructively, then the extreme POI would be a great TP target and the next higher probability buy trade set up


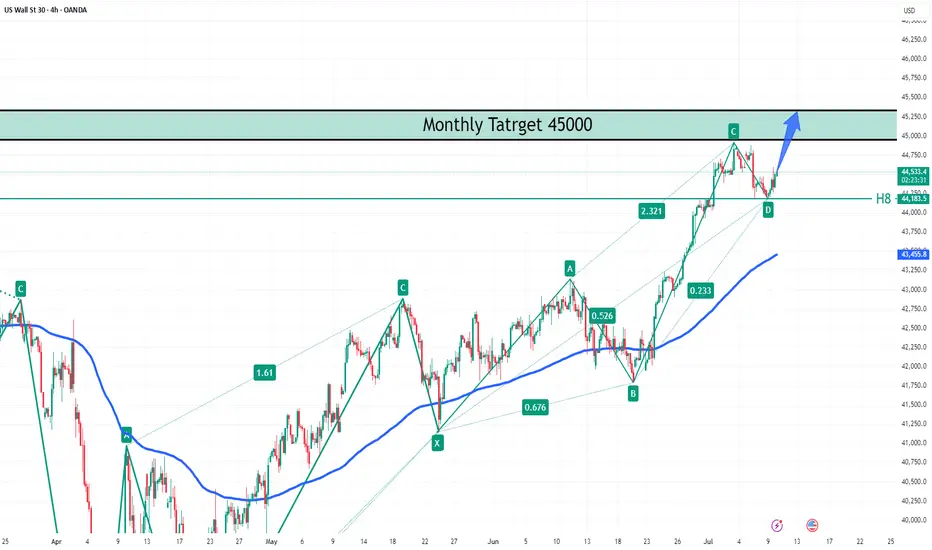
Dow Jones (US30): Recovery in Motion — Target at 45,000Market Overview:
The Dow Jones index holds above the support zone at 44,183 after a local correction. The broader trend remains bullish, with the primary target set near the monthly resistance zone at 45,000.
Technical Signals & Formations:
— Completed ABCD pattern
— Support confirmed at H8 level (44,183)
— EMA acting as dynamic support
— Upside potential toward channel resistance
Key Levels:
Support: 44,183, 43,455
Resistance/Target: 45,000
Scenario:
Primary: If Dow Jones remains above 44,183, continuation toward 45,000 is likely.
Alternative: A break below 44,183 could trigger a deeper correction toward 43,455.
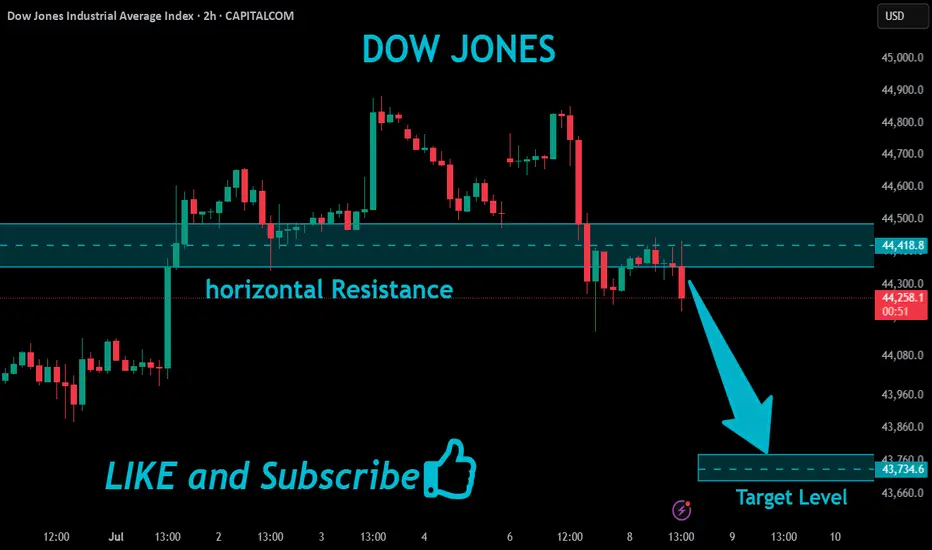
US30 Will Fall!
HI,Traders !
US30 made a retest
Of the key horizontal
Resistance level of 44418.8
From where we are
Already seeing a bearish
Reaction and we will
Be expecting a
Further bearish move down !
Comment and subscribe to help us grow !
Us30 Long Day Trade New York OpenIm looking for a long on the Us30 for a 1:3 min , im trade a long after a the retest due to the the trend has been bullish

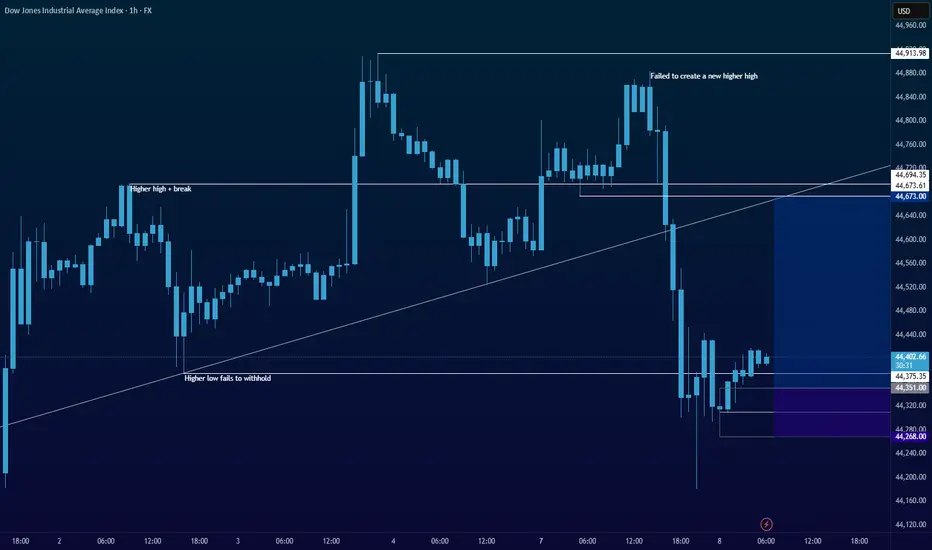
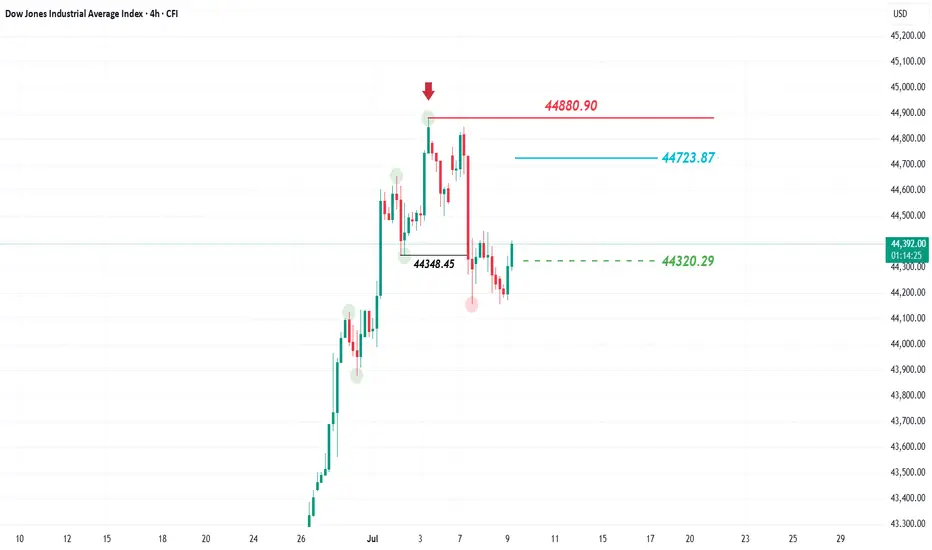
Dow Jones takes a different path!US President Donald Trump announced a postponement of the suspension of tariffs from July 9 to August 1, stressing that this deadline is final and will not be delayed again.
This decision has left the markets cautious, particularly US indices, but the Dow Jones Index has taken a different route compared to the S&P 500 and Nasdaq, which are generally trending upwards. Meanwhile, the Dow has shifted its direction from bullish to bearish.
On Monday, July 7 2025, the Dow Jones fell and recorded a lower low at 44,348.45, below its previous higher low. This signals a trend reversal on the 4-hour chart from bullish to bearish, a trend it had maintained for the past few weeks.
What’s the next expected move?
The current rise is considered a corrective move aiming to retest the 44,723.87 level, before likely dropping again to target 44,320.29. The bearish outlook would be invalidated if the price rises above 44,880.90 and closes a 4-hour candle above
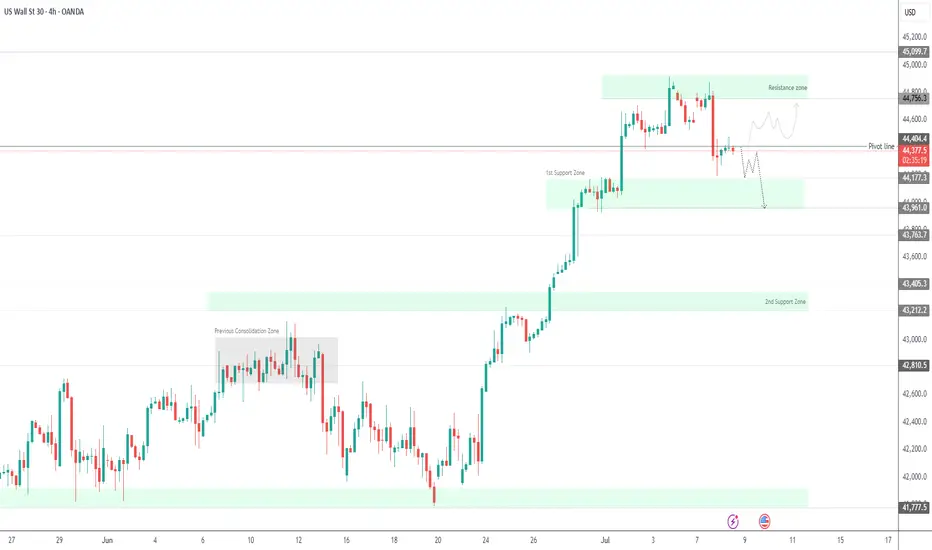
Dow Jones Below Key Pivot – Tariff Talks to Define Next MoveDow Jones – Overview
Fundamental Outlook:
In April, President Trump capped all so-called reciprocal tariffs at 10% until July 9, giving room for trade negotiations with key partners. That same month, the Nasdaq slipped into bear market territory, while the Dow and S&P 500 entered correction zones.
Since then, Wall Street has rebounded sharply. Last week, both the Nasdaq and S&P 500 surged to all-time highs, driven by a strong labor market that helped ease recession fears.
Technical Outlook:
Currently, Dow Jones is trading below the pivot level at 44410, which signals ongoing bearish momentum.
A sustained move below 44410 supports further downside toward 44180, with a break below this level opening the path to 43960.
However, if price reverses and closes above 44410 on the 1H or 4H timeframe, it may trigger a bullish move targeting 44750 and beyond.
Support: 44180 / 43960 / 43770
Resistance: 44515 / 44750 / 45100
Note:
Progress in tariff negotiations would likely support further upside in U.S. indices.
Lack of resolution may keep the Dow under bearish pressure in the short term.
US30 Is Bearish! Sell!
Please, check our technical outlook for US30.
Time Frame: 12h
Current Trend: Bearish
Sentiment: Overbought (based on 7-period RSI)
Forecast: Bearish
The price is testing a key resistance 44,371.8.
Taking into consideration the current market trend & overbought RSI, chances will be high to see a bearish movement to the downside at least to 43,586.3 level.
P.S
Please, note that an oversold/overbought condition can last for a long time, and therefore being oversold/overbought doesn't mean a price rally will come soon, or at all.
Disclosure: I am part of Trade Nation's Influencer program and receive a monthly fee for using their TradingView charts in my analysis.
Like and subscribe and comment my ideas if you enjoy them!
